413
Abstract
Empirical methods should be restricted to situations similar to the circum-stances used for their development. The Stability Graph Method, irst proposed by Mathews et al. (1981) and later modiied by Potvin (1988), was based on data from Canadian and Australian mines. Therefore, there is no evidence of their use in the Brazilian geomechanical context. The Stability Graph Method is intended to design a stable open stope in mines using the Sublevel Stoping Mining method. The pres-ent study investigates the applicability of the methods in Sublevel Stoping Brazilian mines. This is a contribution to the validation of the use of the methods in the Brazil-ian geomechanical context.
Keywords: : stability graph, overbreak, open stope.
Resumo
Qualquer método empírico tem sua aplicabilidade restrita a situações onde há semelhanças com os dados utilizados para sua elaboração. O Método do Gráico de Estabilidade, proposto primeiramente por Mathews et al. (1981) e posteriormente modiicado por Potvin (1988), foi desenvolvido a partir de dados relativos a minas canadenses e australianas. O Método do Gráico de Estabilidade tem a inalidade de estimar as dimensões para um realce estável em minas que utilizam o Método de Lavra Sublevel Stoping. Portanto não há evidências de que sua utilização, no con-texto geomecânico brasileiro, permita uma boa estimativa das dimensões do realce. O presente trabalho buscou evidências para aplicação dos métodos em minas de Su-blevel Stoping brasileiras. Esta é uma contribuição para a validação da utilização do método no contexto geomecânico brasileiro.
Palavras-chave: gráico de estabilidade, diluição, realces. Michel Melo
CEFET -MG - DEMIN Araxá - Minas Gerais – Brazil [email protected]
Cláudio Lúcio Lopes Pinto
Universidade Federal de Minas Gerais – Departamento de Engenharia de Minas Belo Horizonte - Minas Gerais – Brazil [email protected]
José lldefonso Gusmão Dutra.
Universidade Federal de Minas Gerais – Departamento de Engenharia de Minas Belo Horizonte - Minas Gerais – Brazil [email protected]
Potvin stability graph applied
to brazilian geomechanic environment
Gráfico de estabilidade aplicado ao contexto
geomecânico brasileiro
Mining
Mineração
1. Introduction
The open stope stability can be es-timated by its operational dilution. This variable distinguishes the planned stope from the actual excavated stope. Dilu-tion decreases the stope’s average grade and affects the mine production rate.
Aiming for higher productivity and to increase the knowledge on open stopes, Mathews el al. (1981) proposed the Stability Graph Method based on
26 case studies of three Canadian and Australian mines. Contributions were made by Potvin (1988), Palkanis (1986) and Mawdesley et al. (2001).
The Stability Graph Method em-ploys a chart where the stability number is plotted in the y axis and the hydrau-lic radius in the x axis. The stability number is a modiication of Barton’s et al. (1974) NGI- Q rock mass
classiica-tion. Kaiser et al. (1986) suggest that the SRF coeficient is conservative as it was conceived to be applied in civil constructions. Three new factors were created in replacement of the SRF coef-icient: The A factor related to the stress ield; the B factor that refers to the most critical joint; and the C factor taking into account the gravity effects. Povin’s Stability Number can be expressed by:
N’=
( )
RQD
( )
J
nJ
rJ
axAxBxC
(1)Here, N' is the Stability Number, A refers to the rock stress factor, B accounts for the joint orientation adjustment and C represents the gravity adjustment.
The hydraulic radius (H.R.) is largely used for several engineering purposes (Pot-vin, 1988). In this instance, it is deined mathematically by the ratio between stope surface area and stope surface perimeter.
A database comprising 175 case studies from 34 mines were used in the Potvin (1988) proposition. One of the
differences between his methodology and Mathews original proposal is the absence of Jw factor. This absence was not clearly explained by Potvin. One could guess that the water pressure is already taking care of in numerical modelling to obtain induced stresses. The factors A,B and C have the same meaning as for Mathews et al. (1981) but attain new values due to the use of a larger database.
Mathews et al (1981) propose the maximum of 10% of operational dilution
for considering an open stope as stable. Meanwhile Potvin (1988) proposes 5%. This difference stresses the necessity of a judicious choice of which methodologies to be used. Operating dilution estimations are discussed by Oliveira et al. (2012).
Potvin’s methodology was chosen since the larger database used by the au-thor allowed the best adjustments to the original site conditions. Suorimeni (2010) discusses the possibility of a unique Stabil-ity Graph comprising all studies reported.
2. Materials and methods
3. Results
Rock mass classification
Mathews et al. (1981) and
Pot-vin (1988) methodologies have been efficiently applied on Australian and Canadian mines.
The use of Potvin’s (1988) meth-odology in Brazilian mines requires on site data collection and, possibly, a new Stability Graph to be compare to the proposed ones.
The data collected can be summa-rized as:
• Stope dimensions and geologi -cal ambient.
• Estimated in-situ and induced
stress ields.
• Rock mass classification in
stope area.
• Relative position of joint and
stope surfaces.
• Rock mass strength. • Mined stopes dilution.
• Use of support to verify stability
with or without these systems.
The data used in this study was not obtained with the main purpose of the Stability Graph analyses. Thus, some
re-sults might have been tainted by the data gathering process. Structural mapping and geomechanic classiication for each particular stope site should be considered, both, before and after excavation. That would allow more accurate quantiication of blasting effects.
Two Sublevel Stoping mines were used to gather the database. Seventeen stopes provided the data of the topo-graphic surface - laser scanning, critical joints orientations, in-situ stress ield and NGI-Q rock mass classiication.
The dilution was estimated by discretizing solids (planned and realized stopes) in a mine planning software. A Boolean operation allowed obtaining the dilution of each stope and for each stope surface. The same software was used to access the surfaces areas and hydraulic radius.
Potvin’s (1988) A factor is deined by the ratio of the uniaxial compressive strength and the highest total stress at the stope surface. The uniaxial compres-sive strength was provided by the mines,
via internal report. The induced stresses were estimated using numerical modelling (Rocscience Phases 2 5.0 and Examine 3d Free Trial).
The orientation of the critical dis-continuity relative to the stope surfaces is used to obtain Potvin’s (1988) B factor. All stopes and structures were georefer-enced so that their orientation could be estimated by by simple geometry. In this research, the rocscience dips 5.1 was used to access this information.
The average dipping angle of each stope surface was used to ind the C fac-tor. Field and data observations show that gravity contributes only to free rock falls. There are no sliding blocks at the analyzed stopes.
The obtained results were plotted on a graph where the x axis is deined by the hydraulic radius and the y axis by the stability number. Potvin’s (1988) stability limits were presented in graphs. There-fore, after the analysis, each surface was identiied as stable, potentially unstable or caving.
All the analyzed stopes would fall into one of three different geomechani-cal domains. Table I shows all rock mass
classiication parameters for each domain. The mines provided all information in this table. Q’, the modiied rock mass
classiication, is obtain as the Barton’s Q classiication, not taking into account the Jw and SRF coeficients.
Table I
Provided values for
rock mass classification parameters.
Rock Mass Classification
Domain 1 Domain 2 Domain 3
RQD 80.00 70.00 90.00
Jn 15.00 9.00 9.00
Já 1.00 1.50 1.50
Jr 6.00 2.00 1.00
415
A
Factor determination
B
Factor determination
C
Factor determination
The rock strength (U.C.S) of each
domain was estimated by uniaxial compressive strength tests carried out
by the mines, according to the Inter-national Society of Rock Mechanics (ISRM) suggestions.
Table I I pre s e nt s t he aver -a ge v-a lu e s -a nd t he nu mb er s of test accomplished.
Uniaxial Compressive Strength U.C.S
U.C.S (MPa) Number of Tests Domain 1 175.5 13 Domain 2 118.0 9
Domain 3 98.8 5
Table II Uniaxial Compressive Strength by domain.
All the stopes, located less than 400 meters deep, were numerically modelled in Phases 2 and Examine 3d. The 3d modelling was used to estimate the ield stress at the stope end and stope begin-ning and where there were interactions
with other excavations. The supported stopes were modelled through a two dimensional analysis. The 3d analysis helped the interpretation of the two dimensional results.
The shallow depth combined with
the high rock resistance (+98 MPa)
deemed the ratio of U.C.S to induced
stress never smaller than 2 and, conse-quently, the A Factor equals 1.
As an example, Table III shows the A factor for all surfaces of Stope 1.
Stope Surface A Factor
Stope 1
Roof 1
Stope Beginning 1 Stope End 1 Hangingwall 1 Footwall 1
Table III Factor A of all surfaces on Stope 1.
Table IV Critical Joints Attitudes.
Critical Joint Attitudes by Domain
Dip Direction Dip
Domain 1 141 64
Domain 1 313 54
Domain 2 245 45
Domain 3 238 43
Table I V presents the consid-ered critical joints attitude in all three domains.
This information was provided by the mines. It is relevant to notice that these joints are critical only to the roofs
and hangingwalls.
It is supported by observations of local mining engineers.
Two joints were initially considered in the irst domain. The angular position was then calculated for both and the one that more signiicantly inluenced the instability was chosen to estimate
the B factor.
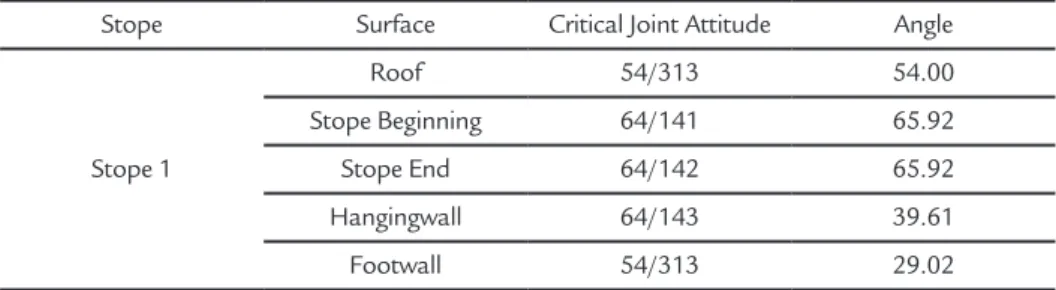
Table V shows the spatial orientation of the Stope 1 surfaces. All analyzed roofs were horizontal and in Domain 1, render-ing the same B factor. The same happened
with the stope end and stope beginning surfaces. Both are vertical and included in Domain 1. All footwalls came up with the B factor equals to 1, probably due to a structural mapping bias.
Stope Surface Critical Joint Attitude Angle
Stope 1
Roof 54/313 54.00 Stope Beginning 64/141 65.92 Stope End 64/142 65.92 Hangingwall 64/143 39.61 Footwall 54/313 29.02
Table V B factor for all surfaces of Stope 1.
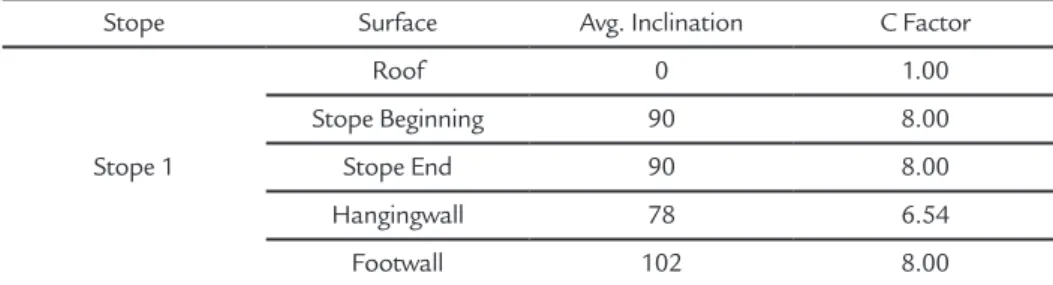
Only rock falls were considered as the gravity contribution on instability. Due to the stopes complex geometry, their
transversal sections vary considerably. As a solution for this problem, a segment line was constructed from the roof to the loor
seg-ment angles in all transversal sections. Here the roof and loor were considered
horizontal again.
The average inclinations of stope
surfaces and calculated C factors are pre-sented in Table VI.
Stope Surface Avg. Inclination C Factor
Stope 1
Roof 0 1.00
Stope Beginning 90 8.00 Stope End 90 8.00 Hangingwall 78 6.54
Footwall 102 8.00 Table VI
Calculated Factors C for Stope 1.
Determining the Potvin (1988) N’ Stability Number
Hydraulic radius determination
The Stability Graph
Dilution determination
The stability number proposed by Potvin (1988) is obtained by multiplying the modiied rock mass classiication Q’ (Table
I) and the factors A, B and C discussed earlier. (Equation 2). Table VII presents the stability number reckoned for Stope 1.
Stope Surface N' Potvin
Stope 1
Roof 0.88 Stope Beginning 3.18 Stope End 3.18 Hangingwall 2.57 Footwall 7.04
Table VII
Potvin(1988) stability number for all stope surfaces of stope 1.
Dilution calculation using block models presented satisfactory results (further discussion in Oliveira et al. (2012)). The hangingwalls, on most
of the stopes, were responsible for the higher dilutions.
Nevertheless the dilutions in some footwalls reached up to 16.92%.
Two stopes presented footwall dilutions higher than on hangingwalls.
I t m i g h t b e du e t o b i a s e d footwall analysis.
The hydraulic radius was calcu-lated using the proposed formulation.
A similar hydraulic radius was
estimated for all the roofs .
T h e s a m e c i r c u m s t a n c -es were observed for all footwalls
and hangingwalls.
This can be explained by the simi-larity of the form of such surfaces.
Seventeen stopes of two different mines, 10 from the irst and 7 from the second, were used in this study.
The variables of interest for a total of 65 surfaces (hangingwall, footwall, roof, stope end, stope beginning) were
either measured or estimated; namely: hydraulic radius, stability number and dilution.
Figure 1 shows the Stability Graph with the limits deined by Potvin (1988). Potvin and Hagjigeorgiou (2001)
clas-siied these limits as: stable surface for dilutions lower than 5%, potentially unstable for dilution ranging from 5% to 10% and caving when the dilution reaches values higher than 10%.
Figure 1
Stability Graph with Limits proposed by Potvin (1988)
0,1 1 10 100 1000
0 5 10 15 20 25 30
Hydraulic Radius (m)
Stability Graph with limits proposed by Potvin (1988)
Stable Caving Potentially Unstable
S
ta
b
il
it
y
N
u
m
b
er
- P
o
tv
417
It can be seen in the graph depicted in Figure 1 that most of the points representing the surfaces analyzed do not agree with the limits proposed by Potvin (1988).
Also, observe that there is a dis-tinct group of surfaces considered stable, some proximity of the points that represent unstable surfaces and a greater dispersion of the surfaces considered potentially unstable.
Other aspects of the graph should be highlighted:
1) All footwalls, stope ends and stope beginnings might show inaccura-cies in determining the number of stabil-ity due to simpliications on modelling these surfaces,
2) the small number of points or surfaces analyzed (65) did not allow a wider distribution of the points on the graph,
3) the shallow depth (400 meters at most) of the observed stopes resulted in an equality of the A factor for all the excavations surfaces, and
4) the use of support on some sur-faces might have enhanced the stability of such excavations.
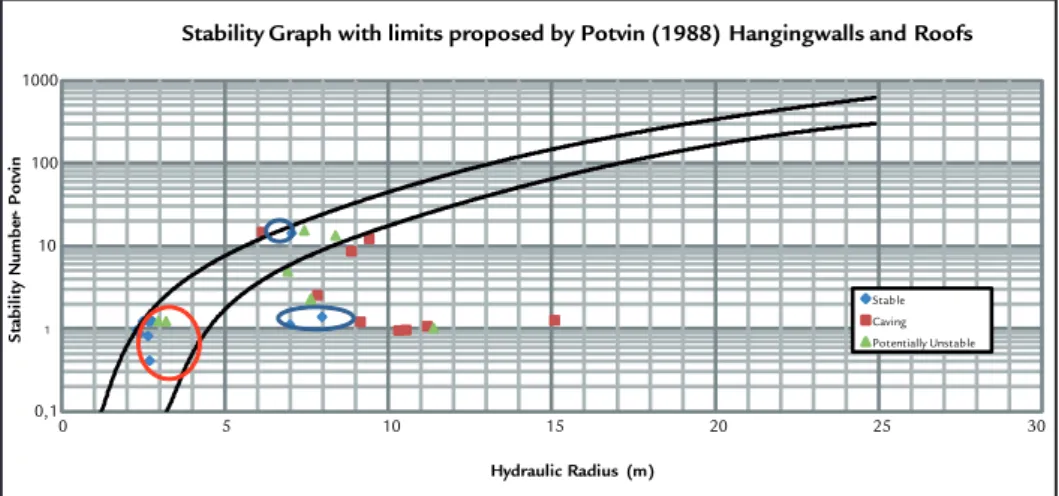
To investigate the bias associated to these results, a new graph was plotted containing only hangingwalls and roofs. This graph can be seen on Figure 2.
Figure 2 Stability Graph with Limits proposed by Potvin (1988), just hangingwalls and roofs considered.
Supports were used in all roofs analyzed, circled in red in the graph of Figure 2. The low dilution responsible for their classiication as stable surfaces was probably inluenced by the use of these supports.
Observing only the hangingwalls points, all those considered stable, circled in blue, (dilution <5% for Potvin and Hagjigeorgiou (2001)) are not in the stabil-ity zone proposed by researchers.
A greater number of surfaces would be necessary to allow a more objective statistical analysis. Meanwhile, another graph based on probabilistic analysis
proposed by Mawdesley et al. (2001)
was devised and presented in Figure 3, even though it was originally proposed to be based on Mathews et. al. (1981)’s considerations.
Again only hangingwalls and roofs were considered.
According to his original chart, in the area above the superior line, there would be found 83% of stable surfaces and 17% potentially unstable
surfaces. Under the inferior line, 60%
of the surfaces were stable, 27% poten-tially unstable and only 13% resulted in caving.
The data collect at the two mines do not agree with the limits proposed by Mawdesley et al. (2001).
Figure 3 Extended Stability Graph considering only hangingwall and roofs.
A further analysis was accomplished using Mawdesley et al. (2001) charts
con-sidering isoprobability lines of stability. The graph can be seen in Figure 4.
0,1
1
10 100 1000
0 5 10 15 20 25 30
Hydraulic Radius (m)
Stability Graph with limits proposed by Potvin (1988) Hangingwalls and Roofs
Stable Caving Potentially Unstable
S
ta
b
il
it
y
N
u
m
b
er
- P
o
tv
in
0,1 1 10 100 1000
1 10 100
S
ta
b
il
it
y
N
u
m
b
er
Hydraulic Radius (m)
Extend Stability Graph with Limits proposed by Mawdesley et al.(2001) Hangingwalls and
Roofs
Figure 4
Extend Stability Graph
with isoprobability lines of stability, considering hangingwalls and roofs alone.
It can be noticed that, disregarding the roofs, only one point disagrees with the isoprobability lines proposed. This surface shows a dilution of 5.74%, con-siderably close to the stable limit proposed by Potvin (1988). The Mawdesley et al.
(2001) iso-probability instability limits also show a good concordance with the cases analyzed.
The limited data bearing just on clear inconsistent results might not be taken as a solid indication that the this
procedure could be used by the mines studied, neither would it be possible to propose other limits of (in)stability. Nev-ertheless, it suggests that new cases should be analyzed in the construction of a more robust database.
4. Conclusions
A general geomechanics classiica-tion of a mine site could induce to errors in the empirical model interpretation. It seems that footwalls have been ignored in analysis to deine critical discontinui-ties used to estimate the Factor B. There were instances where the footwall pre-sented higher operational dilutions, but conservative B Factor values.
The chances of slipping and/or fall-ing blocks must be analyzed accurately for each stope face. Analyses of the C Factor for footwalls, stope beginnings and stope ends has proven to be
inef-icient. It could be related to the wide-spread assumption at the mines that, in all surfaces, the gravity falling blocks was the unique failure mechanism to be considered. That resulted in the deini-tion of a single value for the C Factor for all surfaces analyzed.
The number of case studies directly inluences the quality of the result of an empirical model. In this paper, the number was not suficient to propose modiications to the limits of stability proposed by Potvin (1988). The fact that only two companies contributed to the
study also showed a trend of stability enhancements open to Brazilian mines.
The extended stability graph pro-posed by Mawdesley et al. (2001) reveals the highest number of cases studied. Even though, it is based on Mathews et. al (1981)’s suggestion, it presented a better correlation between the isoprobability lines and the hangingwall and roof data. A single point (hangingwall) showed disagreement with the authors' proposal, indicating a situation of stability below the line that represents the probability of 0% stable surfaces.
5. Bibliographic references
BARTON, N., LIEN, R., LUNDE, J.. Engineering classiication of rock masses for
the design of tunnel support. Rock Mechanics. v.6, n.4, p. 189-236, 1974.
KAISER, P.K., MACKAY, C., GALE, A.D.. Evaluation of rock classiications at B.C.
Rail Tumbler Ridge Tunnels. Rock Mechanics and Rock Engineering. New York,
v.19 p. 205-234, 1986.
MATHEWS, K. E., HOEK, E., WYLIE, D.C., STEWART, S.B.V. 1981. Prediction of stable excavation spans for mining at depths below 1,000 m in hard rock mines.
Canmet Report DSS Serial No. OSQ80-00081, 1981.
MAWDESLEY, C., TRUEMAN, R., WHITEN, W.. Extending the Mathews sta -bility graph for open- stope design, Trans. IMM (Sect. A: Min. industry), n.110 A27-39, 2001.
OLIVEIRA, M.M., PINTO, C.L.L., DUTRA, J.I.G., DIAS, P.M..Utilização de mo
-delo de blocos para o cálculo do overbreak (diluição operacional) e determinação da estabilidade das superfícies do realce para calibração do método do Gráico de Estabilidade, CONGRESSO DE MINA SUBTERRÂNEA, n.7 BELO HORI -ZONTE, 2012.
PAKALNIS, R.C. Empirical stope design at Ruttan Mine, Vancouver, Canada: Uni
-0,1 1 10 100 1000 10000
1 10 100
S
ta
b
il
it
y
N
u
m
b
er
Hydraulic Radius (m)
Extended Stability Graph with Isoprobably Lines of Stabilitily Proposes by Mawdesley
et al. (2001) Hangingwalls and Roofs
Stable Caving Potentially Unstable
419
versity of British Columbia Department of Mining and Minerals Processing, 1986.
POTVIN, Y. 1988. Empirical open stope design in Canada. The University of British
Columbia, 1998. p.350. (Ph.D. Thesis).
SUORINEMI, F.T. 2010. The stability graph after three decades in use: Experiences
and the way forward. International Journal of Mining, Reclamation and Environ-ment, v. 24, n. 4, p. 307–339, 2010.