Recebido para publicação em 28/8/2008 Aceito para publicação em 8/7/2009 (003825)
1 Centro de P & D de Frutas e Hortaliças, Instituto de Tecnologia de Alimentos, CEP 13070-178, Campinas - SP, Brasil, E-mail: sgermer@ital.sp.gov.br 2 Departamento FRUTHOTEC, Instituto de Tecnologia de Alimentos, CEP 13070-178, Campinas - SP, Brasil
3 Departamento GEPC, Instituto de Tecnologia de Alimentos, CEP 13073-001, Campinas - SP, Brasil
4 Faculdade de Engenharia Agrícola, Universidade Estadual de Campinas – UNICAMP, CEP 13083-875, Campinas - SP, Brasil *A quem a correspondência deve ser enviada
Process variables in the osmotic dehydration of sliced peaches
Variáveis de processo na desidratação osmótica de pêssegos em fatias
Sílvia Pimentel Marconi GERMER1*, Marlene Rita QUEIROZ4, José Maurício AGUIRRE2,
Shirley Aparecida Garcia BERBARI2, Valéria Delgado ANJOS3
1 Introduction
The State of São Paulo is the second largest peach producer in Brazil, and the drying is a possible alternative to overproduced peaches. Applying Osmotic Dehydration (OD) as a preliminary stage in the fruit dehydration process followed by hot-air drying is an option which generally results in a product with greater quality compared to those obtained using conventional processes.
The osmotic dehydration process involves the partial removal of water from a given food using a hypertonic solution consisting of one or more solutes (PONTING et al., 1966). The difference in osmotic pressure obtained from the system leads to a flow of water from the food to the solution and an opposite flow of solutes from the syrup to the product, although
in smaller proportions. Furthermore, a third flow of solids may take place from the food to the solution, which, although on a much smaller scale, may lead to a meaningful loss of product quality (RAOULT-WACK, 1994).
The application of osmotic dehydration as a preliminary process before hot-air drying in the production of dried peaches was recently reported by the following authors: Germer et al. (2004, 2007), Mota (2005), Sahari, Souti and Emam-Jomeh (2006). Many aspects were discussed in these studies and, in general terms, the results showed excellent sensory performances and good drying yields indicating the technical feasibility of the process.
Resumo
Este trabalho investigou a influência da temperatura e da concentração do xarope de sacarose na pré-secagem osmótica de pêssegos. Investigaram-se as variações físicas (cor e textura) e químicas (teores de sólidos solúveis; teores de açúcares totais, redutores, e não redutores; acidez titulável), assim como parâmetros da desidratação osmótica (perda de peso e de água; incorporação de sólidos). Empregou-se o delineamento central composto rotacional variando-se a temperatura (30 a 50 °C) e a concentração (45 a 65 °Brix), fixando-se a razão mássica xarope:fruta (4:1), tempo de processo (4 horas), e o formato (fatias). Na análise sensorial, empregou-se o método de aceitação, avaliando-se os atributos aparência, sabor, textura, cor e qualidade geral através de escala hedônica. Modelaram-se os resultados com o programa Statistica (v. 6.0), empregando-se a Metodologia de Superfície de Resposta. Os seguintes modelos matemáticos das variações adimensionais resultaram significativos (p < 0,05) e preditivos: teores de sólidos solúveis, teores de açúcares totais e não redutores, acidez titulável, parâmetro L* e parâmetro perda de água. Os modelos dos atributos cor e aparência resultaram significativos (p < 0,10), mas não preditivos. A temperatura é o efeito preponderante nos modelos. As condições de processo de 50 a 54,1 °C e 45 a 65 °Brix implicam maiores perdas de água e melhores desempenhos sensoriais.
Palavras-chave: Prunus persica (L.) Batsch; secagem; análise sensorial; metodologia de superfície de resposta.
Abstract
This paper evaluated the influence of temperature and concentration of the sucrose syrup on the pre-osmotic dehydration of peaches. Physical (colour and texture) and chemical variables (soluble solid content; total sugar, reducing and non-reducing sugar contents; and titratable acidity) were investigated, as well as the osmotic dehydration parameters (loss of weight and water; solids incorporation). An experimental central composite design was employed varying the temperature (from 30 to 50 °C) and concentration (from 45 to 65 °Brix) and maintaining the syrup to fruit ratio (4:1), process time (4 hours), and format (slices). The degree of acceptance was used in the sensory analysis evaluating the following characteristics: appearance, taste, texture, colour, and overallquality using a hedonic scale. The results were modelled using the Statistica program (v. 6.0) and the Response Surface Methodology. The mathematical models of the following dimensionless variations yielded significant (p < 0.05) and predictive results: soluble solids content, total and non-reducing sugar contents, titratable acidity, colour parameter L*, and water loss. The models of the attributes colour and appearance yielded significant (p < 0.10) but not predictive results. Temperature was the prevalent effect in the models. The process conditions in the range from 50 to 54.1 °C and from 45 to 65 °Brix led to greater water losses and better sensory performances.
Keywords: Prunus persica (L.) Batsch; drying; sensory analysis; response surface methodology.
2.1 Experimental tests
The fruits were selected, washed, peeled, stoned, and manually cut into six regular slices. The fruits were chemically blanched using citric acid (4 g.100 g–1) and ascorbic acid
(1 g.100 g–1) mixed solutions for 40 seconds. Osmotic
dehydration was carried out in two identical baths, each with a capacity for 30 L and supplied with 10 L/minute agitation (Immersion Circulation, Model 1266-02, USA) using the conditions established by the experimental design (Table 1). The syrup to fruit mass ratio was 4:1 (about 18.400 g mass of syrup and 4,600 g mass of fruit), and the process time was four hours. At the end of osmotic dehydration, the fruit pieces were removed from the bath, drained, rinsed, and lightly dried with paper towels. The raw and pre-dried fruits were weighed using a mechanical scale (Mettler, P10N, Germany).
The parameters Water Loss (WL), Mass Loss (ML) and Solids Incorporation (SI) resulting from the osmotic dehydration process were calculated from the following Equations 1, 2, 3:
( ) 100 UiMi UtMt WL Mi −
= × (g of water.100 g–1 of initial mass) (1)
( ) 100 Mi Mt ML Mi −
= × (g.100 g–1 of initial mass) (2)
100 STtMt STiMi SI
Mi
−
= × (g of solute.100 g–1 of initial mass) (3)
Where: Ui = Initial moisture content; Mi = initial mass; Ut = Moisture content at time t; Mt = mass at time t; STt = total solid content at time t; Sti = initial solids content;
After the OD process, the rinsed slices were placed in trays for supplementary drying, carried out in a cabinet tray dryer with air circulation at a speed of 1.5 m/second and temperature of 65 °C. The weights of the trays were controlled until the samples reached moisture content within the range from 20 to 22% (wet basis). The drying time was approximately five hours. The dried peaches were packed into 0.15 mm-thick polyethylene bags and stored for subsequent use. After approximately 15 days, a sufficient period for moisture equilibrium, the sensory tests were carried out.
Germer et al. (2007) assessed the performance obtained from the use of peach cultivars commercially produced in São Paulo (Régis, Diamante, Aurora-1 and Douradão) for the production of dried fruits using a combination of pre-osmotic dehydration (65 °Brix, 45 °C) and hot-air drying (65 °C). They concluded that the cultivars Aurora-1 and Régis presented the best characteristics showing sensory acceptation of 81.3% in relation to the overall preference and process yields of 14.5 and 15.4%, respectively. Considering the dehydration curves obtained, the same study concluded that the optimum osmotic dehydration time was four hours, resulting in water removal of about 50%.
The performance of osmotic dehydration has been widely investigated and the literature presents extensive results for both fruits and vegetables, amongst other products. According to the findings, the mass transfer and final OD product quality depend on several factors, such as: tissue properties (SAUREL et al., 1994; RAOULT-WACK, 1994; KOWALSKA; LENART, 2001); ripeness level in the case of fruits (CHIRALT; FITO, 2003); process temperature (BERISTAIN et al., 1990; HENG; GUILBERT; CUQ, 1990); type of solute employed (HENG; GUILBERT; CUQ, 1990; VIAL; GUILBERT; CUQ, 1991); syrup concentration (HENG; GUILBERT; CUQ, 1990; PARK et al., 2002, FERNANDES et al., 2006); format and dimension of the fruit pieces (LERICI et al., 1985; PANAGIOTOU; KARATHANOS; MAROULIS, 1998); process time (VIDEV et al., 1990; ARAUJO, 2005) and syrup:fruit mass ratio (LERICI et al., 1985). A few studies also reported on the influence of solution agitation (AZUARA; GARCIA; BERISTAIN, 1996; SAHARI; SOUTI; EMAM-JOMEH, 2006) and the application of vacuum (SHI; FITO; CHIRALT, 1995).
Therefore, as a follow-up to previous peach OD studies using sucrose syrup, this paper aimed to study the influence of syrup temperature and concentration on the variation in the following aspects: physical and chemical properties of the fruit, osmotic dehydration parameters, and sensory performance. As indicated by previous results, the cultivar chosen for analysis was Aurora-1, and the process time remained unchanged (4 hours). 4:1 syrup to fruit mass ratio was used for being more practical on an industrial scale. This paper presents the results obtained from the tests carried out with the format of the slice.
2 Materials and methods
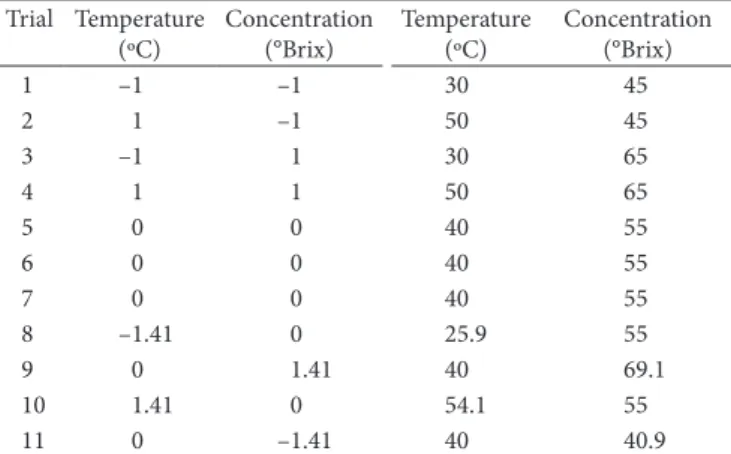
The research was conducted using peaches from the Holambra Agroindustrial Cooperative in Paranapanema, State of São Paulo, Brazil. They were harvested at the optimum commercial maturity, as determined by changes in skin background colour from green to yellow, and their diameters ranged from 56 to 61 mm. The peaches were maintained at 2 °C and 80-90% relative humidity, and the fruits were periodically processed. A central rotational composite design was employed with Response Surface Methodology (RSM), as described by Barros Neto, Scarmino and Bruns (1995). The factors investigated were temperature (30 to 50 °C) and syrup concentration (45 to 65 °Brix). The design comprised eight tests and three repetitions at the central point, as shown in Table 1.
Table 1. Encoded and decoded levels of the variables used in the osmotic dehydration trials carried out with sliced peaches.
Trial Temperature (ºC) Concentration (°Brix) Temperature (ºC) Concentration (°Brix)
1 –1 –1 30 45
2 1 –1 50 45
3 –1 1 30 65
4 1 1 50 65
5 0 0 40 55
6 0 0 40 55
7 0 0 40 55
8 –1.41 0 25.9 55
9 0 1.41 40 69.1
10 1.41 0 54.1 55
3 Results and discussion
Tables 2, 3, and 4 show the experimental results obtained. Table 5 presents the results of the multiple regression analyses for the valid RS according to the previously presented criteria. As seen in Table 5, the RS fits for the dimensionless values obtained for SS, TA, TSC, NRSC, and L* as a function of the process temperature and syrup concentration showed fairly good significance at the level of (p < 0.05), and all these models obtained were considered predictive. On the other hand, the response surfaces for the following dimensionless parameters were not considered valid: reducing sugar content; a* and b* colour parameters; and maximum cutting force. The RS analysis of the WL parameter as a function of the same variables resulted in a highly significant model, which was also considered predictive. Nonetheless, the model for the parameter ML, although significant, showed a significant lack of fit, and the model for the parameter SI was not significant. The multiple regression analysis of the RS resulted in statistically non-significant models for all the attributes of the sensory analysis at the 5% significance level (p < 0.05). However, since these were subjective determinations subject to greater deviations, the regressions were analyzed at a significance level of 10%. In this case, the regressions of the means for the attributes of appearance and colour were significant although the models were not predictive. Nevertheless, these surfaces can be employed to analyze the tendency for the sensory variation of the product (dried peach) as a function of the variables studied.
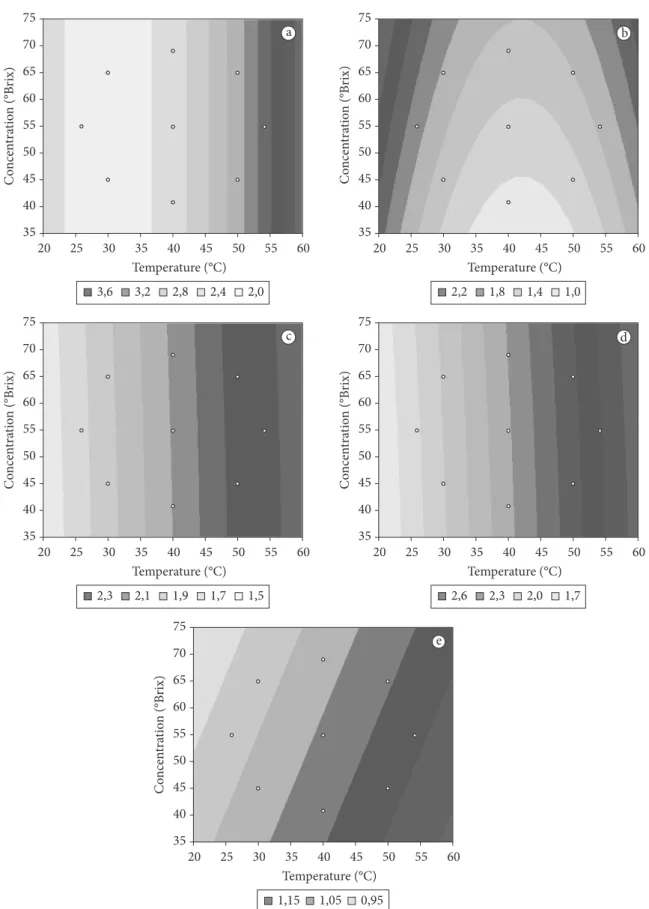
Figure 1 presents the contour curves for the response surfaces of the dimensionless variations in SS, TA, TSC, NRSC, and L*. Figure 2 presents the contour curve for the response surface of variation in the parameter WL. Figure 3 presents the contour curves for the response surfaces of the mean scores obtained for the sensory attributes of appearance and colour.
Firstly, it is important to stress the fact that the dimensionless values employed in the analysis indicate the positive or negative variations in both physical and chemical properties of the process. In such operations, in which dehydration is at issue, i.e., an operation in which water is removed, an increase in the value of the quantitative parameters is to be expected. Meanwhile, for osmotic dehydration, the variations can be negative due to losses of soluble solids from the fruit.
It can be seen that the TSCadm model, represented by Equation4, presented an average value of 2.04 (linear coefficient), signifying that, in the T=0 and C=0 condition, the content of total sugars was doubled. On the other hand, the average value for the NRSCadm model was 2.24 according to Equation 5, i.e., under the same conditions the content more than doubled Therefore, under this OD condition, the increase in the content of non-reducing sugars was higher than that of total sugars leading to the conclusion that the reducing sugar content decreased during the process. This hypothesis is in agreement with the experimental and dimensionless RSC values presented in Table 2, which increased relatively less and, in some tests, actually decreased. With respect to the SSadm model, according to Equation 6, the average equalled 2.10, which is considerably higher than the value determined for total sugars (4). This difference occurred due to the presence of other soluble solids in the fruit apart from the sugars, such as pigments,
2.2 Physical and chemical analyses
The following analyses were carried out on the raw materials and on the fruit after OD (osmotically pre-dried product): moisture content; soluble solids content; titratable acidity; reducing, non-reducing, and total sugar contents. The instrumental colour and texture were also analyzed in the raw materials and in the final product (dry product), simultaneously with the sensory analyses.
The moisture content was determined in a vacuum oven at 70 °C up at constant weight according to Carvalho et al. (1990). The Titratable Acidity (TA) was determined using an acidimetric method following the methodology described by Carvalho et al. (1990). The Soluble Solids (SS) were determined by refractometry using the AO Abbe Refractometer (Model 10450, USA). The Total Sugar Content (TSC), Reducing Sugar Content (RSC), and Non-Reducing Sugar Content (NRSC) were determined by the Munson and Walker method as described by Carvalho et al. (1990). The chemical analyses were performed in triplicate. The texture, expressed as the maximum cutting force (Fmax), was determined using a texturemeter TAXT2i (Stable Micro Systems, England) equipped with the “blade set with knife” probe (pre-test speed of 5 mm/seconds, test speed of 1 mm/second, Maximum Force of 25 kg). The colour was determined by the the CIElab system using a Minolta CR300 colorimeter (Minolta, Japan) making a direct reading of the sample using the configuration d/0, illuminant D65 obtaining the values for L* (luminosity), a* (green-red), and b* (yellow-blue).
2.3 Sensory analyses
A team of 30 judges, all dried fruit consumers, evaluated the final product (dry product) acceptability using a 9 point hedonic scale where: 9 = “I liked it very much” and 1 = “I disliked it very much”. Appearance, taste, texture, colour, and overall quality were evaluated, and the results analyzed by the analysis of variance (Anova), F Test and Tukey Test using the SAS program (SAS, Inst Inc.).
2.4 Multiple regression analyses
The mean values obtained for the dehydration parameters and the sensory attributes were treated by multiple regression analysis to obtain the Response Surfaces (RS) using the Statistica Program version 6.0 (Statsoft, Inc.). In order to minimize the raw material variability, in terms of physical and chemical properties, the response surfaces were fitted using dimensionless values (Padm = average product property/average raw material property). Statistically significant regressions were observed in the variance analysis (Anova) using the F test in the 95% interval of confidence, and the regression determination coefficient (R2)
when the non-significance of the lack of fit was evident. The non-significant terms considering the regressions with R2 above
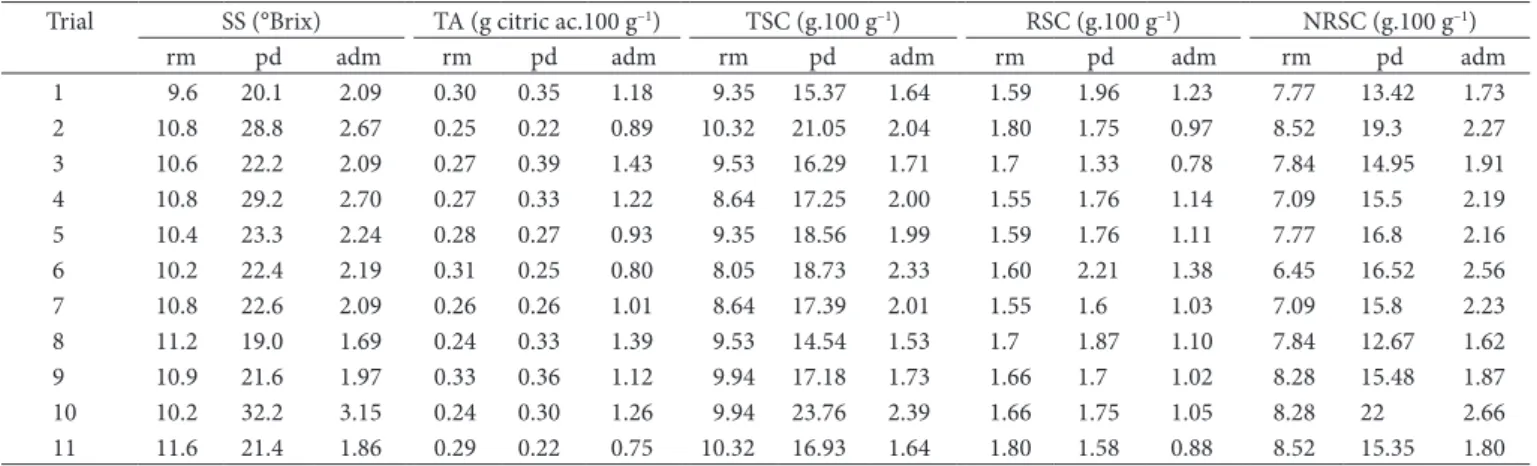
Table 2. Experimental and dimensionless values for the chemical properties of the raw material and products in the respective osmotic dehydration trials carried out with sliced peaches.
Trial SS (°Brix) TA (g citric ac.100 g–1) TSC (g.100 g–1) RSC (g.100 g–1) NRSC (g.100 g–1)
rm pd adm rm pd adm rm pd adm rm pd adm rm pd adm
1 9.6 20.1 2.09 0.30 0.35 1.18 9.35 15.37 1.64 1.59 1.96 1.23 7.77 13.42 1.73
2 10.8 28.8 2.67 0.25 0.22 0.89 10.32 21.05 2.04 1.80 1.75 0.97 8.52 19.3 2.27
3 10.6 22.2 2.09 0.27 0.39 1.43 9.53 16.29 1.71 1.7 1.33 0.78 7.84 14.95 1.91
4 10.8 29.2 2.70 0.27 0.33 1.22 8.64 17.25 2.00 1.55 1.76 1.14 7.09 15.5 2.19
5 10.4 23.3 2.24 0.28 0.27 0.93 9.35 18.56 1.99 1.59 1.76 1.11 7.77 16.8 2.16
6 10.2 22.4 2.19 0.31 0.25 0.80 8.05 18.73 2.33 1.60 2.21 1.38 6.45 16.52 2.56
7 10.8 22.6 2.09 0.26 0.26 1.01 8.64 17.39 2.01 1.55 1.6 1.03 7.09 15.8 2.23
8 11.2 19.0 1.69 0.24 0.33 1.39 9.53 14.54 1.53 1.7 1.87 1.10 7.84 12.67 1.62
9 10.9 21.6 1.97 0.33 0.36 1.12 9.94 17.18 1.73 1.66 1.7 1.02 8.28 15.48 1.87
10 10.2 32.2 3.15 0.24 0.30 1.26 9.94 23.76 2.39 1.66 1.75 1.05 8.28 22 2.66
11 11.6 21.4 1.86 0.29 0.22 0.75 10.32 16.93 1.64 1.80 1.58 0.88 8.52 15.35 1.80
rm = raw material; pd = pre-dried product; adm = (pre-dried or dried product property/raw material property).
Table 3. Osmotic dehydration parameters and experimental and dimensionless values for the physical properties of the raw material and products in the respective osmotic dehydration trials carried out with sliced peaches.
Test L* a* b* Fmax (N) WL ML SI
rm d adm rm d adm rm d adm rm d adm (g.100 g–1 initial mass)
1 72.2 68.4 0.9 1.6 8.7 5.4 37.3 46.2 1.2 7.1 30.9 4.3 26.2 24.1 2.2
2 69.6 74.8 1.1 6.0 8.3 1.4 35.4 39.4 1.1 8.5 40.7 4.8 39.0 34.5 4.5
3 71.3 66.9 0.9 3.3 8.4 2.5 38.5 40.4 1.1 9.2 45.3 4.9 36.7 34.2 2.5
4 69.1 73.4 1.1 4.5 7.3 1.6 37.7 42.3 1.1 6.7 41.1 6.1 42.5 35.0 7.5
5 69.3 70.0 1.0 4.6 10.6 2.3 37.2 42.6 1.1 6.6 35.9 5.4 37.6 34.5 3.1
6 70.4 71.2 1.0 3.7 10.0 2.7 37.0 37.3 1.0 7.2 42.1 5.8 38.6 35.0 3.6
7 68.6 71.6 1.0 4.3 8.1 1.9 40.5 42.9 1.1 6.5 32.1 4.9 37.5 33.9 3.6
8 70.6 66.2 0.9 3.1 9.9 3.2 37.0 41.8 1.1 9.1 37.3 4.1 28.8 26.5 2.3
9 69.1 64.9 0.9 3.7 9.5 2.5 39.8 39.8 1.0 7.4 34.2 4.6 39.1 37.2 1.9
10 69.8 75.7 1.1 4.5 6.1 1.4 42.4 44.5 1.0 5.9 36.1 6.1 50.2 45.2 5.0
11 69.6 72.0 1.0 4.3 9.7 2.3 37.3 41.9 1.1 7.9 35.5 4.5 29.9 25.1 4.8
rm = raw material; d = dried product; adm = (pre-dried or dried product property/raw material property).
Table 4. Mean scores obtained in the sensory analysis of the final products obtained in the osmotic dehydration trials carried out with sliced peaches.
Atribute Trial
1 2 3 4 5 6 7 8 9 10 11
Appearance 6.42b 7.17a,b 6.00b,c 7.13a,b 7.17a,b 6.54b 7.00a,b 6.25b,c 5.08c 7.75a 7.17a,b
Colour 6.5a,b,c 7.46a 6.25b,c 7.17a,b 7.33a,b 6.54a,b,c 7.08a,b 5.83c 5.42c 7.42a 7.04a,b
Taste 6.67a,b 7.25a,b 7.13a,b 7.58a 7.17a,b 7.04a,b 7.29a,b 7.00a,b 6.29b 7.17a,b 7.04a,b
Texture 6.29a 7.08a 6.63a 7.29a 6.88a 6.21a 6.58a 6.88a 6.17a 7.25a 6.96a
Overall quality 6.71a,b 7.17a 6.63a,b 7.5a 7.13a 6.71a,b 7.00a,b 7.08a 6.00b 7.33a 7.29a
Means followed by the same letters in the same line (comparison between samples) showed no significant difference at the 5% error level in the Anova analysis.
Table 5. Results obtained in the multiple regression analysis of the dimensionless variations (physical/chemical properties), sensory attributes of appearanceand colour, and the parameter WL.
Property parameter R2 F
c Ftab Fc/Ftab Response surface equation Number
TSCadm 0.82 18.53 4.46* 4.15 TSCadm = 2.04 + 0.24T - 0.19c2 (4)
NRSCadm 0.82 23.83 4.46* 5.34 NRSCadm = 2.24 + 0.29T - 0.21c2 (5)
SSadm 0.86 25.05 4.46* 5.62 SSadm = 2.10 + 0.41T + 0.20T2 (6)
TAadm 0.92 25.39 4.35* 5.84 TAadm = 0.93 - 0.09T + 0.21T2 + 0.14C (7)
L*adm 0.88 28.65 4.46* 6.42 L*adm = 1.01 + 0.06T - 0.02C (8)
WL 0.97 42.45 4.53* 9.30 WL = 38.56 + 6.36T + 3.62C - 1.99C2 - 1.24TC (9)
Colour 0.68 8.41 3.11** 2.70 Cor = 6.73 + 0.52T - 0.35C (10)
Appearance 0.80 9.4 3.07** 3.06 App = 6.98 + 0.50T - 0.43C - 0.38C2 (11)
(SAUREL et al., 1994; PEREIRA et al., 2006), the reason for such a phenomenon can be the change – due to the temperature rise – in the cell membrane permeability of the vegetable tissue leading to a gradual increase in solids absorption. For the sugar models, a minor negative influence of concentration was also noticed, i.e., greater concentration values contributed to reducing the increase in solids content of the fruit. According to some authors (HENG; GUILBERT; CUQ, 1990; CUNHA et al., 2001; PEREIRA et al., 2006), such behaviour can be explained by the formation – in concentrated syrups – of a superficial layer of solutes on the product, which makes mass transfer difficult. The high viscosity of concentrated syrups plus circulation difficulties also contributes to this phenomenon. As reported by Raoult-Wack (1994), such barriers impair both the gain and loss of solutes by the product. As far as the TAadm is concerned, according to Equation 7 in Table 5, the average value of 0.93 suggests that after OD, under the conditions of the central design, the product has a lower titratable acidity than does the raw material. This suggests organic acid losses by the fruit during the OD process. In addition, since the model presents a negative linear temperature term and a positive quadratic term, it can be seen that the model results in a region of minimum variation in relation to this variable. Therefore, within the region of the central design (40 °C), an increase in temperature contributes to a loss in acid thus decreasing its content in the pre-dried product. This behaviour is in partial agreement with the study of Abugoch and Guarda (1991), which reported on ascorbic acid residues in Kiwi during the OD process. According to these authors, the loss in acid increased with temperature presenting a maximum at 40 °C, the limit of the interval investigated. However, as shown in Figure 1b, there was a temperature inversion effect on TAadm after the central region. This behaviour is probably due to competition, in the opposite direction, of an increasing flow of syrup solids towards the fruit when the temperature rises, as explained before. For its part, the concentration presented a positive term in the model, which contributed to the increase in TAadm. This means that the increase in concentration decreased the acids, and vitamins. Moreover, the determination of the soluble
solids content using an optical refractometer, expressed in ºBrix provides an approximate value, which is subject to inaccuracy since the scale is calibrated for pure sucrose solutions.
Again with reference to Equations 4, 5, and 6, it can be seen that the temperature showed a prevalent effect on all the models, being positive in all cases. Thus within the range studied, a rise in temperature led to increases in the total sugar, non-reducing sugar, and soluble solids contents. Such results are in accordance with those of Pereira et al. (2006) in a study on the osmotic dehydration of tropical fruit. According to some authors
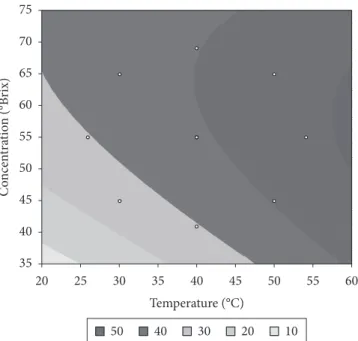
Figure 2. Contour curves of the response surfaces referring to the variation in the parameter water loss during OD as a function of process temperature and syrup concentration
With respect to the osmotic dehydration parameter WL, as can be seen in Equation 9 of Table 5, the linear temperature term showed the greatest effect followed by the linear concentration term. Both effects were positive, which contributed to the increase in water loss during OD. A rise in temperature usually accelerates and increases mass transfer. On the other hand, an increase in syrup concentration hypothetically accentuates the osmotic pressure gradient between the fruit and the solution, hence establishing an enhanced driving force for mass transfer. Nevertheless, the quadratic concentration term and the temperature/concentration interaction term, although smaller in magnitude, were negative in the model. The most probable explanation for the former effect was the difficulty found in agitation due to the high viscosities of the more concentrated syrups forming stagnated regions and impairing mass transfer. The negative effect of the temperature/concentration interaction might be related to the increase in solids absorption, with damage to cell wall permeability, causing a flow contrary to water loss. As a consequence it can be seen that the evolution of concentration in the central region limited the increase in WL and led to distortion of the curve. Such distortion was even greater with a combination of higher temperature and higher concentration, which resulted in an inflection of the curve. Consequently, an optimal region was observed in the curve, located in the temperature range from 50 to 54.1 °C and the concentration range from 45 to 65 ºBrix. According to the model, the WL values varied from 45 to 48%.
These results are partially in agreement with those of Cunha et al. (2001), who investigated the influence of temperature and concentration on water loss during the dehydration of apples using a sucrose solution. They observed that at lower temperatures there was a limit to WL growth with an increase in concentration, and attributed this to the negative effect caused by viscosity surpassing the positive effect of the increase in driving force. On the other hand, in the wider temperature ranges, they verified a continued increase in WL with increase in concentration, probably due to an inversion in the order of the effects. Therefore, there was no inflection in the curve, as can be seen in Figure 2. However, the above mentioned study was carried out in smaller ranges of the variables: temperature ranging from 20 to 40 °C and concentration from 54 to 65 ºBrix, and as can be seen in Figure 2, an inflection in the curve was still not perceived in these ranges. Therefore, it seems that in the case of the sliced peaches, the combination of temperatures higher than 40 °C and concentrations higher than 55 ºBrix, resulted in maximizing the effects contrary to water loss.
The mathematical model for WL, represented by Equation 9, is very similar to that obtained by Araujo (2005) in a study of the OD of nectarines using sucrose syrup. This comparison is quite pertinent when one considers that these fruits belong to the same botanical family. The authors investigated the influence of syrup concentration (40 to 60 ºBrix), process temperature (30 to 50 °C), and process time (90 to 240 minutes) on water loss. However, the model of Araujo (2005), unlike the model of Equation 9, included the term of the variable process time and did not include the term of interaction between the variables. The ranges of variables employed were slightly smaller and the region under investigation was more restricted due to the loss of acid from the fruit to the syrup. A possible reason for this
is the previously mentioned sugar barrier that is formed on the surface of the fruit at high concentrations, which makes it difficult to lose solids from the fruit. Such results are in agreement with those obtained by Heng, Guilbert and Cuq (1990), who showed that the use of concentrated sucrose syrups in OD implied greater amounts of ascorbic acid in the papaya.
As mentioned above, with respect to the colour variation during this process, only the L* parameter was influenced by the variables examined. This is in agreement with the findings of Tan et al. (2001) in a study on the OD of pineapple. This study concluded that luminosity was the most important component in the colour variation as a result of concentration. In the L*adm model, as shown in Equation 8, the temperature and concentration showed influence with respect to their linear terms, which were respectively positive and negative. The term with the greatest effect was temperature. The value for L*adm was 1 in the region of the central design (40 °C and 55 °Brix) indicating the non-existence of luminosity changes during the process. Under the combined conditions of higher temperature and lower concentration, an increase in L*adm was observed, i.e., the product became lighter in colour. This phenomenon was probably caused by the deposition and crystallization of sucrose on the surface of the fruit due to the greater absorption at higher temperatures, as mentioned before. This result is in agreement with the data obtained by Pereira et al. (2006), who observed an increase in L* with the increase in temperature during the OD of guavas with a sucrose solution. On the other hand, an increase in concentration and a reduction in temperature resulted in product darkening, the L*adm values being below 1. The negative effect of concentration can be related to the previously mentioned barrier of solids formed on the surface of the fruit, which impairs sugar absorption and, as a consequence, decreases the deposition and crystallization.
With respect to the attribute of texture, Table 4 shows that the mean scores presented no significant differences and corresponded to the term “I liked it moderately” in the scale. This result complies with the conclusions of the objective determination of texture, expressed as maximum cutting force (Fmax) since in the multiple regression analysis, no influence of process temperature or syrup concentration on the responses obtained was found.
With respect to the attribute of taste, the product from test 4 obtained the highest mean – equivalent to “I liked it very much” – which differed significantly from the others. The product from test 9 showed the worst result, equivalent to “I liked it slightly”.
Finally, the mathematical models obtained can also be employed to establish better process conditions. Considering an industrial process, it is understood that the best conditions are those combining the best water removal rates during the OD with the best sensory performances. Thus, by comparing the RS for the parameter WL in Figure 2 with the RS for the sensory attributes of appearance and colour in Figure 3, it can be seen that the region comprising the temperature range from 50 to 54.1 °C and syrup concentrations from 45 to 65 ºBrix combines the best water loss values with the best sensory performances. It is important to mention the fact that the test for the best performance in relation to the attribute taste, as previously mentioned, was carried out under a condition within this region. Therefore, it can be affirmed that this is the optimum region for the pre-osmotic dehydration of sliced peaches using sucrose syrup in a process combined with conventional hot air drying.
4 Conclusions
This study demonstrated that the variables of temperature and syrup concentration had a strong influence on the pre-osmotic drying process of sliced peaches using sucrose syrups. The variable temperature was the prevalent factor in most of the variations studied, usually showing a positive effect. Concentration had a smaller effect and the influence was usually negative. Regarding the variation in objective colour, only the values for luminosity (L*) suffered the influence of the factors investigated, a result supported by the sensory colour evaluation. Lighter products were preferred, and thus sugar deposition and crystallization on the surface contributed to greater acceptance. The sensory evaluation of product appearance was also influenced by the variables studied including the perception of deformations in the pieces processed under conditions of low temperature and high concentration. The region corresponding to the temperature range from 50 to 54.1 °C and concentration range from 45 to 65 °Brix can be indicated as the optimum process region since it presented the best performances in terms of water loss during pre-dehydration and in the sensory results.
Acknowledgments
The authors are grateful to Sigma Agropesquisa Company and the Cooperativa Agroindustrial Holambra for supplying raw materials. SPMG was the recipient of a scholarship from Embrapa, Empresa Brasileira de Pesquisa Agropecuária. experimental design used. Thus, it is possible that in the study
on nectarines, the contrary and combined effects of temperature and concentration were no longer significant in the working region. A comparison between the models for the condition of a temperature of 40 °C, concentration of 50 ºBrix, and process time of 240 minutes led to the following results: WL = 41 g.100 g–1 for
the model of Araujo (2005), and WL = 36.3 g.100 g–1 for model
(9), Table 5. These values are quite close to each other, and it should also be considered that the conditions used by Araujo (2005) were more suitable in terms of mass transfer: the fruit slice was thinner, the syrup: fruit mass ratio employed was 10:1; and the experiment was performed on a smaller scale.
References
ABUGOCH, J. L.; GUARDA, M. A. Estudo de la perdida de acido ascórbico total em rodajas de kiwi, durante la deshidratacion osmótica. Alimentos, v. 16, n. 5, p. 15-19, 1991.
ARAUJO, E. A. Estudo do processo de desidratação osmótica e secagem de nectarina (Prunus persica). 2005. 113 f.Tese (Doutorado em Engenharia de Alimentos)–Universidade Estadual de Campinas, Campinas, 2005.
AZUARA, E.; GARCIA, H. S.; BERISTAIN, C. I. Effect of the centrifugal force on osmotic dehydration of potatoes and apples.
Food Research International, v. 29, n. 2, p. 195-199, 1996. BARROS NETO, B.; SCARMINO, I. S.; BRUNS, R. E. Planejamento
e otimização de experimentos. 2. ed. Campinas: Editora da Unicamp, 1995.
BERISTAIN, C. et al. Mass transfer during osmotic dehydration of pineapple rings. International Journal of Food Science and Technology, v. 25, n. 5, p. 576-582, 1990.
CARVALHO, C. R. L. et al. Análises químicas de alimentos: manual técnico. Campinas: ITAL, 1990.
CHIRALT, A.; FITO, P. Transport mechanisms in osmotic dehydration: the role of structure. Food Science and Technology International, v. 9, n. 3, p. 179-186, 2003.
CHITARRA, M. I. F.; CARVALHO, V. D. Qualidade e industrialização de frutos temperados: pêssegos, ameixas, figos. Informe Agropecuário, v. 11, n. 125, p. 56-65, 1985.
CUNHA, L. M. et al. Stochastic approach to the modelling of water losses during osmotic dehydration and improved parameter estimation. International Journal of Food Science and Technology, v. 36, n. 3, p. 253-262, 2001.
FERNANDES, F. et al. Optimization of osmotic dehydration of papaya followed by air-drying. Food Research International, v. 39, n. 4, p. 492-498, 2006.
GERMER, S. P. M. et al. Aptidão das variedades de pêssego Régis, Tropical e IAC680 para produção de passas por secagem osmótica. In: CONGRESSO BRASILEIRO DE CIêNCIA E TECNOLOGIA DE ALIMENTOS, 19., 2004, Recife. Anais... Recife: SBCTA, 2004.
GERMER, S. P. M. et al. Aptidão de cultivares de pêssego do Estado de São Paulo para a produção de passas por processo combinado de secagem osmótica e secagem com ar quente. Brazilian Journal of Food Technology, v. 10, n. 3, p. 151-158, 2007.
HENG, K.; GUILBERT, S.; CUQ, J. L. Osmotic dehydration of papaya: influence of process variables on the product quality. Science des Aliments, v. 10, p. 831-848, 1990.
KOWALSKA, H.; LENART, A. Mass exchange during osmotic pre-treatment of vegetables. Journal of Food Engineering, v. 49, n. 2-3, p. 137-140, 2001.
LERICI, C. R. et al. Osmotic dehydration of fruit: influence of osmotic agents on drying behavior and product quality. Journal of Food Science, v. 50, n. 5, p. 1217-1226, 1985.
MOTA, R. V. Avaliação da qualidade físico-química e aceitabilidade de passas de pêssego submetidas à desidratação osmótica. Ciência e Tecnologia de Alimentos, v. 25, n. 1, p. 789-794, 2005.
PANAGIOTOU, N.; KARATHANOS, V. T.; MAROULIS, Z. B. Mass transfer modeling of the osmotic dehydration of some fruits.
International Journal of Food Science and Technology, v. 33, n. 3, p. 267-284, 1998.
PARK, K. J. et al. Osmotic dehydration kinetics of pear D´anjou (Pyrus communis L.). Journal of Food Engineering, v. 52, n. 3, p. 293-298, 2002.
PEREIRA, L. M. et al. Kinetic aspects, texture, and colour evaluation of some tropical fruits during osmotic dehydration. Drying Technology, v. 24, n. 4, p. 475-484, 2006.
PONTING, J. D. et al. Osmotic Dehydration of Fruits. Food Technology, v. 20, n. 10, p. 125-128, 1966.
RAOULT-WACK, A. L. Recent advances in the osmotic dehydration of foods. Trends in Food Science & Technology, v. 5, n. 8, p. 255-260, 1994.
RIVA, M. et al. Structure-property relationships in osmo-air-dehydrated apricot cubes. Food Research International, v. 38, n. 5, p. 533-542, 2005.
SAHARI, M. A.; SOUTI, M.; EMAM-JOMEH, Z. Improving the dehydration of dried peach by osmotic method. Journal of Food Technology, v. 4, n. 3, p. 189-193, 2006.
SAUREL, R. et al. Mass transfer phenomena during osmotic dehydration of apple. I. Fresh plant tissue. International Journal of Food Science and Technology, v. 29, n. 5, p. 531-542, 1994. SHI, X. Q.; FITO, P.; CHIRALT, A. Influence of vacuum treatment on
mass transfer during osmotic dehydration of fruits. Food Research International, v. 28, n. 5, p. 445-454, 1995.
TAN, M. et al. Effect of osmotic pre-treatment and infrared radiation on drying rate and color changes during drying of potato and pineapple.
Drying Technology, v. 19, n. 9, p. 2193-2207, 2001.
VIAL, C.; GUILBERT, S.; CUQ, J. L. Osmotic dehydration of kiwi fruits: influence of process variables on the color and ascorbic acid content. Science des Aliments, v. 11, n. 1, p. 63-84, 1991. VIDEV, K. et al. Effect of sugar syrup concentration and temperature on