*Correspondence: G. A. Pianetti. Departamento de Produtos Farmacêuticos, Faculdade de Farmácia - UFMG. Av. Antônio Carlos 6627 - Campus Pampulha - 31270-901 - Belo Horizonte - MG, Brazil. E-mail: [email protected]
A
rti
Pharmaceutical Sciences vol. 46, n. 2, abr./jun., 2010
Oxcarbazepine: validation and application of an analytical method
Paula Cristina Rezende Enéas, Renata Barbosa de Oliveira, Gerson Antônio Pianetti
*Department of Pharmaceutical Products, Faculty of Pharmacy, Federal University of Minas Gerais
Oxcarbazepine (OXC) is an important anticonvulsant and mood stabilizing drug. A pharmacopoeial monograph for OXC is not yet available and therefore the development and validation of a new analytical method for quantiication of this drug is essential. In the present study, a UV spectrophotometric method for the determination of OXC was developed. The various parameters, such as linearity, precision, accuracy and speciicity, were studied according to International Conference on Harmonization Guidelines. Batches of 150 mg OXC capsules were prepared and analyzed using the validated UV method. The formulations were also evaluated for parameters including drug-excipient compatibility, lowability, uniformity of weight, disintegration time, assay, uniformity of content and the amount of drug dissolved during the irst hour.
Uniterms: Oxcarbazepine/quantitative analysis. Anticonvulsants/quantitative analysis. UV spectrophotometric/method validation. Capsules/dissolution.
Oxcarbazepina (OXC) é um fármaco anticonvulsivante e estabilizante do humor. O desenvolvimento e validação de método analítico para quantiicação da OXC são de fundamental importância devido à ausência de monograias farmacopéicas oiciais para esse fármaco. Nesse trabalho, um método espectrofotométrico UV para determinação da OXC foi desenvolvido. O método proposto foi validado seguindo os parâmetros de linearidade, precisão, exatidão e especiicidade de acordo com as normas da Conferência Internacional de Harmonização. Cápsulas de OXC 150 mg foram preparadas e analisadas utilizando-se o método analítico validado. As formulações foram avaliadas com relação à compatibilidade fármaco-excipientes, luidez, determinação de peso, tempo de desintegração, doseamento, uniformidade de conteúdo e quantidade do fármaco dissolvido após 60 minutos.
Unitermos: Oxcarbazepina/análise quantitativa. Anticonvulsivante/análise quantitativa. Espectrofotometria UV/validação do método. Cápsulas manipuladas/dissolução.
INTRODUCTION
Oxcarbazepine (OXC) is a keto analog of carbama-zepine (CBZ) and is an important anticonvulsant and mood stabilizing drug. The exact mechanism of action of OXC is unknown, although it is believed to involve blockade of voltage-gated sodium channels (Kalis, Huff, 2001). It is quickly absorbed after oral administration and undergoes rapid and almost complete reductive metabolism to form the pharmacologically active 10-monohydroxy derivative (MHD)(Shorvon, 2000) (Figure 1).
Since OXC and its pharmaceutical formulations have not yet been listed in any of the Pharmacopoeias, an analytical method needs to be developed for the quality control of the product.
Several high-performance liquid chromatographic (HPLC) methods have been reported in the literature for
FIGURE 1 - Chemical structure of carbamazepine, oxcarbazepine
the determination of OXC (Pathare et al., 2007; Qi et al., 2003). To the best of our knowledge, one spectrophoto-metric method has been reported for the analysis of this drug in the literature, based on the reduction of ferric ions in their salt form to ferrous ions by the drug (Ramaa
et al., 2006). The HPLC method is widely employed in quality control assessment of drugs because of its sensiti-vity, repeatability and speciicity. On the other hand, the use of spectroscopic techniques is a promising simple, faster, direct and relatively lower cost alternative for the determination of active drug content in pharmaceutical formulations which provides suficient reliability. Hence, we developed a simple UV spectrophotometric method to determine OXC in pharmaceutical dosage forms. The method fulilled the requirements of analytical quality necessary to be applied to the assay and content uniformity tests indicated by Brazilian Pharmacopoeia(1988) for inished pharmaceutical products when these are present as single active principles, and hence can be successfully applied for routine quality control of tablets or capsules.
MATERIALS AND METHODS
Material
Oxcarbazepine was generously donated by the Cristália pharmaceutical company (Brazil). Pregelatinized starch and microcrystalline cellulose were a generous gift from Colorcon (Brazil). Corn starch and sodium lauryl sulfate were purchased from Pharmacopéia – Attivos Magisttrais (São Paulo, Brazil). Magnesium stearate and lactose monohydrate were obtained from Ipiranga Quími-ca (São Paulo, Brazil). Talc was provided by Proquímios Comércio e Indústria Ltda (Rio de Janeiro, Brazil) and aerosil and mannitol from Henrifarma Produtos Químicos e Farmacêuticos Ltda (São Paulo, Brazil). High purity water was prepared by using a Milli-Q water puriication system from Millipore. All other materials and solvents were of analytical reagent grade.
Validation of UV spectrophotometric method
The UV spectrophotometric method was performed at 305 nm. Linearity: the calibration curve was obtai-ned with nine concentrations of the standard solution (10-90 µg/mL). The solutions were prepared in
tripli-cate. The linearity was evaluated by least-squares linear regression analysis and correlation coefficients were calculated (Excel®). Precision: the precision of the assay
method was determined by repeatability (intra-day) and intermediate precision (inter-day). The intra-day
preci-sion was evaluated by analyzing six samples at 100% (50 μg/mL) of the test concentration (n = 6). Similarly, the intermediate precision was evaluated on two con-secutive days (n = 12). The concentration of OXC was determined and the value of relative standard deviation (%R.S.D) of the assay method was calculated. Accuracy:
accuracy was determined by spiking known amounts of the analyte into the placebo formulation (F1, F2 and F3) across the speciied range of the analytical procedure to obtain 40, 50 and 60 µg/ml (80, 100 and 120%). At each
level, solutions were prepared in triplicate and the accu-racy was evaluated in terms of percent recovery. Percent Recovery was calculated using the formula [%Recovery = 100 x Mean Experimental Concentration/ Theoretical Concentration]. Selectivity: the method selectivity was assessed by comparing UV spectrum obtained from the OXC with those obtained from placebo formulations (ex-cipients solution in methanol without OXC). Robustness: three sample solutions were prepared each containing 50 µg/mL, and analyzed in two different UV-visible
spec-trophotometers (Hewlett Packard 8453 and Shimadzu 160A) immediately after the preparation of the solutions. The data obtained was submitted to statistical analysis (Student’s t test) at a signiicance level of 0.05. Detection and quantiication limits: detection and quantiication limits were determined based on the standard deviation of the response (σ) and the slope (S) of the calibration curve of the analyte. The detection limit may be expressed as 3.3(σ/ S) and the quantiication limit may be expressed as 10(σ/ S) (ICH, 1996).
Development of capsule formulations
Differential scanning calorimetry (DSC)
Compatibilities of several commonly used pharma-ceutical excipients with OXC were evaluated using the Differential Scanning Calorimetry (DSC) technique. DSC thermograms of the drug alone, each excipient alone, and drug-excipient physical mixtures (1:1 w/w) were derived from a DSC (TA-2910, TA-instruments). The instrument was calibrated with an indium standard. The compounds were ground for 5 min using a pestle and mortar. The po-wders obtained were slightly compacted in the aluminium pan by a steel plunger to achieve a uniform powder bed in contact with the pan bottom. The samples (2-4 mg) were heated (25-250 °C) at a constant scanning speed (10 °C/min), using nitrogen as the purging gas.
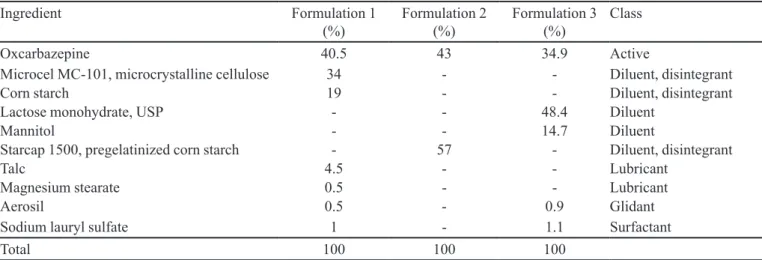
Capsule formulations
TABLE I - Formulations of 150 mg OXC Capsules
Ingredient Formulation 1
(%) Formulation 2 (%) Formulation 3 (%) Class
Oxcarbazepine 40.5 43 34.9 Active
Microcel MC-101, microcrystalline cellulose 34 - - Diluent, disintegrant
Corn starch 19 - - Diluent, disintegrant
Lactose monohydrate, USP - - 48.4 Diluent
Mannitol - - 14.7 Diluent
Starcap 1500, pregelatinized corn starch - 57 - Diluent, disintegrant
Talc 4.5 - - Lubricant
Magnesium stearate 0.5 - - Lubricant
Aerosil 0.5 - 0.9 Glidant
Sodium lauryl sulfate 1 - 1.1 Surfactant
Total 100 100 100
Flow properties
Densities of bulk were examined as suggested by the British Pharmacopoeia’s Technical Procedure “Apparent Volume” (British Pharmacopoeia, 2008) using an Erweka SVM volumeter. Deviating from the instructions, a 100 ml graduated cylinder was used for better accuracy in reading volumes. The cylinder was illed with 25-35 g of OXC or ex-cipients only (Sartorius 2482 balance, accuracy ± 0.1 mg). The initial volume was measured and poured densities calculated. After 1250 taps the corresponding volume was read to the nearest milliliter. V1250 was used to calculate tapped density. The bulk and tapped densities were also determined for each formulation (drug + excipients).
From the bulk and tapped densities, Carr’s index (CI) (Carr, 1965) was calculated for each formulation, using the following equation:
Capsule preparation
Micronized OXC and excipients were weighed, passed through a 16 mesh sieve and mixed for 5 minutes in a porcelain mortar and pestle. Magnesium stearate and/or aerosil were then added to each mixture, and the mixture was blended for 1 additional minute. The typical batch size was 100 capsules. All batches were prepared according to uniform procedures. All hard gelatin capsules were size 0. The dose of OXC was 150 mg/capsule. A manual illing machine was used.
Physicochemical analyses of capsules
Uniformity of weight and disintegration time were evaluated according to the methodologies described in the
British Pharmacopoeia (2008) and Brazilian Pharmaco-poeia(1988), respectively.
Assay and uniformity of content of capsules
Quantitative analyses were carried out using the UV spectrophotometric method validated as described in the item “Validation of UV spectrophotometric method”. Assay and content uniformity testing were performed for all formulations tested. Assay: twenty capsules were ran-domly selected and the quantity of powder equivalent to 100 mg of OXC was dissolved in methanol, transferred to a 100 mL volumetric lask, and the volume completed with the same solvent. Content uniformity testing: ten capsules were randomly selected and individually assayed for OXC amount. The concentration of each batch was determined from the calibration curve previously obtained for a pure sample of OXC.
Dissolution
theoretical dissolution concentration, while the dissolution proiles were obtained by plotting average percentage of drug release versus time.
The interference of SLS of the dissolution medium on the quantitative step of the dissolution profile was evaluated. The spectrum of the standard solutions of OXC 50.00 μg/mL (blank determination with SLS at the concentrations of 0.5% and 1.0%) and the spectrum of the solutions containing 0.5 and 1.0% SLS (blank determina-tion with water) were superimposed.
The linearity was evaluated by linear regression analysis, which was calculated by the least squares regres-sion method. After the end of the test time, each sample aliquot was diluted to a suitable concentration to reach optimal absorption measurement of about 0.5 absorbance units. Data were analyzed using ANOVA and Tukey’s tests.
RESULTS AND DISCUSSION
Validation of UV spectrophotometric method
The proposed UV method allows rapid and eco-nomical quantitation of OXC in capsules without any time-consuming sample preparation. Moreover, the spec-trophotometric methods involve simple instrumentation compared with other instrument techniques. The stock solutions and working standards were made in methanol. The λmax of the drug for analysis was determined by taking scans of the drug sample solutions in the entire UV region (200-400 nm). The wavelength 305 nm was then used for all measurements.
L i n e a r i t y: t h e m e t h o d d e m o n s t r a -ted to be linear, with a correlation coefficient of the standard curve greater than 0.999. The line-ar regression equation was y = 10.125x – 0.0092. Beer’s law is obeyed over this concentration range.
Precision: in the intra-day precision analysis (n = 6), the mean OXC content in the F1, F2 and F3 formulations were 98.98% (R.S.D. = 1.19%), 95.98% (R.S.D. = 1.18%) and 100.47% (R.S.D. = 1.03%), respectively. The values found in the inter-day precision (n = 12) were 98.89% (R.S.D. = 0.87%), 95.75% (R.S.D. = 0.91%) and 100.48% (R.S.D. = 1.25%) for the formulations F1, F2 and F3, respectively. The R.S.D (%) values obtained of less than 2.0%, attested to the precision of the method.
Accuracy: the mean recovery (n = 9) of OXC from the F1, F2 and F3 formulations were 100.38% (R.S.D. = 0.92%), 100.04% (R.S.D. = 0.69%) and 99.60% (R.S.D. = 0.79%), respectively. These results indicate the accuracy of the proposed method for the determination of OXC.
Selectivity: placebo samples showed no interference in absorbance at 305 nm. These results demonstrate the good selectivity of the method.
Robustness: the mean absorbances measured using two different spectrophotometer models (Hewlett Packard 8453 and Shimadzu 160A) were 0.504 and 0.499, respec-tively. The experimental t value (2.69) was lower than the table value (2.78), indicating there was no signiicant diffe-rence between the results from the two spectrophotometers.
Detection and quantification limits: the limit of detection of OXC achieved was 0.62 µg/mL. The limit of quantiication achieved with this method was 1.88 µg/mL.
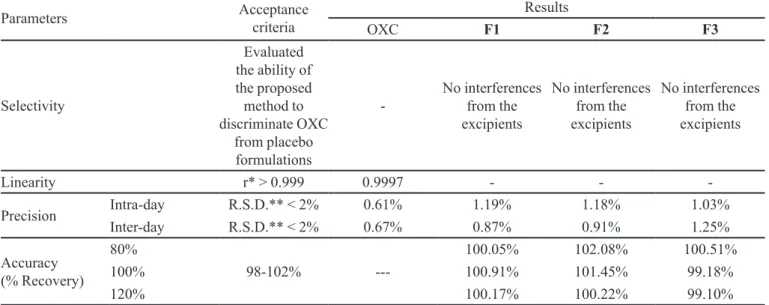
All the method validation parameters were well within the limits speciied in the ICH Q2R1 guidelines (1996). A summary of results is shown in Table II.
Development of capsule formulations
Differential scanning calorimetry (DSC)
Interactions in the solid state among the active ingre-dient and excipients in pharmaceutical dosage forms can give rise to changes in the stability, solubility, dissolution rate and bioavailability of drugs. Therefore, it would be extremely useful in the development of new pharmaceu-tical formulations to have readily available knowledge about potential physical and chemical interactions between drugs and excipients. Differential scanning calorimetry (DSC) has shown to be a powerful tool in the irst step of preformulation studies for investigating and predicting physicochemical incompatibility between a drug and phar-maceutical excipients (Giron, 2002). DSC compatibility studies were carried out by comparing the thermal curve of pure OXC with the curves obtained from pure OXC at 1:1 w/w individual mixtures with each excipient under consideration.
The DSC curve of OXC was typical of a pure crys-talline substance, showing a sharp endothermic peak at its melting point, with an onset temperature of 221.13 ºC. No signiicant degradation was seen to occur before 240 ºC. The melting temperature determined from the DSC curve was in accordance with that described in the literature, 219-221 ºC (Carril etal., 2005).
TABLE II - Validation parameters for UV method of analysis of OXC
Parameters Acceptance criteria Results
OXC F1 F2 F3
Selectivity
Evaluated the ability of the proposed method to discriminate OXC
from placebo formulations
- No interferences from the excipients
No interferences from the excipients
No interferences from the excipients
Linearity r* > 0.999 0.9997 - -
-Precision Intra-day R.S.D.** < 2% 0.61% 1.19% 1.18% 1.03% Inter-day R.S.D.** < 2% 0.67% 0.87% 0.91% 1.25%
Accuracy (% Recovery)
80%
98-102%
---100.05% 102.08% 100.51%
100% 100.91% 101.45% 99.18%
120% 100.17% 100.22% 99.10%
*Correlation coeficient. **R.S.D. = Relative Standard Deviation
Although some excipients were found to interact with OXC, one cannot conclusively state this incompatibi-lity will be encountered upon storage at room temperature. These results suggest that Formulation 2 was the best for-mulation among those studied (OXC is fully compatible with starch). Despite a possible incompatibility between OXC and some excipients of Formulations 1 and 3, these formulations were prepared in order to evaluate the effect of commonly used excipients on the extent and/or rate of drug release. It is noteworthy that these excipients are present in OXC tablets available in the pharmaceutical market.
Flow properties
Poured densities of the OXC and formulations
(Ta-TABLE III– DSC data on drug and excipients
Sample Melting endotherm onset (ºC)
OXC 221.13
OXC/ microcrystalline cellulose 223.66
OXC/starch 218.81
OXC/talc 224.50
OXC/sodium lauryl sulfate -OXC/mannitol 208.63 OXC/ colloidal silica 206.11 OXC/lactose 199.40 OXC/ magnesium stearate 206.64
ble IV) ranged from 0.38 g/mL (OXC) to 0.49 g/mL (For-mulation 3), and tapped densities from 0.49 g/mL (OXC) to 0.64 g/mL (Formulation 3). The values of the calculated
CI (Table IV) ranged from 14.8 (Formulation 1) to 25.0 (Formulation 2). A CI below 15% is considered to be an indication of good lowability and thus Formulation 1 had excellent lowability. Formulations 2 and 3 had a CI above 15%, which is regarded to represent the threshold between free low (<15%) and no low (>25%).
Physicochemical analyses of capsules
Initially, the physicochemical characteristics of the capsules were evaluated. The summary of the uniformity of weight and disintegration time is shown in Table V.
Mean weight, obtained from individual weights of 20 capsules, yielded information about the variations in weight in capsules from the same batch, constituting one of the parameters which could inluence the active uniformity of content among different capsules. Determi-nation of disintegration time evaluates the time necessary for the release of OXC from the capsule. The OXC must be released from the capsule as eficiently as possible to allow for its rapid dissolution. If a pharmaceutical agent is released from the capsule slowly it cannot have a rapid dissolution rate whereas if disintegration is rapid then rapid dissolution is possible.
Table IV - Results of density measurements
Drug and
Formulations Sample mass (g) Bulk volume (mL) Tapped volume (mL) Bulk density (g/mL) Tapped density (g/mL) Carr index (%)
OXC 25.35 66 51.5 0.3841 0.4922 22.0
Formulation 1 29.01 61 52 0.4756 0.5579 14.8 Formulation 2 29.85 64 48 0.4664 0.6219 25.0 Formulation 3 30.00 61 47 0.4918 0.6383 22.9
TABLE V– Physicochemical analyses of different formulations of OXC capsules
Formulations Mean weight (N= 20) Disintegration time (min) (N=6) Maximum deviation Minimum deviation
1 4.93 -5.51 10
2 5.95 -2.87 10
3 5.67 -3.99 6
Limits Max. 7.5% Max. 45 min
showed that all evaluated formulations were in accordance with the oficial speciications.
Assay and uniformity of content of capsules
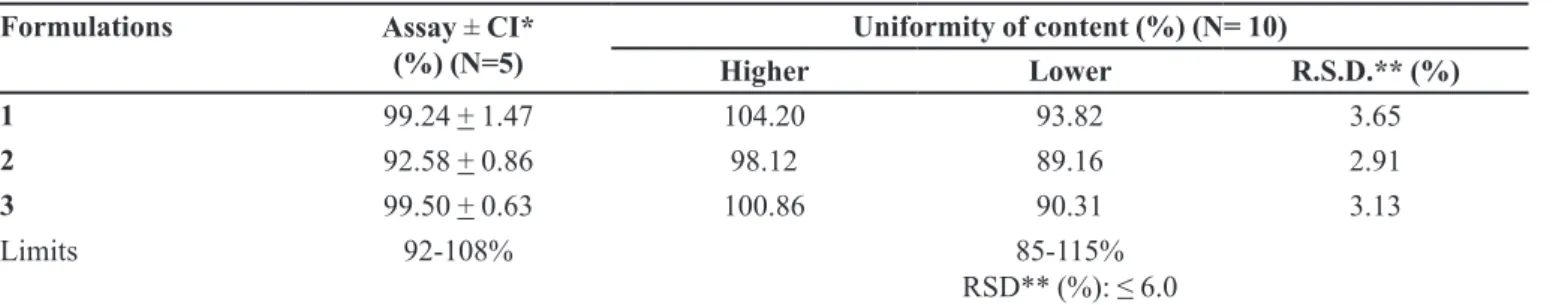
Subsequently the active substance was assayed and uniformity of content in the capsule samples was deter-mined. The results of the drug assay and uniformity of content are shown in Table VI.
The drug assay is a test to compare the theoreti-cal quantitative contents of active substances in dosage forms (declared value) with the real values, determined experimentally by their quantiication using established and validated methods. There is no Pharmacopeia mo-nograph establishing acceptance criteria for the assay of OXC. Therefore, we consider the commonly accepted limit of 92-108% of the label claim (speciied limit for the carbamazepine). The analysis of the uniformity of content evaluates the drug dose variation among each unitary
TABLE VI - Assay and uniformity of content of different formulations of OXC capsules
Formulations Assay ± CI*
(%) (N=5) Higher Uniformity of content (%) (N= 10)Lower R.S.D.** (%)
1 99.24 + 1.47 104.20 93.82 3.65
2 92.58 + 0.86 98.12 89.16 2.91
3 99.50 + 0.63 100.86 90.31 3.13
Limits 92-108% 85-115%
RSD** (%): ≤ 6.0 *CI = Conidence interval 0.95. ** R.S.D. = Relative Standard Deviation
dosage form from the same batch.
Regarding the evaluation of the samples assay and its relation to the respective chemical reference substances, Formulations 1, 2 and 3 showed a drug content between 92% and 108% of the declared value for the active substan-ce. In relation to the uniformity of content test, all samples met the general speciication for capsules (85%-115%, RSD ≤ 6.0%) (Brazilian Pharmacopoeia, 1996).
Dissolution
The method demonstrated to be linear in the con-centration ranges of 10-90 µg/ml (SLS 0.5% w/v) and 30-90 µg/mL (SLS 1.0% w/v) and all correlation coefi-cients (r) were over 0.999. The linear regression equa-tion was y = 0.0093x – 0.0079 for SLS 0.5% w/v and y = 0.0091x – 0.0046 for SLS 1.0% w/v. Beer’s law is obeyed over this concentration range.
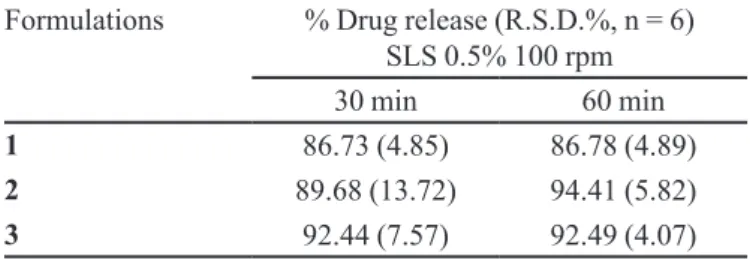
Based on FDA recommendations for water insoluble or sparingly water soluble drug products, use of a surfac-tant such as sodium lauryl sulfate is recommended where the surfactant should be used in the smallest possible amount (FDA, 1997). OXC is a sparingly water soluble drug and physiological variations in pH have no effect on its solubility (Flesch, 2004). Thus, the addition of LSS was necessary to enhance drug solubility. The experi-mental results suggest that SLS 0.5% w/v yielded a better dissolution medium condition. Therefore, the optimum dissolution conditions were determined as follows: 0.5% SLS as dissolution medium, in baskets at a stirring speed of 100 rpm as apparatus and time of 30 min, tolerance of 80%, and determination accomplished by spectrophoto-metry at 305 nm. The average percent release of OXC in 30 and 60 minutes, from the three formulations is shown in Table VII.
Statistical methods based on the analysis of variance (ANOVA) and Tukey’s test were used to compare the re-sults of the dissolution test after 30 and 60 minutes. There was no signiicant difference between the data obtained from Formulations 1-3 after 30 minutes (p > 0.05). In con-trast, there was a signiicant difference between the rates of dissolution of Formulations 1 and 2 after 60 minutes (p < 0.05). Typical acceptance criteria for the amount of drug dissolved lie in the range of 85% dissolved after 30 minutes (FDA, 1997). All formulations presented more than 85% of OXC dissolved in 30 minutes.
OXC capsules are dosage forms for immediate re-lease and therefore the tested formulations were adequate for this purpose.
Table VII - Mean percent drug release from the three formulations
in SLS 0.5% (w/v) dissolution medium
Formulations % Drug release (R.S.D.%, n = 6) SLS 0.5% 100 rpm 30 min 60 min
1 86.73 (4.85) 86.78 (4.89)
2 89.68 (13.72) 94.41 (5.82)
3 92.44 (7.57) 92.49 (4.07)
CONCLUSIONS
In conclusion, the UV spectrophotometric method described in the present study has been shown to be ac-curate, sensitive, precise, rapid and easy to perform. In addition, the proposed method can be applied to the quality control analysis of OXC without interferences from the excipients normally used in capsule formulations. The method was successfully applied to analyze OXC in three developed formulations.
The dissolution test developed and validated for OXC capsules was considered satisfactory and can be used for quality control and pharmacotechnical development purposes. Rapid drug release was obtained from the three tested formulations.
Among the formulations tested, Formulation 2 was the best in terms of drug-excipient compatibility. In addi-tion, Formulation 2 showed suficient lowability to ensure uniform illing of capsules and a good dissolution proile.
ACKNOWLEDGEMENTS
The authors are grateful to the Brazilian Pharmaco-poeia for the inancial support and to the CNPq (Brazil).
REFERENCES
BRAZILIAN Pharmacopoeia. 4.ed. São Paulo: Atheneu, 1988. 268 p.
BRITISH Pharmacopoeia. London: The Stationary Office, 2008. 3500 p.
CARRIL, M.; SANMARTIN, R.; CHURRUCA, F.; TELLITU, I.; DOMÍNGUEZ, E. An advantageous route to oxcarbazepine (Trileptal) based on palladium-catalyzed arylations free of transmetallating agents. Org. Lett., v.7, p.4787-4789, 2005.
CARR, R. L. Evaluating low properties of solids. Chem. Eng., v.72, p.163-168, 1965.
FOOD AND DRUG ADMINISTRATION. FDA. Guidance for industry: dissolution testing of immediate release solid oral dosage forms. Rockville: CMC, 1997. Available at: <http:// www.fda.gov/cder/Guidance/1713bp1.pdf>. Accessed on: 4 May 2008.
GIRON, D. Applications of thermal analysis and coupled techniques in pharmaceutical industry. J. Therm. Anal. Cal., v.68, p.335-357, 2002.
ICH, International Conference on Harmonization. Validation of Analytical Procedures: Text and Methodology Q2(R1). 1996. Available at: http://www.ich.org/LOB/media/ MEDIA417.pdf. Accessed on: 10 jan. 2009.
KALIS, M. M.; HUFF, N. A. Oxcarbazepine, an antiepileptic agent. Clin. Therap., v.23, p.680-700, 2001.
PATHARE, D. B.; JADHAV, A. S.; SHINGARE, M. S. A validation stability indicating LC method for oxcarbazepine.
J. Pharm. Biomed. Anal., v.43, p.1825-1830, 2007.
QI, M. L.; WANG, P.; WANG, L. J.; FU, R. N. LC method for the determination of oxcarbazepine in pharmaceutical preparations. J. Pharm. Biomed. Anal., v.31, p.57-62, 2003.
RAMAA, C. S.; CHOTHE, P. P.; NAIK, A. A.; KADAM, V. J. Spectrophotometric method for the estimation of oxcarbazepine in tablets. Indian J. Pharm. Sci., v.68, p.265-266. 2006.
SHORVON, S. Oxcarbazepine: a review. Seizure, v.9, p.75-79, 2000.
Received for publication on 12th May 2009