The impact of atmospheric particulate matter on
cancer incidence and mortality in the city of
São Paulo, Brazil
Infl uência do material particulado atmosférico na
incidência e mortalidade por câncer no Município
de São Paulo, Brasil
1 Faculdade de Saúde Pública, Universidade de São Paulo, São Paulo, Brasil. 2 Faculdade de Filosofia, Letras e Ciências Humanas, Universidade de São Paulo, São Paulo, Brasil. Correspondence Y. Yanagi
Faculdade de Saúde Pública, Universidade de São Paulo. Av. Dr. Arnaldo 715, São Paulo, SP 01246-904, Brasil. [email protected]
Yoshio Yanagi 1
João Vicente de Assunção 1
Ligia Vizeu Barrozo 2
Abstract
This study aimed to verify the impact of inhalable particulate matter (PM10) on cancer incidence
and mortality in the city of São Paulo, Brazil. Statistical techniques were used to investigate the relationship between PM10 on cancer incidence
and mortality in selected districts. For some types of cancer (skin, lung, thyroid, larynx, and blad-der) and some periods, the correlation coefficients ranged from 0.60 to 0.80 for incidence. Lung can-cer mortality showed more correlations during the overall period. Spatial analysis showed that districts distant from the city center showed high-er than expected relative risk, depending on the type of cancer. According to the study, urban PM10
can contribute to increased incidence of some cancers and may also contribute to increased cancer mortality. The results highlight the need to adopt measures to reduce atmospheric PM10
levels and the importance of their continuous monitoring.
Air Pollutants; Particulate Matter; Neoplasms
Introduction
Various studies 1,2,3 have shown an association
between air pollution and its effects on human health, even with low levels of pollutants. The effects are seen in overall mortality and specific areas such as cardiovascular and respiratory dis-eases and cancer 4,5,6.
The broad term “particulate matter” (PM) includes a class of pollutants consisting of solid and liquid material that can remain suspended in the atmosphere due to their small size. Inhal-able particles have an aerodynamic diameter less than 10µm. Finer particles (less than 2.5µm) can reach the pulmonary alveoli, while larger parti-cles (from 2.5 to 10µm) are retained in the upper airways.
PM is considered the most efficient trans-porter of air pollutants into the body 7.
The presence of carcinogenic agents in the air pollution mix could partially explain why air pollutants increase the risk of lung cancer and possibly that of other cancers 8. Cancer risk in a
given population depends directly on the latter’s biological and behavioral characteristics as well as the surrounding social, environmental, politi-cal, and economic conditions. This understand-ing is essential for determinunderstand-ing investments in risk assessment research and effective preven-tion measures 9.
effec-tive treatment for inoperable metastatic tumors. However, recent decades have witnessed prog-ress in therapies and surgical techniques, thus increasing patient survival 10.
Studies on exposure to risk factors are use-ful for a more comprehensive view of cancer etiology 11. The two most important methods
to identify the effects of pollution on health are epidemiological investigations and experimental studies 12.
The city of São Paulo, Brazil, internationally known from the economic, political, and social points of view, suffers increasingly from prob-lems with gargantuan traffic jams and thus in-creasing air pollution. The city is divided into 96 administrative districts.
Cancer incidence and mortality in the city of São Paulo has shown a similar pattern to that of developed countries. According to Mirra et al. 13,
this pattern may relate to several factors such as the growth of more elderly age groups, im-proved socioeconomic conditions in the region, and possibly also a drop in the fertility and infant mortality rates.
Environmental changes caused by humans and lifestyle changes may lead to different types of cancer.
According to the Brazilian National Can-cer Institute (Instituto Nacional de CânCan-cer – INCA) 14, approximately 80% of all cancer cases
in Brazil are associated with environmental fac-tors involving the general environment (water, land, and air), occupational environment (facto-ries and similar industrial facilities), consump-tion (food and medicines), and social and cul-tural environment (lifestyle and habits).
The principal carcinogenic agents from en-vironmental pollution include byproducts of in-complete burning of fossil fuels, especially diesel. Air pollution is formed by a variable and complex mixture of these compounds 8.
The realization that cancer is a nationwide public health problem in Brazil led to the formu-lation and implementation of actions, plans, and programs targeting control of the disease, includ-ing improvement and expansion of the special-ized network of medical and hospital care and early detection measures. Preventive measures include health promotion and intervention in cancer risk factors. An important component in the response to this national challenge is knowl-edge on the incidence and mortality related to the principal forms of cancer, as well as preva-lence of exposure to risk factors 15.
Thus, due to the theme’s public health rel-evance, the current study aimed to assess the impact of air pollution on cancer incidence and mortality in the city of São Paulo.
Methods
This was an ecological time series study. In eco-logical studies, the unit of analysis is a population or group of persons that generally belongs to a defined geographic area, such as a country, state, or city 16.
Incidence and mortality for each type of can-cer in the districts with air quality monitoring were correlated with PM10 values using Pearson’s
correlation coefficient, considering a time lag of 0 to 17 years, also verifying the p-value as the mea-sure of statistical significance. The correlation co-efficient (r) was considered high if 0.60 < r < 0.80 17
and statistical significance was set at p < 0.05. Relative risks (RR) were also calculated for the period in each administrative district, for the incidence and mortality of the types of cancer with the highest statistical correlation coefficient with PM10. Relative risks were calculated using SaTScan, version 8.0 (http:\\www.satscan.org, USA) as the ratio between the number of observed cases for each sex and age bracket according to World Health Organization (WHO) guidelines in each district and the number of expected cases for each, according to the population’s composi-tion by sex and age brackets. The reference rate was calculated based on the total number of cas-es in the city, by sex and age bracket, for the study period and was used for calculating the expected number of cases.
The cartographic rendering of these results allows analyzing spatial risk distribution. Carto-graphic representation used the choropleth tech-nique since it indicated for depicting rates, pro-portions, or indices. According to this technique, the increasing order of relative values grouped in significant classes is transcribed by a corre-spondingly increasing visual order 18.
The division of class intervals on the maps was done by standardized discretization. This technique uses the mean and standard deviation of the series of values, allowing comparison be-tween different maps. The point of departure was the elaboration of the histogram and calculation of the mean, median, mode, and asymmetry co-efficient. Since most of the series of relative risk values displayed marked asymmetry, the values were log-transformed before discretization to ap-proach normal distribution. The class intervals in the original values were obtained from the re-ciprocal function of the initial function, in this case the common logarithm, namely 10x. The
The research project was approved by the In-stitutional Review Board of the School of Public Health, University of São Paulo (Faculdade de Saúde Pública, Universidade de São Paulo; OF. COEP/069/09).
Data on particulate matter (PM10)
Considering the long-term effect of pollution on health, the mean annual PM10 levels were
obtai-ned for the years 1988 to 1997. These data were furnished by the São Paulo State Environmental Company (Companhia Ambiental do Estado de São Paulo – CETESB), which monitors the air qua-lity in some districts of the city of São Paulo: Brás, Santana, Moóca, Cambuci, Moema, Freguesia do Ó, Campo Belo, Lapa, Consolação, Santo Amaro, and São Miguel.
An important factor in air pollutant monitor-ing systems is data quality control based on the adoption of criteria for representativeness. When the data from a given air quality monitoring sta-tion and in a given period present measurement flaws, the results may be jeopardized. According to the CETESB 19, in order for the annual mean
PM10 to be considered representative, the
sta-tion should present half of the valid means for the four-month periods of January-April, May-August, and September-December. In the year 1995, the monitoring stations located in the dis-tricts of Santana, Cambuci, Moema, Campo Belo, and Santo Amaro failed to meet this criterion. In 1996, among the selected districts, no station that measured PM10 met the criterion for data
representativeness.
Epidemiological and demographic data
We analyzed the most frequent types of cancer and those that caused the most deaths in the
city of São Paulo: skin, breast, prostate, bladder, stomach, rectum, uterine cervix, esophagus, co-lon, larynx, thyroid, and lung, selected according to the International Classification of Diseases for Oncology (ICD-O) 20. Cancer data were collected
from the São Paulo Cancer Registry for the years 1997 to 2005 for incidence and 1997 to 2004 for mortality 13. Data for 2005 were not considered
for mortality, since they were not consolidated according to this parameter for the study’s data collection period. The dataset included 36,534 cases and 12,934 deaths.
Incidence and mortality rates were calculated based on the population per administrative dis-trict of the city for 1997 to 2005, estimated by the Foundation of the São Paulo State Data Analysis System (Fundação Sistema Estadual de Análise de Dados – SEADE Foundation).
The São Paulo Cancer Registry adopts qual-ity control indices suggested by the International Agency for Research on Cancer (IARC) and INCA. IARC is part of the WHO, and its work involves coordinating research on the causes of human cancer, mechanisms of carcinogenesis, and the development of scientific strategies for cancer prevention and control. Table 1 shows the quality indices obtained by the São Paulo Cancer Regis-try for the period from 1997 to 2005, compared to the indices suggested by IARC and INCA.
According to the suggested quality control indices, only diagnoses based on histocytologi-cal examinations were considered. Notifications based only on the death certificate should not exceed 20% of the reported cases, since such notifications indicate that the diagnosis was not made until after death. Delay in diagnosis of the disease can also be observed when there is an un-specified primary site, which should be less than 10% in order to guarantee the dataset’s quality. The mortality/incidence ratio may indicate lack
Table 1
Quality control indices obtained by the São Paulo Cancer Registry (1997-2005) and suggested by the International Agency for Research on Cancer (IARC) and the Brazilian National Cancer Institute (INCA).
Quality control indices Percentage obtained by the São Paulo Cancer Registry (1997-2005)
Percentage suggested by IARC/INCA
Histocytological diagnosis 83.0 > 70.0
Notification based only on death certificate
4.4 ≤ 20.0
Age unknown 9.9 < 10.0
Unspecified primary site 3.7 < 10.0
Mortality/incidence ratio 30.0 From 20.0 to 30.0
of notification of the disease. The rate of miss-ing data for age may indicate possible flaws in completing the notification form. The quality control percentages obtained by the São Paulo Cancer Registry from 1997 to 2005 indicated that they were within the values suggested by IARC and INCA, although the percentage of missing information on age and the mortality/incidence ratio showed only borderline acceptability.
Data analysis
Incidence and mortality rates by type of cancer were calculated with the following formulas.
• Incidence rate:
(number of cancer cases / mid-year population) x 100,000
• Mortality rate:
(number of cancer deaths / mid-year popula-tion) x 100,000
Results
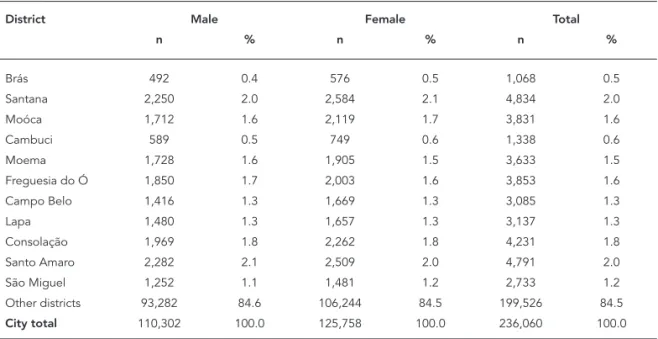
Table 2 shows the distribution of cases by district, sex, and period in the city of São Paulo.
Cases were considered that provided the pa-tient’s place of residence for all types of cancer.
From 1997 to 2005, there were more cancer cases in women (53.3%) than in men (46.7%) in the city of São Paulo.
Table 3 shows cancer deaths from 1997 to 2004 in the selected districts in the city of São Paulo, distributed by sex, considering all types of cancer.
In the city of São Paulo, the proportion of can-cer deaths from 1997 to 2004 was higher in men (52.6%) than in women (47.4%).
Correlation analysis indicated that for some types of cancer (skin, lung, thyroid, larynx, and bladder), statistical correlation was high and sig-nificant in some periods, especially for incidence. Table 4 presents the correlation coefficients be-tween skin cancer incidence and PM10 and Table
5 presents the correlation coefficients between lung cancer incidence and PM10.
The time lag between skin cancer incidence rates and PM10 exposure varied from 7 to 14 years,
while for lung cancer, the significant correlations occurred from 11 to 16 years after exposure.
Figure 1 shows the types of cancer, according to the number of events with high correlations and significant p-values, based on monitoring PM10 for incidence.
Skin cancer showed one value with high cor-relation in the year 1989, three in 1991, seven in 1992, five in 1993, totaling 16 high correlations for incidence during the period.
Lung cancer showed 15 high correlations be-tween 1988 and 1997 for incidence.
PM10 values measured from 1988 to 1997 may
possibly impact cancer incidence from 1997 to 2005.
Table 2
Proportional distribution of cancer (number of cases and percentage), according to gender and target administrative districts in the city of São Paulo, Brazil, 1997-2005.
District Male Female Total
n % n % n %
Brás 492 0.4 576 0.5 1,068 0.5
Santana 2,250 2.0 2,584 2.1 4,834 2.0
Moóca 1,712 1.6 2,119 1.7 3,831 1.6
Cambuci 589 0.5 749 0.6 1,338 0.6
Moema 1,728 1.6 1,905 1.5 3,633 1.5
Freguesia do Ó 1,850 1.7 2,003 1.6 3,853 1.6
Campo Belo 1,416 1.3 1,669 1.3 3,085 1.3
Lapa 1,480 1.3 1,657 1.3 3,137 1.3
Consolação 1,969 1.8 2,262 1.8 4,231 1.8
Santo Amaro 2,282 2.1 2,509 2.0 4,791 2.0
São Miguel 1,252 1.1 1,481 1.2 2,733 1.2
Table 3
Proportional distribution of cancer (number of deaths and percentage) according to gender and selected districts in the city of São Paulo, Brazil, 1997-2004.
District Male Female Total
n % n % n %
Brás 192 0.4 205 0.5 397 0.4
Santana 1,002 2.0 916 2.1 1,918 2.0
Moóca 666 1.3 696 1.6 1,362 1.4
Cambuci 259 0.5 273 0.6 532 0.6
Moema 545 1.1 519 1.2 1,064 1.1
Freguesia do Ó 857 1.7 716 1.6 1,573 1.7
Campo Belo 537 1.1 504 1.1 1,041 1.1
Lapa 616 1.2 583 1.3 1,199 1.3
Consolação 572 1.2 574 1.3 1,146 1.2
Santo Amaro 867 1.8 726 1.6 1,593 1.7
São Miguel 591 1.2 518 1.2 1,109 1.2
Other districts 42,798 86.5 38,333 86.0 81,131 86.2 City total 49,502 100.0 44,563 100.0 94,065 100.0
Figures 2 and 3 present the relative risk maps for incidence and mortality rates for skin and lung cancer showing high correlations with PM10. The opposing colors indicate that values below 1 refer to the districts with fewer cases or deaths than expected, while values greater than 1 indi-cate more cases or deaths than expected for the respective districts.
The relative risk map for skin cancer inci-dence on this scale of analysis shows a radial-concentric distribution, highlighting two districts with RR two standard deviations above the mean: Morumbi and Moóca. However, for skin cancer mortality, Morumbi no longer ranked highest. The highest risks were in the following districts: Butantã, Bela Vista, República, Brás, Moóca, and Tatuapé. The relative risk maps for lung cancer incidence and mortality showed similar spatial patterns during the study period. The risks for in-cidence were high in Santo Amaro, Butantã, Con-solação, Bela Vista, Bom Retiro, and Brás. Santo Amaro, Consolação, Bom Retiro, and Brás also showed high mortality risk.
Discussion
Pearson correlation showed high incidence rates for some types of cancer: skin, lung, lar-ynx, thyroid, and bladder. For skin cancer, the correlation coefficients were high and signifi-cant, considering the PM10 prior to 1993 and the
incidence rates after 1999. The results for lung
cancer were similar to skin cancer, showing high and significant correlations with PM10 prior to
1993 and incidence rates starting in 2000. For the incidence of cancer of the larynx, thyroid, and bladder, there were fewer high correlations, but they mostly occurred prior to 1993. As for mor-tality, the high correlations occurred with lung cancer. The long time lag between PM10 and
in-cidence and mortality rates confirmed the long latency period for lung cancer, corroborating the literature 21.
Cangerana-Pereira et al. 22, in a study on the
impact of overall air pollution on the incidence of lung and laryngeal cancer in the city of São Paulo in 1997, found a significant association be-tween laryngeal cancer and ozone, highlighting the need for future studies for verification and better understanding of the long-term impact of pollution on human health.
A considerable proportion of known risk fac-tors for cancer relates to long-term exposures 9.
According to a review by Pope 3rd 23, the adverse
health effects depend on the concentration and duration of exposure. Long-term exposure to PM has larger, more persistent, and more cumulative effects than short-term exposure. Studies have shown that long exposure to PM is associated with deficits in pulmonary function and an increase in the symptoms of chronic obstructive pulmonary disease, like chronic cough and bronchitis. PM10
Table 4
Correlation coeffi cients and p-values for skin cancer incidence (1997 to 2005) and inhalable particulate matter (PM10) (1988 to
1997), in selected districts in the city of São Paulo, Brazil.
PM10 1997 1998 1999
Correlation p-value Correlation p-value Correlation p-value
1988 0.101 0.767 0.130 0.703 (0.094) 0.783
1989 0.430 0.187 0.300 0.370 0.437 0.179
1990 0.295 0.407 0.154 0.671 0.400 0.252
1991 0.306 0.389 0.379 0.280 0.569 0.086
1992 0.520 0.101 0.547 0.082 0.714 0.014
1993 0.570 0.067 0.564 0.071 0.715 0.013
1994 0.048 0.894 (0.143) 0.694 (0.100) 0.783
1995 0.224 0.508 0.126 0.712 0.003 0.994
1996 (0.139) 0.685 (0.264) 0.433 (0.400) 0.223
1997 (0.401) 0.222 (0.458) 0.157 (0.562) 0.072
2000 2001 2002
Correlation p-value Correlation p-value Correlation p-value
1988 (0.060) 0.861 0.081 0.812 (0.071) 0.835
1989 0.432 0.185 0.623 0.041 0.463 0.152
1990 0.248 0.489 0.539 0.108 0.472 0.168
1991 0.527 0.117 0.836 0.003 0.773 0.009
1992 0.696 0.017 0.808 0.003 0.781 0.005
1993 0.544 0.083 0.787 0.004 0.768 0.006
1994 (0.125) 0.731 (0.196) 0.587 (0.174) 0.631
1995 (0.055) 0.872 (0.059) 0.863 (0.990) 0.772
1996 (0.472) 0.143 (0.449) 0.166 (0.492) 0.124
1997 (0.633) 0.037 (0.568) 0.068 (0.616) 0.044
2003 2004 2005
Correlation p-value Correlation p-value Correlation p-value
1988 0.029 0.932 0.049 0.885 0.179 0.599
1989 0.342 0.303 0.328 0.325 0.488 0.128
1990 0.248 0.490 0.178 0.622 0.481 0.159
1991 0.632 0.050 0.630 0.051 0.756 0.011
1992 0.739 0.009 0.642 0.033 0.778 0.005
1993 0.632 0.037 0.456 0.159 0.622 0.041
1994 (0.273) 0.445 (0.198) 0.584 (0.142) 0.696
1995 (0.180) 0.595 (1.900) 0.576 (0.200) 0.555
1996 (0.515) 0.105 (0.595) 0.054 (0.513) 0.107
1997 (0.615) 0.044 (0.658) 0.028 (0.628) 0.039
nitro-polycyclic aromatic hydrocarbons (HPAHs) are byproducts of incomplete combustion pro-cesses and vehicle exhaust that are found in high concentrations in PM, and which require meta-bolic activation to become electrophilic and exert their carcinogenic potential 24. Valavanidis et al. 25 emphasize that polycyclic aromatic
hydrocar-bons are highly mutagenic, with tumor-promot-ing activity, and responsible for the increased risk of malignant neoplasms, especially lung cancer. However, there is still uncertainty about the effect of PM pollution on lung cancer risk. Literature re-views suggest that the combustion related to PM air pollution can result in a small increase in the
risk of this type of cancer, but there are still gaps in the knowledge on these questions 2.
Gallus et al. 26 reviewed epidemiological
stud-ies on air pollution and cancer. The focus of the studies was the association between particulate matter and lung cancer. The association was not
clear, since there were persistent uncertainties on exposure measurement and latency.
Franco et al. 27 reviewed PAHs and human
health, discussing methodologies for the deter-mination of some biomarkers. PAHs are widely distributed in the environment due to the emis-Table 5
Correlation coeffi cients and p-values for lung cancer incidence (1997 to 2005) and inhalable particulate matter (PM10) (1988 to
1997), in selected districts in the city of São Paulo, Brazil.
PM10 1997 1998 1999
Correlation p-value Correlation p-value Correlation p-value
1988 0.064 0.853 (0.240) 0.476 (0.025) 0.942
1989 0.307 0.358 0.541 0.086 0.586 0.058
1990 0.110 0.762 0.410 0.239 0.320 0.367
1991 0.234 0.515 0.493 0.147 0.376 0.285
1992 0.383 0.245 0.542 0.085 0.505 0.113
1993 0.422 0.196 0.432 0.185 0.432 0.184
1994 0.139 0.701 0.249 0.488 0.280 0.434
1995 0.302 0.367 0.064 0.852 0.177 0.603
1996 (0.281) 0.402 (0.515) 0.105 (0.399) 0.224
1997 (0.571) 0.067 (0.760) 0.007 (0.682) 0.021
2000 2001 2002
Correlation p-value Correlation p-value Correlation p-value
1988 (0.073) 0.832 (0.313) 0.348 0.143 0.674
1989 0.751 0.008 0.501 0.117 0.640 0.034
1990 0.640 0.046 0.495 0.146 0.577 0.080
1991 0.563 0.090 0.615 0.058 0.849 0.002
1992 0.535 0.090 0.590 0.056 0.863 0.001
1993 0.502 0.116 0.392 0.233 0.680 0.021
1994 0.445 0.198 0.076 0.835 (0.269) 0.452
1995 0.334 0.315 (0.073) 0.830 (0.095) 0.780
1996 (0.254) 0.451 (0.447) 0.168 (0.205) 0.546
1997 (0.618) 0.043 (0.642) 0.033 (0.378) 0.252
2003 2004 2005
Correlation p-value Correlation p-value Correlation p-value
1988 (0.244) 0.469 (0.280) 0.404 (0.385) 0.242
1989 0.605 0.048 0.347 0.296 0.692 0.018
1990 0.556 0.095 0.339 0.338 0.790 0.006
1991 0.664 0.036 0.695 0.026 0.726 0.017
1992 0.815 0.002 0.660 0.027 0.646 0.032
1993 0.605 0.049 0.396 0.228 0.550 0.079
1994 (0.053) 0.885 (0.184) 0.611 0.148 0.683
1995 (0.119) 0.727 (0.384) 0.243 (0.148) 0.664
1996 (0.388) 0.239 (0.603) 0.050 (0.425) 0.193
1997 (0.572) 0.066 (0.549) 0.080 (0.543) 0.084
Figure 1
Number of occurrences with high correlations, according to monitoring period for inhalable particulate matter (PM10) and
incidence by type of cancer in the city of São Paulo, Brazil.
sions from gasoline and diesel engines, and some are carcinogenic, potentially acting on the skin and airway cells. Biomarkers are considered promising in the study of populations exposed to chemical contaminants.
Randem et al. 28 showed that workers directly
exposed to asphalt and tar in Denmark, Finland, Norway, and Sweden present evidence of in-creased risk of developing bladder cancer. They studied cancer incidence among 22,362 male workers for more than one work season involving exposure to tar (asphalt). The chemical agents that stand out in asphalt emissions are polycy-clic aromatic hydrocarbons. During paving work with asphalt, PAHs are adsorbed on the particu-late matter that is emitted, reaching the lungs all the way to the alveoli.
The impacts of PM pollution on human health remain to be fully elucidated, including an under-standing of the greatest risk or susceptibility to the event, the impacts of exposure to particulate mat-ter on infant mortality and birth outcomes, includ-ing fetal growth, prematurity, intrauterine mortal-ity, and birth defects, the effects of exposure on lung cancer risk, and the role of the various char-acteristics and components of particulate matter and the relative importance of the related sources of pollutants 29.
According to Danaei et al. 30, more than a
third of cancer deaths in the world can be attrib-uted to nine potentially modifiable risk factors (smoking, alcohol consumption, low consump-tion of fruit, vegetables, and greens, smoke from burning solid fuels in closed environments, ur-ban air pollution, physical inactivity, overweight and obesity, unprotected sex, and contaminated
injections in health units). In low and middle in-come countries, smoking accounts for an esti-mated 18% of cancer deaths, low consumption of fruit, vegetables, and greens for 6%, and alcohol consumption for 5%.
Analysis of the spatial distribution of the vari-ous types of cancer during the period showed than in some districts of São Paulo, the relative risk of mortality was higher than that of inci-dence, possibly indicating some deficiency in access to diagnosis and treatment. In addition, the radial-concentric pattern of relative risks in this scale of analysis may be related to the greater predominance of the younger population on the urban periphery.
Some study limitations should be considered. The principal difficulty in understanding chronic diseases derives from the long latency period. Since 1997, a considerable number of studies have dealt with the health effects of exposure to PM 29. Various cohort studies have highlighted
the evidence of long-term or chronic health ef-fects 29. In studies with an ecological design, the
data represent mean exposure levels rather than real individual levels. Controlling for confound-ers like smoking, alcoholism, and othconfound-ers was not possible due to the absence of this information in the databank. In addition, the population’s daily mobility, outdoor exposure time, and other im-portant variables cannot be considered in this type of study. The limited number of air quality monitoring stations in the city also prevents all the districts from being analyzed. Other impor-tant polluimpor-tants should also be investigated in fu-ture studies.
0 5 10 15 20
Events with high corr
elation
Skin
Lung
Larynx
Bladder
Thyroid
Figure 2
Relative risk maps for incidence and mortality rates for skin cancer. City of São Paulo, Brazil.
Conclusion
The study showed that urban PM10 air pollution
in the city of São Paulo was associated with inci-dence and mortality for some types of cancer. For incidence, the types of cancer that showed high correlations were: skin, lung, thyroid, larynx, and bladder. For mortality, lung cancer showed the largest number of high correlations during the period.
2.47 2.17 1.47 1.00 0.68 0.46 0.31 0.05 2.47
2.17 1.47 1.00 0.68 0.46 0.31 0.05
0 10 20 km
2b) Mortality
7,400 km N
7,360
330 350 km E
7,400 km N
7,360
330 350 km E
2a) Incidence
N
E W
S
São Paulo
Mortality rates for skin cancer (relative risk)
Skin cancer (relative risk)
Figure 3
Relative risk maps for incidence and mortality rates for lung cancer. City of São Paulo, Brazil.
N
E W
S
São Paulo
3b) Mortality
7,400 km N
7,360
330 350 km E
3a) Incidence
0 10 20 km
2.09 1.72 1.45 1.19 1.00 0.80 0.53 0.09 2.09
1.72 1.45 1.19 1.00 0.80 0.53 0.09 Lung cancer
(relative risk) Mortality rates for lung cancer(relative risk)
7,400 km N
7,360
Resumo
O trabalho teve como objetivo verificar a influência do poluente atmosférico material particulado inalável (MP10) na incidência e na mortalidade por câncer, no Município de São Paulo, Brasil. Foram utilizadas téc-nicas estatísticas para verificar a relação do MP10 sobre a incidência e a mortalidade de alguns tipos de cân-cer nos distritos onde são monitorados este poluente. Pele, pulmão, tireoide, laringe e bexiga apresentaram coeficientes de correlação estatística entre 0,60 e 0,80, em alguns períodos, para a incidência. Para a morta-lidade, o câncer de pulmão apresentou mais correla-ções nesse intervalo. A análise espacial mostrou que distritos distantes do centro da cidade apresentaram risco relativo acima do esperado. O estudo mostrou que o MP10 urbano pode contribuir para o aumento da incidência de alguns tipos de câncer e pode contri-buir também para o crescimento da mortalidade por esta causa. Os resultados indicam a necessidade de se adotar medidas que visem à redução da concentração desse poluente na atmosfera e, também, a importância do seu contínuo monitoramento.
Poluentes do Ar; Material Particulado; Neoplasias
Contributors
Y. Yanagi participated in the literature search, analyzed the data, and wrote the article. J. V. Assunção conceived the theme, coordinated the research, and revised the article. L. V. Barrozo collaborated in the analysis of the spatial distribution, elaboration of the maps, and wri-ting of the article.
References
1. Katsouyanni K, Pershagen G. Ambient air pollu-tion exposure and cancer. Cancer Causes Control 1997; 8:284-91.
2. Pope 3rd CA, Burnett RT, Thun MJ, Calle EE, Krewski D, Ito K, et al. Lung cancer, cardiopulmo-nary mortality, and long-term exposure to fine particulate air pollution. JAMA 2002; 287:1132-41. 3. Gouveia N, Mendonça GAS, Ponce de Leon A,
Cor-reia JEM, Junger WL, Freitas CU, et al. Poluição do ar e efeitos na saúde nas populações de duas gran-des metrópoles brasileiras. Epidemiol Serv Saúde 2003; 12:29-40.
4. Cendon S, Pereira LAA, Braga ALF, Conceição GMS, Cury Junior A, Romaldini H, et al. Air pollution ef-fects on myorcardial infarction. Rev Saúde Pública 2006; 40:414-9.
5. Hales S, Blakely T, Woodward A. Air pollution and mortality in New Zealand: cohort study. J Epide-miol Community Health 2010; 66:468-73. 6. Gouveia N, Fletcher T. Respiratory diseases in
7. Roseiro MNV. Morbidade por problemas respirató-rios em Ribeirão Preto – SP, de 1995 a 2001, segun-do indicasegun-dores ambientais, sociais e econômicos [Dissertação de Mestrado]. São Paulo: Escola de Enfermagem de Ribeirão Preto, Universidade de São Paulo ; 2002.
8. Junger WL, Ponce de Leon A, Azevedo G, Men-donça S. Associação entre mortalidade diária por câncer de pulmão e poluição do ar no município do Rio de Janeiro: um estudo ecológico de séries temporais. Rev Bras Cancerol 2005; 51:111-5. 9. Instituto Nacional de Câncer. A situação do
cân-cer no Brasil. Rio de Janeiro: Instituto Nacional de Câncer; 2006.
10. Pollock RE, Doroshow JH. Manual de oncologia clínica da UICC. São Paulo: Fundação Oncocentro de São Paulo; 2006.
11. Wunsch Filho V, Antunes JLF, Boing AF, Lorenzi RL. Perspectivas da investigação sobre determinantes sociais em câncer. Physis (Rio J.) 2008; 18:427-50. 12. Wanner HU. Effects of atmospheric pollution on
human health. Experientia 1993; 49:754-8. 13. Mirra AP, Latorre MRDO, Veneziano DB.
Mortali-dade por câncer no município de São Paulo, Brasil: 1997-2003. São Paulo: Registro de Câncer de São Paulo; 2007.
14. Instituto Nacional de Câncer. O que e o câncer? http://www1.inca.gov.br/conteudo_view.asp?id= 322 (accessed on 07/Apr/2008).
15. Kligerman J. Estimativas sobre a incidência e mor-talidade por câncer no Brasil – 2001. Rev Bras Can-cerol 2001; 47:111-4.
16. Medronho RA, Bloch KV, Werneck GL. Epidemiolo-gia. São Paulo: Editora Atheneu; 2006.
17. Bisquerra R, Martinez F, Sarriera JC. Introdução à estatística: enfoque informático com o pacote es-tatístico SPSS. Porto Alegre: Editora Artmed; 2004. 18. Martinelli M. Mapas da geografia e cartografia
te-mática. São Paulo: Editora Contexto; 2003. 19. Companhia de Tecnologia de Saneamento
Am-biental. Qualidade do ar no Estado de São Paulo 1997: relatório técnico. São Paulo: Companhia de Tecnologia de Saneamento Ambiental; 1998. 20. Centro Colaborador da OMS para a Classificação
de Doenças em Português/Fundação Oncocentro de São Paulo. Classificação internacional de doen-ças para oncologia. 3a Ed. São Paulo: Edusp; 2005.
21. Doll R, Peto R. The causes of cancer: quantitative estimates of avoidable risks of cancer in the United States today. J Natl Cancer Inst 1981; 66:1191-308. 22. Cangerana-Pereira FA, Assunção JV, Saldiva PH,
Pereira LAA, Mirra AP, Braga ALF. Influence of air pollution on the incidence of respiratory tract neo-plasm. J Air Waste Manag Assoc 2005; 55:83-7. 23. Pope 3rd CA. Mortality effects on longer term
ex-posures to fine particulate air pollution: review of recent epidemiological evidence. Inhal Toxicol 2007; 19 Suppl 1:33-8.
24. Cecinato A, Marino F, DiFilippo P, Lepore L, Pos-sanzini M. Distribution of n-alkanes, polynuclear aromatic hydrocarbons and nitrated polynuclear aromatic hydrocarbons between fine and coarse fractions of inhalable atmospheric particulate. J Chromatogr A 1999; 846:255-64.
25. Valavanidis A, Konstantinos F, Vlachogianni T. Air-borne particulate matter and human health: toxi-cological assessment and importance of size and composition of particles for oxidative damage and carcinogenic mechanisms. J Environ Sci Health C Environ Carcinog Ecotoxicol Rev 2008; 26:339-62. 26. Gallus S, Negri E, Boffetta P, McLaughlin JK, Bosetti
C, La Vecchia C. European studies on long-term exposure to ambient particulate matter and lung cancer. Eur J Cancer Prev 2008; 17:191-4.
27. Franco SS, Nardocci AC, Günther WM R. PAH biomarkers for human health risk assessment: a review of the state-of-the-art. Cad Saúde Pública 2008; 24 Suppl 4:S569-80.
28. Randem BG, Burstyn I, Langards S, Jarvholm B, Kauppinen T, Bergdahl IA, et al. Cancer incidence of Nordic asphalt workers. Scand J Work Environ Health 2004; 30:350-5.
29. Pope 3rd CA, Dockery DW. Effects of fine particu-late air pollution: lines that connect. J Air Waste Manage Assoc 2006; 56:709-32.
30. Danaei G, Hoorn SV, Lopez AD, Murray CJL, Ezzati M. Causes of cancer in the world: comparative risk assessment of nine behavioral and environmental risk factors. Lancet 2005; 366:1784-93.
Submitted on 20/Jul/2011