Causes of morphological discontinuities in soils
of Depressão Central, Rio Grande do Sul State, Brazil
Cristiane Regina Michelon
1; Antonio Carlos de Azevedo
2*; Fabrício de Araújo Pedron
3;
Ricardo Simão Diniz Dalmolin
3; Sidinei Klochnner Stürmmer
1; Juliana Gonçalves
1; Sérgio
Luis de Jesus
41
UFSM – Programa de Pós-Graduação em Ciência do Solo, Av. Roraima, 1000 – 97105-900 – Santa Maria, RS – Brasil.
2
USP/ESALQ – Depto. de Ciência do Solo, C.P. 9 – 13418-900 – Piracicaba, SP – Brasil. 3
UFSM – Depto. de Solos. 4
USP/ESALQ/NUPEGEL, Alameda das Sibipirunas, 44. *Corresponding author <aazevedo@usp.br>
ABSTRACT: Morphological, particularly textural, discontinuities between horizons increase soil erodibility in Depressão Central, Rio Grande do Sul State (Brazil). Characterization of such discontinuities would help to understand landscape evolution and to model near-surface hydrology. The objective of this research was to explore the relationship between morphological discontinuity and deposition of transported materials during pedogenesis. Transported material was meant to be mineral particles found in the soil profile, transported probably by water or gravity, that were not present neither in the parent material nor derived from it. Five soils of this region (two Alfisols, two Ultisols and one Mollisol) were sampled and morphological, sand grain size statistics, chemical and mineralogical analyses were used to search for evidences of deposition of transported materials. Two soils had abrupt textural change but no evidence of deposition of transported materials, two soils had less contrasting morphology and some characteristics that are possibly related to deposition, and one soil had no morphological discontinuity, but had deposition of material enriched in magnetite-maghemite in the sand fraction of the A horizon. Therefore, there were no relationship between morphological discontinuity and deposition of transported materials for these profiles in the Depressão Central.
Key words: soil morphology, subtropical soils, soil discontinuity
Causas das descontinuidades morfológicas em solos
da Depressão Central, Rio Grande do Sul, Brasil
RESUMO: Contrastes morfológicos entre horizontes, e particularmente os contrastes texturais, aumentam a erodibilidade do solo na Depressão Central do Rio Grande do Sul (Brasil). A caracterização destes contrastes contribui para a compreensão da evolução da paisagem e para a modelagem da hidrologia de superfície. Cinco solos desta região foram amostrados e a morfologia, distribuição do tamanho de grãos da fração areia, análises químicas e mineralógicas foram usadas para tentativamente relacionar o contraste textural e morfológico com materiais transportados durante a pedogênese. Por materiais transportados entendem-se as partículas minerais presentes no perfil do solo, transportadas provavelmente por água ou gravidade, e que não estavam presentes nem no material de origem e nem foram derivadas deste. Dois solos apresentaram mudança textural abrupta sem evidências de deposição, dois solos apresentaram menor contraste morfológico e evidências que sustentam a possibilidade de deposição e um solo não apresentou contraste morfológico, porém as características indicam deposição de material rico em magnetita-maghemita na fração areia do horizonte A. Portanto, não foi encontrada relação entre descontinuidades morfológicas e deposição de materiais transportados, na Depressão Central. Palavras-chave: morfologia do solo, solos subtropicais, descontinuidades pedogenéticas
Introduction
Morphological discontinuities in soils usually relate to contrasts in characteristics such as texture, color, po-rosity and mineralogy, which affect soil dynamics (Stiles et al., 2003). In highly weathered, polygenetic soils, it is frequently difficult to identify deposited material based solely on morphological discontinuities, because they can have multiple, concurrent origins (pedogenetic, geo-logical and/ or geomorphogeo-logical, for example) (Muggler et al., 2007; Phillips and Lorz, 2008). Northcote (1971)
vari-the soils (Luz et al., 1992; Alves and Ribeiro, 1995; Furian et al., 1999), vertical and lateral translocation of clay (Jimenez Rueda and Dematte, 1988) and clay dissolution (Almeida et al., 1997; Schaefer et al., 2002; Simas et al., 2005). In the Coastal Plain of Rio Grande do Sul State, Almeida et al. (1997) concluded that the abrupt textural change in an Albaqualf was related to clay dissolution by ferrolysis. Soils in the Depressão Central are mainly Alfisols and Ultisols with , moderately coarse-or medium-textured A and/coarse-or E hcoarse-orizons over clayey B horizons (Brasil, 1973; USDA, 1993; USDA-NRCS, 1999). Present day expansion of urban areas and land use change from pasture to agriculture increase overuse of soil resources, demanding efforts to better characterize soils in Depressão Central (Pierini et al., 2002; de Melo and Cuchierato, 2004; Fabbrin Pires et al., 2005; Jasper et al., 2006).
Identification of deposited material is a difficult task because materials transported within short distances tend to be similar to those in the deposition site. In ad-dition, the weathering and pedogenetic processes can level out differences that would allow recognition of dif-ferent materials. Several techniques have been used to detect transported materials in soils. Among the most efficient ones is the use of isotopes which greatly im-proved the study of soil production function (Heimsath et al., 1997; Heimsath et al., 2000) and evolution of weath-ering profiles (Dosseto et al., 2008), but such technique is less accessible in developing countries.
The Depressão Central region is a plain, lowland area, used for almost a century mainly for crops of paddy rice, because its abundance of water and nearly plain topography make easier to control the water level on
ship between morphological discontinuity and deposi-tion of materials in five soils from Depressão Central, Rio Grande do Sul, Brasil.
Material and Methods
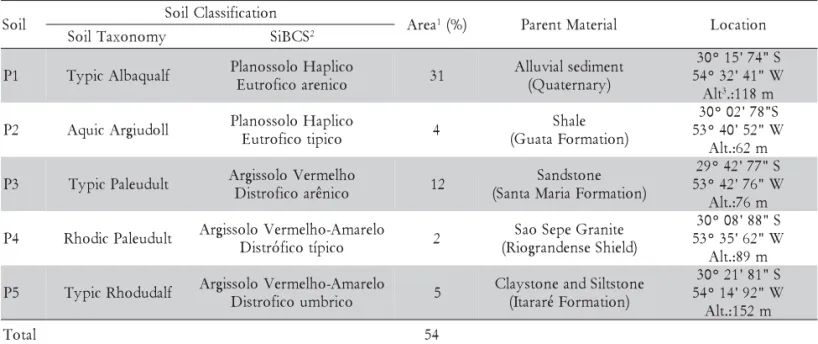
The soils sampled are representative of the Depressão Central region (Figure 1 and Table 1). Only the P4 soil was not developed from sedimentary parent material (Figure 2). Climate in the region is Cfa (sub-tropical without dry season) in the Köppen System (Brasil, 1973). The mean temperature of the warmest month (January) is greater than 22°C and of the coldest month (June) is between 3 and 18°C. Annual
precipita-Figure 1 – Location of Parana Basin and Depressão Central. Line from A to B: transect shown in Figure 2. (Based in IBGE, 1986).
l i o
S SoilClassification Area1(%) ParentMaterial Location
y m o n o x a T l i o
S SiBCS2
1
P TypicAlbaqualf PlanossoloHaplico o c i n e r a o c i f o r t u
E 31
t n e m i d e s l a i v u l l A ) y r a n r e t a u Q ( S " 4 7 ' 5 1 ° 0 3 W " 1 4 ' 2 3 ° 4 5 t l A 3:.118m
2
P AquicArgiudoll PlanossoloHaplico o c i p i t o c i f o r t u E 4 e l a h S ) n o i t a m r o F a t a u G ( 0
3 °02'78"S 3
5 °40'52"W m 2 6 :. t l A 3
P TypicPaleudult ArgissoloVermelho o c i n ê r a o c i f o r t s i
D 12
e n o t s d n a S ) n o i t a m r o F a i r a M a t n a S ( 9
2 °42'77"S 3
5 °42'76"W m 6 7 :. t l A 4
P RhodicPaleudult ArgissoloVermelho-Amarelo o c i p í t o c i f ó r t s i D 2 e t i n a r G e p e S o a S ) d l e i h S e s n e d n a r g o i R ( 0
3 °08'88"S 3
5 °35'62"W m 9 8 :. t l A 5
P TypicRhodudalf ArgissoloVermelho-Amarelo o c i r b m u o c i f o r t s i D 5 e n o t s t l i S d n a e n o t s y a l C ) n o i t a m r o F é r a r a t I ( S " 1 8 ' 1 2 ° 0 3 W " 2 9 ' 4 1 ° 4 5 m 2 5 1 :. t l A l a t o
T 54
Table 1 - Classification, area and parent material of the studied profiles (Based on IBGE, 1986).
tion varies from 1400 to 1600 mm. Excess water averages 750 mm yr–1. Landscapes in Depressão Central region are dominantly at level or gently undulated (Figure 3).
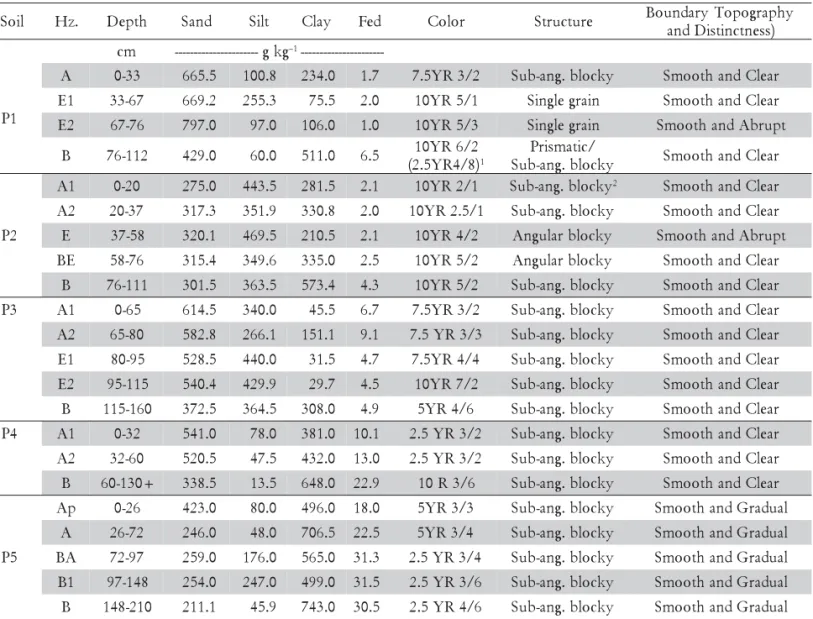
Soil and parent material were sampled and described with particular attention to color, structure, texture, and topography and distinctness of the boundary between horizons (USDA, 1993). Core samples were also col-lected with steel rings to measure bulk density (Blake and Hartge, 1986). Particle size analysis was done by pi-pette method after dispersion with 0.1 M NaOH and shake for 6 h (EMBRAPA, 1997) without prior elimina-tion of organic matter and iron oxides. Sand size par-ticles (from 2.0 to 0.05 mm) were obtained by wet siev-ing after dispersion. Sand mass distribution among five size subclasses: 2000 to 1700 micrometers (μm); 1700 to 850 μm; 850 to 425 μm; 425 to 212 μm; 212 to 106 μm; and 106 to 53 μm, was obtained by dry sieving. Sand grain size statistics (Table 3) were calculated using the GSSTAT algorithm (Poppe et al., 2004). To run GSSTAT, grain diameter classes were converted from millimeters (dmm) to phi scale (phi = -log2 dmm) and calculated by:
Median= phi50 (eq.1);
Graphic Mean =(phi16 + phi50 + phi84) / 3 (eq.2); Std. Deviation = [(phi84 – phi16) / 4] + [(phi95 – phi5) /6.6]
(eq.3); Skeweness ={[(phi16 + phi84) – (2 x phi50)] / [2 x (phi84 – phi16)]} + {[(phi5 + phi95) – (2 x phi50)] / [2 x (phi95 – phi5)]}
(eq.4); Kurtosis = (phi95 – phi84) / [2.44 x (phi75 – phi25)] (eq.5).
In the equations 1 to 5 (Poppe et al., 2004), phin is the grain size (phi scale) in a cumulative curve that accu-mulates the “n” % of sand mass.
A first approach to identify deposited material us-ing total element analysis was done based on the ISOCON method (Grant, 2005), considering the mass of
parent material and soil as constant during the alter-ation. This assumption is reasonable for the profiles de-veloped from sedimentary parent material (P1, P2, P3 and P5) since most of the easy weatherable minerals are absent or rare in their composition. Because of that, changes in volume are usually more expressive than change in mass. Based on this assumption, the ratio Ri Figure 2 – Geological setting of the transect shown in Figure 1
and sampling sites in Depressão Central. (Based in IBGE, 1986).
1mottles. 2Sub-ang. Blocky = Sub-angular blocky.
1 P
A 0-33 665.5 100.8 234.0 1.7 7.5YR3/2 Sub-ang.blocky SmoothandClear 1
E 33-67 669.2 255.3 75.5 2.0 10YR5/1 Singlegrain SmoothandClear
2
E 67-76 797.0 97.0 106.0 1.0 10YR5/3 Singlegrain SmoothandAbrupt
B 76-112 429.0 60.0 511.0 6.5 10YR6/2
) 8 / 4 R Y 5 . 2
( 1
/ c i t a m s i r P
y k c o l b . g n a -b u
S SmoothandClear
2 P
1
A 0-20 275.0 443.5 281.5 2.1 10YR2/1 Sub-ang.blocky2 SmoothandClear 2
A 20-37 317.3 351.9 330.8 2.0 10YR2.5/1 Sub-ang.blocky SmoothandClear E 37-58 320.1 469.5 210.5 2.1 10YR4/2 Angularblocky SmoothandAbrupt
E
B 58-76 315.4 349.6 335.0 2.5 10YR5/2 Angularblocky SmoothandClear B 76-111 301.5 363.5 573.4 4.3 10YR5/2 Sub-ang.blocky SmoothandClear 3
P A1 0-65 614.5 340.0 45.5 6.7 7.5YR3/2 Sub-ang.blocky SmoothandClear
2
A 65-80 582.8 266.1 151.1 9.1 7.5YR3/3 Sub-ang.blocky SmoothandClear 1
E 80-95 528.5 440.0 31.5 4.7 7.5YR4/4 Sub-ang.blocky SmoothandClear 2
E 95-115 540.4 429.9 29.7 4.5 10YR7/2 Sub-ang.blocky SmoothandClear B 115-160 372.5 364.5 308.0 4.9 5YR4/6 Sub-ang.blocky SmoothandClear 4
P A1 0-32 541.0 78.0 381.0 10.1 2.5YR3/2 Sub-ang.blocky SmoothandClear 2
A 32-60 520.5 47.5 432.0 13.0 2.5YR3/2 Sub-ang.blocky SmoothandClear B 60-130+ 338.5 13.5 648.0 22.9 10R3/6 Sub-ang.blocky SmoothandClear
5 P
p
A 0-26 423.0 80.0 496.0 18.0 5YR3/3 Sub-ang.blocky SmoothandGradual A 26-72 246.0 48.0 706.5 22.5 5YR3/4 Sub-ang.blocky SmoothandGradual
A
B 72-97 259.0 176.0 565.0 31.3 2.5YR3/4 Sub-ang.blocky SmoothandGradual 1
B 97-148 254.0 247.0 499.0 31.5 2.5YR3/6 Sub-ang.blocky SmoothandGradual B 148-210 211.1 45.9 743.0 30.5 2.5YR4/6 Sub-ang.blocky SmoothandGradual
Table 3 – Sand grain size statistics and interpretation.
*Classification according to Poppe et al., 2004 (n = 3). Standard Deviation: MWS = Moderately Well Sorted; PS = Poorly Sorted; MS = Moderately Sorted; Skewness: NS = Near Symmetrical; FS = Fine Skewed; CS = Coarse skewed. Kurtosis: L = Leptokurtic; M = Mesokurtic; P = Platykurtic.
e l i f o r
P Horizon Median GraphicMean StandardDeviation Skewness Kurtosis CoefficientofVariation(%)
1 P
A 0.54 0.55 0.68(MWS)* 0.01(NS) 1.20(L) 0.34 2
E 0.55 0.57 0.67(MWS) 0.00(NS) 1.18(L) 1.05
B 0.54 0.55 0.68(MWS) 0.00(NS) 1.19(L) 1.10
2 P
1
A 0.67 0.69 1.11(PS) 0.13(FS) 1.07(M) 0.20
E 0.76 0.77 1.13(PS) 0.11(FS) 1.10(M) 0.69
B 0.63 0.67 1.10(PS) 0.15(FS) 1.10(M) 1.29
3 P
1
A 0.84 0.90 1.11(PS) 0.16(FS) 1.17(L) 0.59
1
E 0.61 0.62 0.80(MS) 0.01(NS) 1.01(M) 1.25
B 0.96 0.86 0.78(MS) 0.22(CS) 0.96(M) 1.33
4
P A2 1.56 1.60 1.28(PS) 0.02(NS) 1.08(M) 2.43
B 2.11 2.03 1.47(PS) 0.14(CS) 0.80(P) 3.32
5
P A 0.96 0.82 0.99(MS) 0.15(CS) 0.88(P) 2.60
was defined as: Ri= MiA / M
i
0 (eq.6)
MiA is the mass of element i in the altered material (soil) and Mi0 in the parent material (Table 4). Among the chemical elements determined by the XRF tech-nique, Ti is mainly found in mineral particles more re-sistant to weathering and in the coarse size class, such as titanomagnetite, anatase and rutile. Therefore, profiles with variation in RTi in the range 1 ± 0.25 among the soil horizons and parent material were selected as those with smaller probability to have transported material contribution to its genesis, and had then their chemical balance calculated (Table 5).
The chemical mass balance was calculated using the FLUX algorithm (Biddle et al., 1998), based on the total element content in samples, and assuming titanium (Ti) as immobile element during the profile development. Mass balance was calculated for Al, Fe, Ca and Mg.
Total content of Si, Al, Fe, Ti, Ca and Mg in samples was determined by X-ray fluorescence (XRF) using a Philips PW2400 equipment, according to the procedures described in Mori et al. (1999). Mineral phases were iden-tified by X-ray diffraction (XRD), in a Phillips PW diffractometer with copper anode (Cu Ka) and Ni filter operated at 40 kV and 40 mA, at 1.2 two theta degrees per minute. Sample preparation followed procedures described in Whittig and Allardice (1986).
Table 4 – Total elemental concentration, Ri and Fed / Fet ratio for selected horizons.
1PM: Parent Material. 2R
i is the ratio of concentration of element “i” between soil horizons and parent material (see text). l
i o
S Hz. ElementalAnalysis(XRF) R i 2
e F d/Fet O
i
S 2 Al2O3 Fe2O3 TiO2 CaO MgO RAl RFe RTi
--% --1
P A 86.97 5.05 1.36 0.645 0.12 0.20 0.40 0.40 0.81 0.18 2
E 91.31 3.25 0.79 0.849 0.10 0.09 0.26 0.23 1.06 0.17 B 69.70 15.17 4.58 0.836 0.34 0.57 1.20 1.36 1.05 0.20 M
P 1 80.04 12.68 3.38 0.798 0.47 0.83 0.04 2
P A1 86.51 5.00 1.27 0.848 0.15 0.18 0.38 0.30 1.18 0.23 E 89.90 3.85 0.98 0.904 0.12 0.13 0.29 0.23 1.26 0.31 B 86.00 6.22 1.73 0.817 0.19 0.24 0.47 0.40 1.14 0.36
M
P 85.17 13.21 4.30 0.719 1.49 1.27 0.41 3
P A1 91.35 2.51 1.64 1.331 0.02 0.09 0.17 0.29 1.08 0.58 1
E 78.91 7.13 7.74 1.296 0.02 0.17 0.49 1.39 1.06 0.09 B 73.90 13.30 3.79 0.679 0.38 0.60 0.90 0.68 0.55 0.76
M
P 68.43 19.30 6.98 1.199 0.06 0.26 0.22 4
P A2 74.33 12.68 3.73 1.021 0.06 0.18 0.54 1.12 4.07 0.50 B 62.31 20.76 5.83 0.893 0.06 0.26 0.89 1.76 3.56 0.56
M
P 58.60 23.39 3.32 0.251 0.15 0.07 0.25 5
P A 63.47 19.46 6.38 1.454 0.02 0.15 4.71 2.86 1.15 0.50 B 92.00 2.50 1.65 1.337 0.02 0.11 0.61 0.74 1.05 2.64
M
P 87.48 4.13 2.23 1.269 0.03 0.13 1.50
1Negative numbers indicate percent loss as compared to parent material, after corrected for strain. Positive numbers indicate gain.
Table 5 – Elemental mass balance of P1, P2 and P5 profiles.
l i o
S Horizon Al Fe Ca Mg
-%
-1 P
A -26.811 -35.11 -48.89 -42.32 2
E -40.12 -54.57 -57.17 -54.15
B 7.50 20.52 -22.11 -20.76
2 P
1
A -35.89 -52.42 -65.36 -53.05 1
E -40.60 -57.26 -66.88 -55.39 B -30.95 -45.17 -63.44 -50.27
5
P A2 164.53 104.69 -29.88 0.42
B -22.48 -20.82 -26.24 -11.86
Iron in pedogenetic, secondary oxides (Fed) was de-termined after reduction with sodium dithionite in a water bath (80°C) using citrate as complexing agent and bicarbonate as a buffer, as described in Mehra and Jack-son (1960).
Results and Discussion
Col-type phyllosilicates (inherited from the parent material) resulted in darker color due to greater amount of organic matter content, typical of Mollisols. Comparing the E2 and A2 horizons to the B horizon of the P3 (Typic Paleudult) and P4 (Rhodic Paleudult) soils, it was ob-served a strong decrease in sand and increase in clay con-tent, parallel to a change in color. The greater amount of iron oxides in the P4 soil, mostly formed by weather-ing of biotite from the granite parent material, resulted in redder hues that placed this profile in the Rhodic sub-group of Paleudults.
In the P5 soil (Typic Rhodudalf), change in sand grain size statistics may be related to deposition of ma-terials, because pedogenetic processes, in general, do not move sand particles (Birkeland, 1999; USDA-NRCS, 1999; USDA, 1993). However, that characteristic can not be used as an unequivocal evidence of material deposi-tion, since it also may be result of differential weather-ing of grains with diverse mineralogy and/or bioturbation.
The sand grain size statistics (Table 3) resulted in medians very close to the graphic mean, because all samples had small standard deviation, skewness and kur-tosis. It may be related to the grain sorting during the geologic event that deposited the sedimentary parent materials of these soils. The P4 soil is an exception be-cause it was developed from granite, resulting in medi-ans greater than 1.
In spite of morphological discontinuity among ho-rizons, the P1 and P2 soils did not have variation in sand statistics among horizons. In the P3 soil, the E1 and B had similar statistics, but the A horizon had fine sand enough to change the classification of standard de-viation (from poorly sorted to moderately sorted), skew-ness (from fine skewed to nearly symmetrical) and kur-tosis (from leptokurtic to mesokurtic). In the P4 soil, the sand distribution in the B horizon was platykurtic and coarse skewed, while in the A2 was near symmetri-cal and mesokurtic. Therefore, the A2 horizon had more fine sand than the B horizon. In the P5 soil, the platykurtic kurtosis indicates a wide range of grain size distribution in both the A and B horizons, but skew-ness indicate increase of coarse sand fraction in the A horizon.
Variations in sand statistics in P3, P4 and P5 soils may relate to deposition of transported material. How-ever, while the decrease of sand grain size towards the soil surface, observed in the P3 and P4 soils, could be related to the more intense weathering, the occurrence of such mechanism is less supported by the greater amount of coarse sand in surface of the P5 soil, and as the total element and mineralogical results suggest, should be more likely related to deposition of trans-ported material.
phyllosilicate clays in the B horizons of the P1, P2 and P4 soils (Table 2 and Table 4), and the depletion in the E horizon, since gibbsite was not detected by XRD.
In the P3 soil, the high RFe in the E1 horizon (1.39) was the result of Fe-bearing minerals in sand fraction, since secondary Fe oxides (Fed) were concentrated in the A horizon (Table 2). The small RTi in the B horizon is another characteristic that adds to the possibility to ma-terial deposition in this soil; in P5, the opposite pattern was observed, i. e., the ratio was more than seven times greater in the A horizon as compared with the B hori-zon. In the P4 soil, RFe was greater in the B horizon and was related to secondary, clay sized Fe oxides (Fed) accu-mulation (Table 2). Different from geologic materials un-derlying the other profiles, the igneous nature of the ma-terial of P4 soil implies that a portion of the original rock mass was lost by dissolution during weathering, therefore residually concentrating Ti-bearing, resistant minerals. Such mechanism is not common in sedimentary rocks, frequently made of pre-weathered materials. This is pos-sibly the reason why the largest RTi was found in P4 soil.
The P5 soil had, as the P1 and P2, a RTiclose to 1, but the RFe and RAl were much greater in the A than in B horizon, suggesting deposition of materials in the P5 soil surface. A hypothesis can be proposed regarding the deposition of materials at the surface of the P5 profile. The sand grain size statistics (Table 3) showed that coarse sand sized material was possibly added to the A horizon. Because RFe and RAl showed an increase (Table 4) not followed by the Fed (Table 2), this material should be enriched in primary Fe and Al bearing minerals. Also, the primary mineral(s) would not be Ilmenite (FeTiO3), found in the sand fraction of P5 soil, because it contains Ti and would affect the RTi (Table 4).
P1, P2 and P5 profiles had the RTi within the 1 ± 0.25, therefore the mass balance of Al, Fe, Ca and Mg was calculated for these profiles (Table 5) using Ti as the index element to correct for strain due to weathering and pedogenesis. In the P5 soil, there was an increase of Al and Fe in the A horizon greater than the amount expected if the concentrations in parent material would be maintained, that is, if there were no loss during pedogenesis. Concurrently, loss of these ele-ments from the A horizon of the other soils were from 20 to 50%. Such results agree with the hypothesis that some material could be deposited on the A horizon. The deposited material could result from erosion from C horizon of a similar soil upslope nearby (con-sidering the paleolandscape, because at present day the slope is gentle, Figure 3), and is probably related to the geomorphologic evolution of the site. An alter-native hypothesis is that selective biological activity would transport magnetite-maghemite from the C ho-rizon towards the A hoho-rizon throughout the profile. However, the lack of morphological evidence of bioturbation in the profile weakens this alternative hypothesis.
The chemical mass balance for P1 and P2 soils in-dicated that these soils had the greatest loss of Al, Fe, Ca and Mg from the E horizon, and smallest loss, or even gain, in the B horizon, as would be expected if one assumes the greater amount of clay in the B hori-zon as the result of translocation. The B horihori-zon of P1 soil had a large increase in Fe, in agreement to the presence of mottles (Table 1), adding to the idea that the abrupt boundary in the P1 soil had pedogenetic origin.
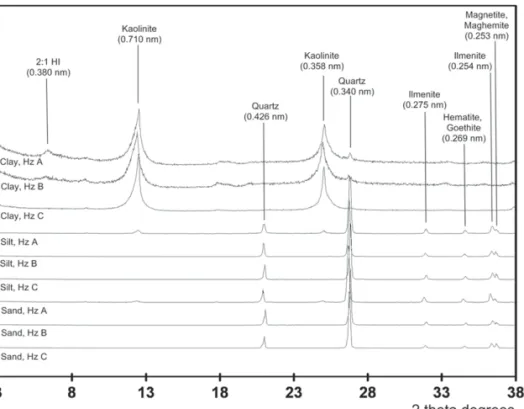
Figure 4 – X-ray diffractogram of sand, silt and clay (deferrified, Mg-saturated) fractions of A, B and C horizons, P5 soil. 2:1 HI: Hydroxy Interlayered 2:1 phyllosilicate.
The Depressão Central region is a plain, lowland area, used for almost a century mainly for crops of paddy rice, because its abundance of water and nearly plain topography make easier to control the water level on the crop fields. Natural or human-controlled floods may cause deposition of transported materials.
Conclusions
Morphological and textural discontinuities were not caused by the deposition of transported materials on top of the profiles in the course of pedogenesis. The less contrasting soils were those with higher possibil-ity of the presence of deposited materials in their com-position. The methods of soil and parent material analyses were all useful but for further investigations, they should be chosen based on the type of parent ma-terial. Soils derived from sandstones and sediments, besides the grain size characterization, should take ad-vantage of grain morphology and mineralogy. Analy-sis of soils derived from parent material with Fe bear-ing minerals should take advantage of selective disso-lution and, if possible, magnetic methods. The use of XRF was also useful but very expensive as compared with the other techniques.
Acknowledgements
Brasileira de Ciência do Solo 21: 221-233. (in Portuguese, with abstract in English).
Alves, A.J.O.; Ribeiro, M.R. 1995. Characterization and genesis of the soils of a toposequence in the dry forest area of Pernambuco State, Brazil. Revista Brasileira de Ciência do Solo 19: 297-305. (in Portuguese, with abstract in English).
Biddle, D.L.; Chittleborough, D.J.; Fitzpatrick, R.W. 1998. An algorithm to model mass balances quantitatively. Computers & Geosciences 24: 77-82.
Birkeland, P.W. 1999. Soils and Geomorphology. Oxford University Press, New York, NY, USA.
Blake, G.R.; Hartge, K.H. 1986. Bulk density. p. 363-375. In: Klute, A., ed. Methods of soil analysis Part 1: Physical and mineralogical methods. American Society of Agronomy and Soil Science Society of America, Madison, WI, USA. Brasil. Ministério da Agricultura 1973. Soil Survey of Rio Grande
do Sul. Serviço Nacional de Levantamento e Conservação de Solos, Recife, PE, Brazil. (in Portuguese).
Chittleborough, D.J. 1992. Formation and pedology of duplex soils. Australian Journal of Experimental Agriculture 32: 815-825. De Melo, M.S.; Cuchierato, G. 2004. Quaternary colluvial-eluvial
covers of the Eastern Parana Basin, Southeastern Brazil: advances in the quaternary of the Del Plata river basin. Quaternary International 114: 45-53.
Dosseto, A.; Turner, S.P.; Chappell, J. 2008. The evolution of weathering profiles through time: new insights from uranium-series isotopes. Earth and Planetary Science Letters 274: 359-371. Empresa Brasileira de Pesquisa Agropecuária [EMBRAPA]. 1997. Manual of Methods of Soil Analysis. EMBRAPA, Rio de Janeiro, RJ, Brazil. (in Portuguese).
Fabbrin Pires, E.; Guerra-Sommer, M.; Scherer, C.M.S. 2005. Late Triassic climate in Southernmost Parana Basin (Brazil): evidence from dendrochronological data. Journal of South American Earth Sciences 18: 213-221.
Furian, S.; Barbiero, L.; Boulet, R. 1999. Organization of the soil mantle in tropical Southeastern Brazil (Serra do Mar) in relation to landslides processes. Catena 38: 65-83.
Grant, J.A. 2005. Isocon analysis: a brief review of the method and applications. Physics and Chemistry of the Earth 30: 997-1004. Heimsath, A.M.; Dietrich, W.E.; Nishiizumi, K.; Finkel, R.C. 1997. The soil production function and landscape equilibrium. Nature 388: 358-361.
Heimsath, A.M.; Chappell, J.; Dietrich, W.E.; Nishiizumi, K., Finkel, R.C. 2000. Soil production on a retreating escarpment in Southeastern Australia. Geology 28: 787-790.
Instituto Brasileiro de Geografia e Estatística [IBGE]. 1986. Survey of Natural Resources. RADAMBRASIL Project. Sheets SH.22, SH.21 and SI.22: Geology, Geomorphology, Vegetation, Potential Land Use. v.33. IBGE, Rio de Janeiro, RJ, Brazil. (in Portuguese).
Jasper, A.; Menegat, R.; Guerra-Sommer, M.; Cazzulo-Klepzig, M.; De Souza, P.A. 2006. Depositional cyclicity and paleoecological variability in an outcrop of Rio Bonito formation, Early Permian, Parana Basin, Rio Grande do Sul, Brazil. Journal of South American Earth Sciences 21: 276-293. Jimenez Rueda, J.R.; Dematte, J.L.I. 1988. Soils developed from
Marilia Formation (Bauru Group) from Monte Alto Region, Sao Paulo State, Brazil. Revista Brasileira de Ciência do Solo 12: 161-170. (in Portuguese, with abstract in English).
in a toposequence of the semiarid region, Pernambuco State, Brazil. Revista Brasileira de Ciência do Solo 16: 95-102. (in Portuguese, with abstract in English).
Mehra, O.P.; Jackson, M.L. 1960. Iron oxide removal from soils and clays by dithionite citrate systems buffered with sodium bicarbonate. Clays and Clay Minerals 7: 317-327.
Mori, P.E.; Reeves, S.; Correia, C.T.; Haunakka, M. 1999. Development of a fused glass disc XRF facility and comparison with the pressed pellet technique at Instituto de Geociências, University of São Paulo. Revista Brasileira de Geociências 29: 441-446.
Muggler, C.C.; Buurman, P.; van Doesburg, J.D.J. 2007. Weathering trends and parent material characteristics of polygenetic Oxisols from Minas Gerais, Brazil: I. Mineralogy. Geoderma 138: 39-48. Northcote, K.H. 1971. A Factual Key for the Recognition of
Australian Soils. Rellim Technical, Glenside, Australia. Phillips, J.D. 2004. Geogenesis, pedogenesis, and multiple causality
in the formation of texture-contrast soils. Catena 58: 275-295. Phillips. J.D.; Lorz, C. 2008. Origins and implications of soil
layering. Earth-Science Reviews 89: 144-155.
Pierini, C.; Mizusaki, A.M.P.; Scherer, C.M.S.; Alves, D.B. 2002. Integrated stratigraphic and geochemical study of the Santa Maria and Caturrita formations (Triassic of the Parana Basin), Southern Brazil. Journal of South American Earth Sciences 15: 669-681.
Poppe, L.J.; Eliason, A.H.; Hastings, M.E. 2004. A Visual Basic program to generate sediment grain-size statistics and to extrapolate particle distributions. Computers & Geosciences 30: 791-795.
Schaefer, C.E.R.; Ker, J.C.; Gilkes, R.J.; Campos, J.C.; Da Costa, L.M.; Saadi, A. 2002. Pedogenesis on the uplands of the Diamantina Plateau, Minas Gerais, Brazil: a chemical and micropedological study. Geoderma 107: 243-269.
Simas, F.N.B.; Schaefer, C.E.G.R.; Fernandes Filho, E.I.; Chagas, A.C.; Brandao, P.C. 2005. Chemistry, mineralogy and micropedology of highland soils on crystalline rocks of Serra da Mantiqueira, Southeastern Brazil. Geoderma 125: 187-201. Stiles, C.A.; Mora, C.I.; Driese, S.G. 2003. Pedogenic processes
and domain boundaries in a Vertisol climosequence: evidence from titanium and zirconium distribution and morphology. Geoderma 116: 279-299.
United States Department of Agriculture [USDA]. 1993. Soil Survey Manual. USDA, Washington, D.C., USA.
United States Department of Agriculture [USDA-NRCS]. 1999. Soil Taxonomy: A Basic System of Soil Classification for Making and Interpreting Soil Surveys. USDA-NRCS, Washington, D.C., USA.
Whittig, L.D.; Allardice, W.R. 1986. X-ray diffraction techniques. p. 331-362. In: Klute, A., ed. Methods of soil analysis. Part 1: Physical and mineralogical methods. American Society of Agronomy and Soil Science Society of America, Madison, WI, USA.