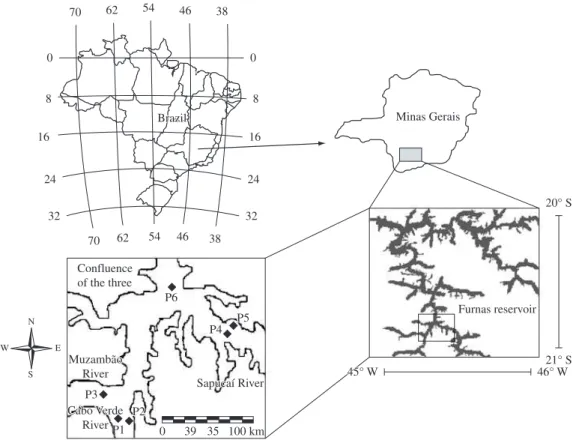
Furnas Reservoir, Minas Gerais, Brazil
Santos, RM.
a*, Negreiros, NF.
a, Silva, LC.
a, Rocha, O.
band Santos-Wisniewski, MJ.
c aPós-graduação em Ecologia e Recursos Naturais, Universidade Federal de São Carlos – UFSCar,Rod. Washington Luis, Km 235, CP 676, CEP 13565-905, São Carlos, SP, Brazil
bDepartamento de Ecologia e Biologia Evolutiva – DEBE, Universidade Federal de São Carlos – UFSCar, Rod. Washington Luis, Km 235, CP 676, CEP 13565-905, São Carlos, SP, Brazil
cDepartamento de Biologia, Universidade Federal de Alfenas – UNIFAL, Rua Gabriel Monteiro da Silva, 714, CEP 37130-000, Alfenas, MG, Brazil
*e-mail: renata_cordis@yahoo.com.br
Received October 5, 2009 – Accepted December 28, 2009 – Distributed October 31, 2010 (With 5 figures)
Abstract
Secondary production of zooplankton, the main energy pathway in many aquatic ecosystems, is crucial to an Understanding of functioning of these systems function. In this study, we analyzed the magnitude and seasonal variations of the population density, biomass and secondary production of Cladocera in the Furnas Reservoir (Brazil). Samples were carried out monthly at 6 points in the reservoir, from August 2006 to July 2007. Main physical and chemical variables in the water column were measured in situ. Data on density, biomass and development times were obtained and used to calculate the secondary production of eight Cladocera species. The total production of Cladocera varied from 0.02 to 28.6 mgDWm–3.day–1, among the sampling sites. The highest values were recorded in spring and summer
months (September to January), and were correlated to the increase in the biomass of the phytoplankton. The mean production:biomass ratio was 0.32. The level of production in Furnas Reservoir fell within the range of those reported in the literature and was of the same order of magnitude of the production values recorded for oligotrophic reservoirs. Cladocera production differed spatially inside the Sapucaí compartment and also in the temporal scale, seasonally.
Keywords: zooplankton, productivity, reservoir tropical, trophic state.
Biomassa e produção de Cladocera no Reservatório de Furnas, Minas Gerais, Brasil
Resumo
A produção secundária do zooplâncton é uma variável importante no funcionamento dos ambientes aquáticos, sendo o principal caminho da energia em muitos ecossistemas. Neste trabalho, o principal objetivo foi determinar a magnitude e as mudanças sazonais na densidade, biomassa e produção secundária dos cladóceros, no Reservatório de Furnas. As amostragens de Cladocera foram realizadas mensalmente em seis pontos do reservatório no período de agosto de 2006 a julho de 2007. As principais variáveis físicas e químicas da coluna d´água foram medidas in situ. Dados de densidade, biomassa e tempo de desenvolvimento foram obtidos e utilizados para calcular a produção secundária de oito espécies de cladóceros. A produção total dos cladóceros variou, em média, de 0,02 a 28,6 mgPS.m–3.dia–1 entre os
pontos amostrados. Os maiores valores foram registrados nos meses de primavera e verão, relacionados em parte com os aumentos na biomassa do fitoplâncton. A razão produção:biomassa foi 0,32. Os valores de produção do Reservatório de Furnas situam-se dentro da faixa de valores que são relatados na literatura e foi da mesma ordem de grandeza dos valores registrados para outros reservatórios oligotróficos. A produção de Cladocera apresentou diferenças em escala espacial dentro do compartimento Sapucaí e sazonalmente, em escala temporal.
1. Introduction
In freshwater environments, zooplankton plays a relevant role in energy transfer and nutrient transport and regeneration, owing to their position in the food web as the main direct consumers of phytoplankton. The magnitude of energy fluxes is determined by the herbivory of the various components of the zooplankton community, which depends on the community structure, and is a result of the process of colonisation and establishment of species (Armengol, 1980). Zooplankton community is made up of a mixture of species belonging to many taxonomic groups whose morphology, reproductive strategies and feeding habits are very diverse, resulting in spatial and temporal variations in productivity profiles.
Cladocerans are a very important component of the freshwater plankton community, being responsible for a sizable fraction of secondary production, amounting to 45-91% of the total (Pederson et al., 1976). These microcrustaceans reach maturity quickly and this can give them a competitive advantage in certain environments, allowing cladoceran populations to grow simply by increasing the number of eggs produced. On the other hand, these animals are the favourite prey of many invertebrates and vertebrates in freshwater habitats (Green, 1981).
Biomass reflects the instantaneous quantity of live organic matter in a given area and also provides a means of analyzing an ecosystem’s productivity, irrespective of taxonomic composition. Despite their importance, published data on biomass and secondary production of zooplankton are still scarce (Bonecker et al., 2007). An increase in zooplankton biomass has often been associated with a rise in the trophic status of the environment.
Many studies on the secondary production of zooplankton were published in the 1970s and 1980s, with the general objective of reviewing and systematising the conceptual framework and the techniques used in research on this topic (Winberg et al., 1971; Edmondson, 1974; Bottrell et al., 1976), with a special attention by the International Biological Programme (IBP). The complexity of methods used to measure a secondary production explains the scarcity of estimates for any zooplankton group, particularly in the tropics, due to continuous reproduction and overlapping coortes.
Despite the practical difficulties, estimates of zooplankton productivity are important in order to assess its role on aquatic ecosystems functioning. It is also important to understand natural community organization in terms of fluxes of matter and energy and the capacity of each kind of environment to generate and maintain specific populations and mixed communities (Wetzel, 1993).
The aim of this study was to determine the mean values and seasonal variation of the population densities, biomass and secondary production of the most representative cladocerans in one of the largest tropical reservoirs in Brazil and also to compare the production levels by this important zooplankton group between a temperate and a tropical oligotrophic environment.
The hypothesis to be tested are: a) In the spatial scale, the differences in the cladoceran production among sites are influenced by the peculiarity of environmental factors at each site; b) At the temporal scale, changes in the cladoceran production are driven by specific forcing functions such as pluviometric precipitation and reservoir residence times.
2. Material and Methods
2.1. Study area
Furnas Reservoir is located in the Rio Grande basin, near the Southern border of the State of Minas Gerais (46° 19’ W and 20° 40’ S), Brazil. It presents a very dendritic pattern and is formed by the rivers Grande and Sapucaí, and several smaller tributaries. When filled to the maximum, the environment is 220 km long, with a perimeter of 3,500 km, flooded area of 1,440 km2, total
volume of 22.95 billion m3 and residence time around
160 days (Delgado, 1999).
Furnas Reservoir was built in 1963, to produce hydroelectric power. In recent times, it has been suffering progressive environmental degradation due to human activity (Corgosinho and Pinto-Coelho, 2006).
2.2. Sampling and treatment of samples
Samples were collected monthly (from August 2006 to July 2007) at 6 points in the Furnas Reservoir, located in the arms formed by the former rivers (Cabo Verde – 21° 19’ W and 45° 59’ S, Muzambão – 21° 19’ W and 46° 00’ S, Sapucaí – 21° 16’ W and 45° 00’ S and at the confluence of the three – 21° 15’ W and 45° 54’ S) in both limnetic and littoral zones (Figure 1).
Water temperature was read by a thermistor and a Secchi disk was used to measure transparency. Water electrical conductivity and pH were recorded with a Pocket Conductivity Meter - Q405B and a Pocket pH Meter with Direct Electrode - Q400BD Quimis instruments. Organic and inorganic matter concentrations were determined by gravimetric method (Teixeira et al., 1965). Dissolved oxygen concentration (DO) was determined by Winkler’s method (Golterman et al., 1978). Ammonia, nitrite, nitrate, total dissolved phosphate, total P and N, were determined according to Mackereth et al. (1978). The chlorophyll-a
concentration was determined by cold extraction with 90% acetone as described in Lorenzen (1967).
The Trophic State Index (TSI) of Carlson modified by Toledo et al. (1983) was calculated for the sampling localities and dates, considering the following parameters: water transparency (Secchi Disk), total phosphorus and chlorophyll-a concentrations. The following categories
were used to the classification of the reservoir: oligotrophic state: <44; mesotrophic state: >44 to <54 and eutrophic state: >54.
column. The samples were fixed in 4% formaldehyde solution. Organisms were identified and counted under a stereoscopic microscope (up to 50× magnification) and an optical microscope with an eyepiece graticule calibrated against a micrometer scale (up to 2,000×), with the literature on Cladocera (Elmoor-Loureiro, 1997; Smirnov, 1996). Individual size of each of the eight species was also measured (minimum of 30 individuals) and organisms were divided in three size classes (neonate, young and adult).
The biomasses of the most abundant species were calculated, as proposed by Edmondson (1971), from the average lengths and densities of the organisms in each size class through formulae relating the dry weights of individuals to their lengths (W = a Lb), for the main species
of cladocerans. For the species Ceriodaphnia cornuta
Sars, 1885 and Ceriodaphnia silvestrii Daday, 1902the
constants a and b of Ceriodaphnia reticulata Jurine, 1820
(Pace and Orcutt, 1981) were used; for Bosmina freyi De
Melo and Hebert, 1994, Bosmina hagmanni Stingelin,
1904 and Bosminopsis deitersi Richard, 1895 the constants
of Bosmina longirostris O. F. Muller, 1785; for Daphnia gessneri Herbst, 1967 the constants of Daphnia ambigua
Scourfield, 1947; for Diaphanosoma spinulosum Herbst,
1975 the constants of Diaphanosoma brachyurum Liévin,
1848 and for Moina minuta Hansen, 1899 the constants
of Moina micrura Kurz, 1874 (Dumont et al., 1975)
(Table 1).
The embryonic and post-embryonic development-times of the main cladoceran species found in the Furnas Reservoir
were taken from published data (Hanazato and Yasuno, 1985; Bélehradek, 1930; Diazcastro and Hardy, 1998; Melão and Rocha, 2001; Santos et al., 2006) (Table1).
Secondary production was calculated from the biomass increment following Winberg et al. (1965). Total production:biomass ratios (P/B) were also calculated for the cladoceran species.
The simplified formula for the production in one day was (Equation 1):
(
)
1(
)
1(
)
1P N . W .T− N . W .T− N . W .T−
Ι Ι Ι ΙΙ ΙΙ Ι ΙΙΙ ΙΙΙ ΙΙΙ
= ∆ + ∆ + ∆ (1)
where: P = secondary production in one day; N = number of organisms per stage; ∆w = increment in biomass (total weight) per stage; T = duration of stage in days; I, II, III …= series of developmental stages.
Redundancy Analysis (RDA) was used to relate density, biomass and cladoceran secondary production with chlorophyll-a and water physical and chemical
variables at each sampling point and each seasonal period: a) rainy spring (August, September and October); b) rainy summer (November, December and January); c) dry autumn (February, March and April); d) dry winter (May, June and July). The Redundancy Analysis was carried out with the statistical program R version 2.9 (R Development Core Team, 2005).
A non-parametric analysis of variance (NPMANOVA) (Anderson, 1999) was applied to verify if the observed differences in phytoplankton biomass (chlorophyll-a) and
cladoceran secondary production were significant.
3. Results
Noticeable changes in the physical and chemical properties of the water in Furnas Reservoir occurred during the 12-month study (Table 2), reflecting well-defined seasonal climatic periods. The water temperature varied between 18 °C in August 2006 (at P6) to 31 °C in February 2007 (at P3). The pH oscillated between slightly acid and alkaline, with the lowest value (6.3) being recorded at P5 in March 2007 and the highest (8.8) at P6 in January 2007. Electric conductivity, which was low when compared to other reservoirs, varied from 14.7 µS.cm–1 (P4, January
2007) to 60 µS.cm–1 (P6, September 2006). Oxygen
concentrations were high, evidencing that this reservoir is well oxygenated.
Nutrient concentrations varied widely, in time and spatially during the study. In general, the values were low, except for total nitrogen and phosphorus, which had high values recorded in January. The reservoir was characterised as an oligotrophic environment, except at points P4, P5 and P6, which in January were mesotrophic (Table 2).
The chlorophyll concentration was rather low at most collecting points, except at P4 and P6, where the highest mean concentrations were recorded (Table 2). Individual readings ranged from 1.6 (P5, July 2007), to 79.5 µg.L–1
(P4, January 2007).
The density, biomass and secondary production exhibited differences at individual sampling points, but there was great similarity between their overall trends
Table 1. Development time (days) and formulae relating the dry weight of individuals to their lengths (W = a Lb) for the
dominant species of Cladocera occurring in Furnas Reservoir, MG, Brazil.
Development time (days) Equation References
Egg Neonate to
young
Young to adult
Bosmina freyi 1.49 0.91 1.83 W = 26.600 L3.13 Dumont et al., 1975 Bosmina hagmanni 1.49 0.91 1.83 W = 26.600 L3.13 Dumont et al., 1975 Bosminopsis deitersi 1.21 0.91 1.83 W = 26.600 L3.13 Dumont et al., 1975 Ceriodaphnia cornuta cornuta 1.66 1.28 2.55 W = 16.945 L3.15 Pace and Orcutt, 1981 Ceriodaphnia silvestrii 1.29 1.56 2.5 W = 16.945 L3.15 Pace and Orcutt, 1981 Daphnia gessneri 1.74 1.21 2.94 W = 4.660 L2.29 Dumont et al., 1975 Diaphanosoma spinulosum 1.35 1.59 1.59 W = 3.740 L2.11 Dumont et al., 1975 Moina minuta 1.37 0.76 0.18 W = 6.610 L2.57 Dumont et al., 1975
Table 2. Physical and chemical parameters (mean and standard deviation) for each variable at each sampling site in Furnas
Reservoir, MG, Brazil (Temp - temperature, Transp - transparency, Cond - electrical conductivity, DO - dissolved oxygen, NH4 - ammonia, NO2– - nitrite, NO
3– - nitrate, TN - total nitrogen, TDP - total dissolved phosphate, TP - total phosphorus, Chl - chlorophyll-a and TSI - Trophic State Index). Oligo = oligotrophic.
P1 P2 P3 P4 P5 P6
Temp (°C) 28.0±3.8 28.3±3.4 27.1±2.9 24.8±2.3 24.4±2.8 25.6±3.0
Transp (m) 2.6±0.8 2.5±0.8 2.6±0.9 2.6±1.7 2.3±1.6 2.7±1.4
pH 7.6±0.9 7.6±0.7 7.6±0.8 7.2±0.6 7.1±0.6 7.5±0.7
Cond (µS.cm–1) 20.9±2.5 21.2±2.1 25.5±6.9 20.5±4.2 19.1±1.5 22.1±6.3
DO (mg.L–1) 8.7±1.2 9.3±1.8 9.3±1.5 8.4±0.9 8.8±1.0 8.5±1.4
Depth (m) 16.4±4.1 6.8±3.2 15.6±3.4 16.2±4.3 13.3±3.0 18.6±4.2
OM 2.1±1 2.3±1 1.9±1.3 2.9±3.6 2.6±4.0 2.9±5.1
IM 0.8±0.7 1.4±0.9 0.9±0.7 2.0±3.1 2.6±3.4 1.6±1.6
NH4 (µg.L–1) 50.9±48.0 25.0±30.2 50.6±48.4 19.4±22.6 18.2±16.7 23.5±23.4
NO2– (µg.L–1) 1.1±1.0 0.9±0.7 1.0±0.7 1.1±0.7 0.9±0.8 0.8±0.8
NO3– (µg.L–1) 17.2±21.7 16.7±21.8 19.4±27.5 43.4±32.5 41.6±38.7 44.5±46.7
TN (µg.L–1) 258.8±121.2 210.2±72.5 291.9±159.6 307.8±127.8 318.1±218.5 316.9±205.0
TDP (µg.L–1) 5.0±3.7 4.7±3.3 5.8±4.0 4.1±3.3 3.6±3.1 4.0±4.0
TP (µg.L–1) 19.7±12.5 13.6±5.9 26.4±20.5 21.0±14.4 28.5±48.3 29.9±38.1
Chl ( µg.L–1) 7.4±5.28 6.4±3.5 5.8±3.0 12.7±22.1 8.4±13.4 10.3±20.6
(Table 3 and Figure 2), with the highest values at P4 (November), P5 (November and December) and P6 (December and April).
The density and biomass results do not show a very well defined pattern over the months of the study, but the Cladocera secondary production was clearly greatest in November and December 2006 (Figure 2). The lowest production occurred in P1 and P3, from March to August.
A sharp rise in secondary production was observed in late spring, coinciding with the start of a rainy period in November, when the temperature was rising and a fresh load of nutrients was introduced into the reservoir by the first rains (Figure 3a). The lowest mean Cladocera production rate was in May (0.02 mgDW.m–3.day–1) and
the highest in November (28.6 mgDW.m–3.day–1). A small
increase in the concentration of chlorophyll-a between
October and November coincided with a substantial increase in cladoceran production, but as the chlorophyll peaked in January, after the production decline and, an inverse relation in the density of phytoplankton can be seen (Figure 3b).
The mean P/B rates varied between 0.1 and 0.7 during the study period (Figure 4). The highest mean value (0.7) occurred in November, when the highest rate of cladoceran production was recorded (see Figure 2).
From the redundancy analysis it was observed that the two first axes explained 68.7% of the total variability of the data (Figure 5). Through axis 1, mainly related to seasonal changes, the summer with the highest precipitation separated from dry winter and transitional periods (autumn and spring). Axis 2 (6.4%), mainly driven by abiotic variables, also separated the four seasonal periods. It was possible to observe that cladoceran production was
positively associated with the variables chlorophyll-a and
nutrients (N and P) (Figure 5).
The NPMANOVA evidenced that the differences between climatic periods were statistically significant (p < 0.05).
4. Discussion
The research devoted to secondary production by the freshwater cladocerans in tropical waters is still very limited (Hanazato and Yasuno, 1985; Hardy and Duncan, 1994). In Brazil some studies were performed in recent decades, mostly in the reservoirs (Melão and Rocha, 2001; Rietzler et al., 2004; Santos-Wisniewski and Rocha, 2007). These studies have indicated that temperature, food quality and food concentration are generally the main controlling factors.
In the Furnas Reservoir, although the peaks in cladoceran biomass were related to chlorophyll-a concentrations to
certain extent, there was not a direct relationship. Thus, in January the chlorophyll-a concentration was highest
but there was no corresponding peak in the zooplankton biomass.
Amongst the localities sampled in the reservoir, the highest zooplankton biomass occurred in the Sapucaí River portion (P4 and P5), where the main contributions came from the species Ceriodaphnia silvestrii and Daphnia gessneri.
It is well known that nutrient enrichment of aquatic systems has great impact on the abundance and biomass of zooplankton populations (Pinto-Coelho and Corgosinho, 1998). In Irai reservoir, Southern Brazil, a greater biomass of bacteria, flagellates, ciliates and zooplankton was associated to high densities of phytoplankton (Bonecker et al., 2007). In
Table 3. Size classes (mm), dry weights (mg), mean and standard deviation of density, biomass and secondary production of
the dominant species of Cladocera in Furnas Reservoir, MG, Brazil.
Size classes (mm)
Dry weight (mg)
Density
(ind.m–3)
Biomass
(mgDW.m–3)
Secondary production
(mgDW.m–3.day–1)
Neonate Young Adult Neonate Young Adult Mean (SD) Mean (SD) Mean (SD)
Bosmina freyi 0.20-0.23 0.24-0.45 0.46-0.80 0.27 0.61 2.34 767.62±1185.9 0.87±1.27 0.31±0.89
Bosmina hagmanni
0.19-0.20 0.21-0.45 0.46-0.47 0.17 0.68 2.34 631.04±956.67 0.59±0.90 0.33±0.88
Bosminopsis deitersi
0.20-0.22 0.23-0.30 0.31-0.41 0.23 0.99 1.63 126.33±136.63 0.02±0.06 0.01±0.07
Ceriodaphnia cornuta
0.24-0.27 0.28-0.48 0.49-0.51 0.16 0.80 1.79 811.54±1423.3 0.92±1.56 0.27±0.54
Ceriodaphnia silvestrii
0.29-0.33 0.33-0.67 0.68-0.70 0.51 3.39 5.02 906.69±1064.7 2.72±3.10 0.43±0.53
Daphnia gessneri
0.32-0.35 0.36-1.11 1.12-1.35 0.42 5.91 6.04 249.22±418.44 1.19±1.91 0.07±0.11
Diaphanosoma spinulosum
0.35-0.37 0.38-0.9 0.91-1.00 0.46 1.81 3.06 347.83±503.74 0.59±0.76 0.08±0.12
Moina minuta
Figure 2. Monthly variation in density, biomass and total production of Cladocera in Furnas Reservoir, MG.
this reservoir, the species Bosmina hagmanni was responsible
for the largest fraction of cladoceran biomass.
Nevertheless, zooplankton biomass is considered a more accurate and realistic measure than density in comparative studies between the trophic state of different environments. Density does not necessarily reflect the rate of production of new material or the rate at which energy is being processed in the system (Matsumura-Tundisi et al., 1989). Furthermore, secondary production in a given system is a better indicator of the relative contribution
of each species to the material and flow energy within a community.
and Corgosinho, 1998). Due to the multiple uses, the reservoir is changing from the condition of oligotrophic to mesotrophic, and in some places can already be classified as eutrophic (Pinto-Coelho et al., 2005). The secondary production of Cladocera of Furnas Reservoir, as observed in this study, reflects the oligotrophic conditions of the reservoir conditions. There is evidence in the literature that heavy eutrophication can decrease secondary production, particularly when eutrophication is in advanced stages due to the worsening of algal food quality (Schulz and Sterner, 1999). Athough the Sapucaí compartment of Furnas Reservoir is still oligotrophic, there are occasional occurrences of cyanobacteria blooms, suggesting an early stage of nutrient enrichment, but not directly reflecting on the cladoceran production values.
In the tropics, cladoceran secondary production during the rainy season can vary from 3 to 30 times compared to that recorded in the dry season (Panarelli et al., in press; Melão and Rocha, 2001). In the present study the mean production of the Cladocera was about 3-fold higher in the rainy period than in the dry one. In the oligotrophic Lake Dourada, also in Southeast Brazil, Melão and Rocha (2001) found a 3-fold rise in cladoceran production in the rainy season. The same trend was reported by Panarelli et al. (in press) regarding the cladoceran production in the floodplain lakes of the Paranapanema River, at the transition zone to Jurumirim reservoir, SP, who observed cladoceran production levels 11 to 30 times greater in the wet season.
Figure 3. Monthly variation of total production of Cladocera
(mean and standard deviation) from six points studied in Furnas Reservoir. a) Production and water temperature and b) production and chlorophyll-a concentration in the water.
a
b 0
5 10 15 20 25
A S O N D J F M A M J J 0 5 10 15 20 25 30
Temperature (°C)
Production (mgD
W
.m
–3.day –1)
0 5 10 15 20 25
A S O N D J F M A M J J 0 5 10 15 20 25 30 35 40 45
Production (mgD
W
.m
–3.day –1)
Chloroph
yll- (mg.L
–1¹)
a
Figure 4. Mean and standard deviation P/B rates for
Cladocera from of six points studied in Furnas Reservoir, MG, between August 2006 and July 2007.
Figure 5. Redundancy analysis including sampling points,
climatic periods and main water physical, chemical and biological variables obtained for Furnas Reservoir, MG, in the period between August 2006 and July 2007; P1 to P6 denote the sampling points; RS, RSp, DAu and DWi mean rainy summer, rainy spring, dry autumn and dry winter, re-spectively; Temp = temperature; DO = dissolved oxygen; Cond = water electrical conductivity; TN = total nitrogen; TP = total phosphorus; OM = organic matter; IM = inor-ganic matter Chla = chlorophyll-a; Biom = biomass; Dens = density and Prod = total Cladocera production; pH = hydro-genionic potential.
In a study performed in one mesotrophic and two oligotrophic lakes, Pederson et al. (1976) found that the lake with highest trophic level had the lowest productivity.
Nevertheless, in the present study, the highest cladoceran productivity at those points might be related to a greater availability of food, not characterizing a real process of eutrophication.
From October and December, with modest rises in the chlorophyll-a concentration, the cladoceran biomass
and productivity reached maximum values, though further increases in chlorophyll-a did not influence the
secondary production, which began to decline because the phytoplankton was dominated by a bloom of the cyanobacteria Microcystis aeruginosa Kutzing, 1846
Kutzing, 1846 (Delgado, 1999)
The P/B rate allows interesting comparisons between ecosystems. The mean P/B ratio of Cladocera in Furnas Reservoir obtained in the present study was 0.32, higher than those usually found in oligotrophic lakes, such as that reported by Melão and Rocha (2001) for Lagoa Dourada (0.18) and even exceeded those in mesotrophic lakes, as reported by Pederson et al. (1976) for Lake Sammamish (0.24). In Salto Grande reservoir (Brazil), a hypereutrophic environment, Rietzler et al. (2004) recorded a mean P/B for Cladocera as high as 1.14 in the summer months.
Gras and Saint-Jean (1983) in a comparison with data on zooplankton production in Lake Tchad (Africa), found P/B ratios between 0.02 and 0.45 in temperate zone lakes and between 0.20 and 0.87 in lakes in the tropic and subtropic. The range of P/B rations (0.1 to 1.3) in Furnas Reservoir lies within range found by these authors.
The P/B ratio may not be an indicator of the trophic state of Furnas Reservoir, although it is definitely higher than in many oligotrophic freshwater environments, such as those reported by Pederson et al. (1976). However, the high values obtained in the present study for this reservoir might be only reflecting the spatial scale of Furnas Reservoir and the existence of heterogeneity in the trophic conditions of particular areas (especially near P4 and P5) inside the Sapucaí compartment.
Both hypotheses investigated in the present study were supported. There are spatial differences in trophic conditions as revealed by nutrient and chlorophyll-a concentrations which were key factors influencing Cladocera production, particularly in the area represented by points P4 and P5. The pluviometric precipitation and possibly the reservoir residence times were the forcing functions driving Cladocera production in the temporal scale, resulting in higher production in the rainy summer period.
Acknowledgements — To the Hydrobiology and Hatchery
Station of FURNAS Centrais Elétricas S.A., P&D Aneel Program for the financial support for the research and to the National Research Council (CNPq) for the scholarship to the first author.
References
ANDERSON, MJ., 1999. Non-parametric MANOVA (Computer
software). Sydney: University of Sydney.
ARMENGOL, J., 1980. Colonización de los embalses españoles por crustáceos planctónicos y evolución de la estructura de sus comunidades. Oecologia Aquatica, vol. 4, p. 45-70.
BÉLEHRADEK, J., 1930. Temperature coefficients in biology. Biological Reviews of the Cambridge Philosophical Society, vol. 5, p. 30-58.
BONECKER, CC., NAGAE, MY., BLETLLER, MCM., VELHO, LFM. and LANSAC-TÔHA, FA., 2007. Zooplankton biomass in tropical reservoirs in Southern Brazil. Hydrobiologia, vol. 579, no. 1, p. 115-123.
BOTTRELL, HH., DUNCAN, A., GLIWICZ, ZM., HERZIG, A., HILLBRICHT-ILKOWSKA, A., KURASAWA, H., LARSSON, P. and WEGLENSKA, T., 1976. A review of some problems in
zooplankton production studies. Norwegian Journal of Zoology, vol. 24, p. 419-456.
CORGOSINHO, PHC. and PINTO-COELHO, RM., 2006. Zooplankton biomass, abundance and allometric patterns along an eutrophic gradient at Furnas Reservoir (Minas Gerais, Brazil).
Acta Limnologica Brasileira, vol. 18, no. 2, p. 213-224.
DELGADO, PCS., 1999. Variação sazonal e especial da comunidade fitoplanctônica do reservatório de Furnas, município de Guapé
(MG). Belo Horizonte: Universidade Federal de Minas Gerais.
114 p. [Dissertação de Mestrado].
DIAZCASTRO, JG. and HARDY, ER., 1998. Life history of Moina
micrura (Kurz) fed with three algae species, in the laboratory.
Amazoniana, vol. 15, no. 1-2, p. 25-34.
DUMONT, HJ., van de VELDE, I. and DUMONT, S., 1975. The dry weight estimate of biomass in a selection of Cladocera, Copepoda and Rotifera from the plankton, periphyton and benthos of continental waters. Oecologia, vol. 19, no. 1, p. 75-97. EDMONDSON, WT., 1974. Secondary production. Verhandlungen der Internationalen Vereinigung für Theoretische und Angewandte
Limnologie, vol. 20, p. 229-272.
-, 1971. Methods for processing samples and developing data. In EDMONDSON, WT. and WINBERG, GC., eds. A manual on methods for the assement of secondary productivity in freshwater. Oxford: Blackwell Scientific Publications. 357 p.
ELMOOR-LOUREIRO, LMA., 1997. Manual de identificação
de cladóceros límnicos do Brasil. Brasília: Universa. 155 p.
GOLTERMAN, HL., CLYMO, RS. and OHNSTAD, MAM., 1978. Methods for physical and chemical analysis of freshwaters. London: International Biological Programme. 213 p.
GRAS, R. and SAINT-JEAN, L., 1983. Durée du dévelopment juvénile de quelques copépodes planctoniques du Lac Tchad.
Revue d’Hydrobiologie Tropicale, vol. 14, no. 1, p. 39-51.
GREEN, J., 1981. Cladocera. In HURLBERT, SH., RODRIGUEZ, G. and SANTOS, ND., eds. Aquatic Biota of South America. Part
1 Arthropoda. Campanile Drive: San Diego State University.
p. 22-57.
HANAZATO, T. and YASUNO, M., 1985. Population dynamics and production of cladoceran zooplankton in the highly eutrophic Lake Kasumigaura. Hydrobiologia, vol. 124, no. 1, p. 13-22. HARDY, ER. and DUNCAN, A., 1994. Food concentration and temperature effects and life cycle characteristics of tropical Cladocera (Daphnia gessneri Herbst, Diaphanosoma sarsi Richard, Moina reticulata (Daday)): I Development time. Acta
Amazonica, vol. 24, no. 1-2, p. 119-134.
LORENZEN, CJ., 1967. Determination of chlorophyll and phaeopigments: spectrophotometric equations. Limnology and
Oceanography, vol. 12, no. 2, p. 343-346.
MACKERETH, JFH., HERON, J. and TALLING, JF., 1978. Water analysis: some revised methods for limnologists. Freshwater
Biological Association, vol. 36, p. 120.
MATSUMURA-TUNDISI, T., RIETZLER, AC. and TUNDISI, JG., 1989. Biomass (dry weight and carbon content) of plankton Crustacea from Broa reservoir (São Carlos, SP, Brazil) and its fluctuations across one year. Hydrobiologia, vol. 179, no. 3, p. 229-236.
Verhandlungen des Internationalen Verein Limnologie, vol. 27, no. 5, p. 2879-2887.
PACE, LM. and ORCUTT, JDJR., 1981. The relative importance of protozoans, rotifers, and crustaceans in a freshwater zooplankton community. Limnology and Oceanography, vol. 26, no. 5, p. 822-830.
PANARELLI, EA., CASANOVA, SMC. and HENRY, R., 2009. Secondary production and biomass of Cladocera in two marginal lakes after the recovery of their hydrologic connectivity with a tropical river. In PINTO-COELHO, RM., org. Selected Topics of
Theoretical, Experimental and Applied Limnology. in press.
PEDERSON, GL., WELCH, EB. and LITT, AH., 1976. Plankton secondary productivity and biomass: their relation to lake trophic state. Hydrobiologia, vol. 50, no. 2, p. 129-144.
PINTO-COELHO, RM. and CORGOSINHO, PH., 1998. Alterações na estrutura do zooplâncton em resposta a um gradiente de trofia no reservatório de Furnas, Minas Gerais. In Anais do VIII Seminário
Regional de Ecologia – PPGERN/UFSCar. p. 1173-1188.
PINTO-COELHO, RM., PINEL-ALLOUL, B., MÉTHOT, G. and HAVENS, KE., 2005. Crustacean zooplankton in lakes and reservoirs of temperate and tropical regions: variation with trophic status. Canadian Journal of Fisheries and Aquatic Sciences, vol. 62, no. 2, p. 348-361.
R Development Core Team, 2005. R: A language and environment for statistical computing. [2.2.0]. Vienna: R Foundation for Statistical Computing.
RIETZLER, AC., ROCHA, O. and ESPÍNDOLA, ELG., 2004. Produção secundária de espécies do zooplâncton da represa de Salto Grande, Estado de São Paulo. In ESPÍNDOLA, ELG., LEITE, MA. and DORNFELD, C.B., orgs. Reservatório de Salto
Grande (Americana-SP): caracterização, impactos e propostas
de manejo. São Carlos: RiMa. p. 199-219.
SANTOS, MAPF., MELÃO, MGG. and LOMBARDI, AT., 2006. Life history characteristics and production of Ceriodaphnia
silvestrii Daday (Crustacea, Cladocera) under different experimental
conditions. Acta Limnologica Brasiliensia, vol. 18, no. 3, p. 199-212.
SANTOS-WISNIEWSKI, MJ. and ROCHA, O., 2007. Spatial distribution and secondary production of Copepoda in a tropical reservoir: Bonita, SP, Brazil. Brazilian Journal of Biology, vol. 67, no. 2, p. 223-233.
SCHULZ, KL. and STERNER, RW., 1999. Phytoplankton phosphorus limitation and food quality for Bosmina. Limnology
and Oceanography, vol. 44, no. 6, p. 1549-1556.
SMIRNOV, NN., 1996. Cladocera: The Chydorinae and Saycinae (Chydoridae) on the world. In DUMONT, HJ., ed. Guides to the identification of the microinvertebrates of the continental waters
of the world. Amsterdan: SPB Academic. 644 p.
TEIXEIRA, C.; TUNDISI, JG. and KUTNER, BEM., 1965. Plankton studies in a mangrove II: The standing-stock and some ecological factors. Boletim do Instituto Oceanográfico, v. 24, p. 23-41.
TOLEDO, APJR., TALARICO, M., CHINEZ, SJ. and AGUDO, EG., 1983. A aplicação de modelos simplificados para avaliação do processo da eutrofização em lagos e reservatórios tropicais.
In Congresso Brasileiro de Engenharia Sanitária e Ambiental.
São Paulo: Cetesb. p. 1-34.
WETZEL, RG., 1993. Limnologia. Lisboa: Fundação Calouste Gulbekian.
WINBERG, GC., PECHEN, GA. and SHUSSHKINA, EA., 1965. Production of planktonic crustaceans in three lakes of different type. Zoologichesky Zhurnal, vol. 44, no. 55, p. 676-687. WINBERG, GG., PATALAS, K., WRIGHT, JC., HILLBRICHT-ILKOWSKA, A., COOPER, WE. and MANN, KH., 1971. Methods for calculating productivity. In EDMONDSON, WT. and WINBERG, GG. A manual on methods for the assessment
of secondary productivity in fresh waters. Oxford: Blackwell