THE INTERDEPENDENCE OF CLIMATE AND SOCIOECONOMIC
VULNERABILITY IN THE ABC PAULISTA REGION
1
MARÍA CLEOFÉ VALVERDE2
1. Introduction
In the context of planetary environmental crises, analyzing climatic extremes – whether they are excess or lack of rain, or hot and cold waves in different regions of the world – has called attention to the impact these events have on the most vulnerable populations. In Brazil, it is no different; in recent decades, various regions of the country have seen intense droughts and flooding. In the Amazon region, the droughts of 2005 and 2010 (MARENGO et al., 2011) and the floods of 2009 and 2010 (SOUZA and AL-MEIDA, 2010) have originated environmental and socioeconomic impacts, mainly on people living near rivers, damaging agricultural and livestock production in the region’s seasonal floodplains (várzea forests).
Another case of extremes is the prolonged drought in the northeast region of Brazil that began in 2010 and by 2013 was considered the most severe drought of the last 100 years in terms of the availability of water for human consumption and for agricultural and livestock activities (GUTIERREZ et al., 2014). Recently, in the summer of 2014, one of the most severe droughts was recorded in the state of São Paulo (COELHO et al., 2015), causing a water crisis that impacted various socioeconomic sectors. Reservoirs that supplied the Metropolitan Region of São Paulo (RMSP) reached very low levels, such as the case of the Cantareira System, which dropped to 5% of its storage capacity in January of 2015.
Fluctuations, of excessive or lack of rain, can be considered climatic extremes. In climatological terms, extreme events are large deviations in atmospheric states as relating to average behavior, which occur on scales varying from days to millennia (MARENGO et al., 2007). In the scale of days, rain extremes are more frequent in the summer and can be convective precipitation, originating in the heating of the Earth’s surface, or produced by synoptic scale atmospheric systems, such as the South Atlantic Convergence Zone, the main system in summer months that is responsible for rain in the southeast of Brazil.
1. The author would like to think the FAPESP for financial support through the Process 2013/09269-2, which was indispensable for completing this research.
However, the impacts of these extreme events can be different depending on the region in which they occur. In urban areas, where the soil is covered in concrete and impermeable, rainwater drainage is difficult, there are few green areas, and housing is inadequately planned, populations in such areas are more vulnerable to the impact of intense rainfall. The vulnerability of a population, according to Pelling and Uitto (2001), is a product of the physical exposure to a natural danger and of the human capacity to prepare for, mitigate, and recuperate from the negative impacts of disasters.
In the scientific literature, different concepts of vulnerability are applied in the most diverse fields (geography, demography, sociology, psychology, among others) due to its multidisciplinary and interdisciplinary connotation and to the complexity of factors that explain the causes (CARDONA, 2004; TIMMERMAN, 1981). However, despite the conceptual differences and diversity of vulnerability, there is no scientific definition that is more representative than the others (ALVES, 2006). Nevertheless, it is necessary to immerse ourselves in the different definitions to expand the views of researchers in order to apply and understand the concept better. For Alves (2006), the interdisciplinary connotation of the term is advantageous, since it makes vulnerability a mediating concept that is capable of facilitating dialogue between professionals with distinct disciplinary and political viewpoints.
In Brazil, the concept of vulnerability is highly discussed and studied, mainly in geography and demography (MARANDOLA and HOGAN, 2005; HOGAN and MA-RANDOLA, 2005), with special interest in at-risk populations. According to Marandola and Hogan (2005, p. 30):
“Both disciplines (geography and demography) have become filled with studies of flooding and mudslides, among other situations in which the environment coupled with socioeconomic factors, exposes at-risk populations, especially in cities.”
A broad and holistic conceptualization of vulnerability proposed by Cardona (2004) includes aspects of physical and social vulnerability, and allows us to visualize its interdependence:
“Vulnerability is the physical, economic, political, or social predispo-sition or susceptibility of a community that is affected or suffers harm when a there is destabilizing phenomenon of natural or man-made origin” (CARDONA, 2004, p. 1).
For a long time, the definitions of risk and vulnerability have been approached in scientific literature with a single significance, yet they are different. For a better un-derstanding, it is necessary to clarify the concepts. Marandola and Hogan (2005, p. 30) affirm that:
Understanding the term vulnerability and its diverse scientific approaches is an undertaking that cannot be realized without con-sidering the concept of risk at the same time. This is due to the fact that vulnerability appears in the context of studies about risk in its environmental dimension, in the first place, and only later in its socioeconomic context.
Cardona (2004) explains the concept of threat is a common factor shared by vulnerability and risk. Threat refers to the latent danger or unfavorable external factors to which a system or individual is exposed. Already, vulnerability can be considered an unfavorable internal factor of a system or person that is affected by a phenomenon char-acterized as a threat. In this context, risk corresponds to the potential for loss that may occur for an individual or system exposed to a threat, which results in the convolutioni
of threat and vulnerability (CARDONA, 2004).
If we stop at the analysis of threat, the following question may emerge: what makes a system or individual vulnerable? Many factors could weaken a population or system that is exposed to a potential threat. Therefore, looking at the dangers or threats in one place is a strategy that permits, at the micro-scale, understanding the elements that interfere in the production, acceptance, and mitigation of such dangers, as well as mechanisms and processes that produce them and make people or systems vulnerable (MARANDOLA and HOGAN, 2009).
Yet, in many cases, intervening in a threat in order to reduce risk is not possible. The alternative is to modify the conditions of vulnerability of the exposed elements. In the framework of climatic vulnerability, it is important to clarify that we are interested in exploring how the climate or climatic variability, especially climatic extremes, can become threats. If we consider climatic extremes as destabilizing phenomena, for example an in-tense rainfall that affects a city or neighborhood, it is possible to construct the potential threat posed by damage in the exposed and the most susceptible areas that are affected by these events. The impact that extreme rainfall can have on a determined region is a function of social vulnerability and of the exposure to dangers or risks. Following Vincent (2004), the negative impacts of an extreme climate event will be more intense if the population that inhabits the affected region has a low socioeconomic profile, lacks the preparation to respond to an extreme event, and if there are few public institutions to assist and facilitate dealing with the disaster.
are part of natural climatic variations; however, they have become more frequent and intense in the context of climate changes according to research presented in the fourth and fifth IPCC reports from the IPCC (2014).
The most recent report “Impacts, Adaptation and Vulnerability” written by the II IPCC Working Group, affirms that the effects of climate change are being observed and felt by the entire planet. They have already affected agriculture, human health, land and ocean ecosystems, water supplies and the lives of many communities. However, many countries are still unprepared for the risks of climatic changes. Communities and eco-systems are most vulnerable due to the elevated levels of global warming that enhance and increase the probability of major and generalized impacts, which can be surprising and even irreversible. Adaptation can play a key role in reducing these risks according to the report (IPCC, 2014).
Thus, an extreme rain event constitutes a threat in the context of “where” and “when” it happens. The “where” can be related to the most susceptible and exposed urban areas according to their localization; generally they are settlements in floodplain areas even when inappropriate for building housing and habitations. The “when” is re-lated to the periods most favorable for intense rain and to the occurrence of more severe atmospheric systems.
With the aim of quantifying vulnerabilities, the scientific community uses composite indices to measure degrees of vulnerabilities; indicators for this can be demographic, so-cial, economic, health, and climatic, among others (CUTTER et al., 2003; RYGEL et al., 2006). Vulnerability indicators are potentially useful tools for identifying and monitoring vulnerability over time and space and for developing and prioritizing strategies to reduce vulnerabilities (RYGEL et al., 2006).
In Brazil, there are various studies that measure vulnerability using indicators from the most diverse approaches. Anazawa (2013) studied the socioeconomic vulnerability of the northern São Paulo coast (Caraguatatuba and São Sebastião), using physical-natural landscape data and territorially disaggregated socioeconomic data. The results facilitated the identification and measurement of intra-urban differences in the conditions of vulner-ability in different regions of two municipalities.
Confalioneri et al. (2009) pioneered studies that include climatic indicators, as well as social, environmental, economic, and sanitation indicators, focusing on the analysis of climatic vulnerability. The authors mapped the health vulnerability related to possible climatic impacts in the Brazilian territory. They developed a General Vulnerability Index (IVG), composed of three indicators: socioeconomic, climatic, and epidemiologic. They found that the highest IVG values corresponded to the north and northeast regions, re-sulting from a combination of low socioeconomic indicators, high prevalence of endemic diseases (six endemic infectious diseases sensitive to the climate) and high incidents of extreme climatic events (e.g. periodic droughts in the semiarid region).
Serra. According to Diniz and Campolina (2007), this division allows us to capture the growth and restructuring tendencies, especially in municipal São Paulo and the ABC region.
Based on the division of the RMSP in sub-regions, Valverde et al. (2011) evaluate vulnerabilities to climate extremes in each sub-region and highlight ABC Paulista as the least and Mogi das Cruzes as most socioeconomically vulnerable. ABC Paulista, located in the southeast of the RMSP, experienced accelerated industrial growth resulting in high economic growth. Alternatively, the highest vulnerability to extreme rain events was found in the Taboão da Serra sub-region due to the high indicators of maximum daily rain rates for the risk of landslides.
Aiming to further the study of vulnerability at the municipal level in the RMSP, this paper analyzes socioeconomic, demographic, sanitation, and extreme rainfall vulner-abilities in the ABC Paulista region. A municipal level analysis gives us a first-hand look at how the impacts of strong rainfall in the region can increase due to social, economic, demographic, and sanitation problems. This research provides distinctive information that can be used to elaborate public policy in order to help control and/or reduce vulner-abilities through prevention, mitigation, and adaptation measures.
2. Area of study, data and methodology.
2.1. Area of study
The ABC Paulista region, deonominated as the southeast sub-region of the RMSP, is made up of the Santo André, São Bernardo do Campo, São Caetano do Sul, Diadema, Mauá, Ribeirão Pires, and Rio Grande da Serra municipalities. According to the Brazilian Institute for Geography and Statistics (IBGE 2010), the region’s population is 2,549,135 inhabitants and territory is 828.7 Km2. The Greater ABC Inter-Municipal Consortium (2015) says the
region is considered very prosperous in all aspects, mainly in relation to job creation through the Commercial and Industrial Park that is one of the largest economic drivers in São Paulo state. However, high rates of urbanization in most of the municipalities (São Caetano do Sul, Diadema, Mauá, São Bernardo do Campo and Santo André), resulted in accelerated urban expansion, partly in inadequate areas where low income populations reside.
The hydrography of the region is mainly composed of the Tamanduateí river, which traverses three municipalities: Mauá, Santo André and São Caetano do Sul. Many Taman-duateí tributaries have become hidden streams due to the intense piping on riverbanks and covered riverbeds, which allowed for the building of many avenues, industries, and areas of intense urbanization, resulting in limited spaces for natural rainfall to infiltrate and increasing the number of floods (RAMALHO, 2007).
2.2. Data
This study utilized data of daily rainfall from rain gauges located in each of the municipalities in the ABC Paulista region during the period from 1972 to 2014. The data series was made available by the Department of Water and Electricity. Census data available from different sources were also used (detailed in Table I) for the construction of socioeconomic, urban-demographic, and sanitation indicators. These data provided information about different factors that influenced the condition of vulnerability of the ABC Paulista municipalities.
Creating composite indicators, as in the case of urban-demography, aimed to bundle census data that directly depicts demographic and urban characteristics of the region studied.
Components of socioeconomic indicator include housing, reflecting the possession of a set of durable consumer goods and the social and economic conditions for each municipality.
2.3. Methodology
In order to measure extreme rain events, climatic indices were calculated based on the methodology developed by the group of specialists from the Commission for Climato-logy World Climate Research Programme – Climate Variability and Predictability (CCl/ CLIVAR/JCOMM). These indices were created to objectively characterize the climatic variability in precipitation and temperature (ALEXANDER et al., 2005), and they have been utilized in research on variability and climate changes to define indicators of the occurrence of extreme events. This paper utilizes six indices: a) R50mm and R80mm, which calculate the number of days in each year with precipitation greater or equal to 50mm and 80mm respectively; b) the RX1day and RX5day indices, which identify the maximum total precipitation in 1 day and in 5 consecutive days respectively; c) the R95p and PRCPTOT indices, which identify the annual total of high rainfall days above the 95th percentile and annual rain accumulation respectively.
To analyze possible trends in a time series of the indices we applied the Mann--Kendall non-parametric test (KENDALL, 1975) and the Sen method (GILBERT, 1987). The Mann-Kendall test verifies the presence of an increasing or diminishing trend. The test assumes a null hypothesis (Ho) with no trend, and calculates a statistical Z-test where the Z-score indicates whether the trend is positive (Z>0) or negative (Z<0) or equal to the mean (Z=0). The Sen method utilizes a linear model to estimate the magnitude and direction of the trend (Q).
2.3.1 Evaluating Vulnerabilities
information from a complex reality in a single formation or unique value, permitting a comparison through space and/or time. The aggregation of diverse indicators has the advantage of incorporating a vast range of variables leading to a model that is broader than reality.
For this study, the following vulnerability indices were created for each of the mu-nicipalities in ABC Paulista: socioeconomic (IVse), demographic-urban (IVdu), sanitary (IVs) and climatic extremes (IVec). The IVse, IVdu, and IVs indices utilized the respective indicators described in Table I, and the IVec index utilized indicators of climatic extremes detailed in section 2.3. Prior to constructing the IVs, each indicator was standardized for values between 0 and 1. Standardization is necessary for making indicators with different units of measurements comparable. Thus, it was necessary to analyze each indicator in order to opt for one type of standardization, since the behavior of each indicator could contribute to different degrees of increase in vulnerability. There are two types of stan-dardization according to Vincent (2004): a) the highest value of an indicator corresponds to the lowest vulnerability (Type I), or b) the lowest value of an indicator corresponds to the lowest vulnerability (Type II). The following formulas were utilized:
MIN MAX O MAX p I I I I TypeI I − − = ) ( MIN MAX MIN O p I I I I TypeII I − − = ) ( (1) where Ip is the standardized value of each indicator, Io is the observed value of the indi-cator that is to be standardized and IMIN is the minimum and IMAX maximum among all indicators for all the municipalities.
Ultimately, we calculated a single IV called the index of aggregated vulnerability (IAV), which incorporated all the IVs derived previously through a weighted summation:
∑
==
4 1 i i iIV
w
IAV
(2)where IVi are the vulnerability indices: IV1= IVse, IV2= IVdu, IV3= IVs, IV4=IVec, and the
wi are the weights of each IVi. The following weights were attributed for each of the IVs established by specialists, according to Vincent (2004): w1= wse=0.2, w2= wdu=0.2, w3= ws=0.4 and w4= wec=0.2.
3. Results
3.1. Climatic indices for precipitation in ABC Paulista municipalities
The climatic indices estimated in this study are indicators of extreme occurrences of excessive rain. Table II shows the Mann-Kendall Z parameter and the 95th percentile
The R50mm and R80mm indices, which show the number of days per year in which precipitation is greater or equal to 50 mm and 80 mm respectively, are indicators of the frequency of days with moderate to strong rainfall. Rain with these intensities in the region of study can be linked to flooding, overflowing, and even landslides in areas that are more vulnerable to exposure to such precipitation.
The Civil Defense of São Bernardo do Campoii has established that slippage
generally occurs when total rainfall reaches 80mm in less than 3 days (72 hours). The Civil Defense of Santo Andréiii has established indicators for situations of risk from rain
intensity, including 100mm for rain accumulated in 72 hours (3 days) regarding landslides and 50mm of rain in one hour for risk of flooding and overflowing.
The R50mm index showed positive tendencies (increasing) in all municipalities. For the R80mm index, only São Caetano do Sul (SCS) and Ribeirão Pires (RP) showed a negative Z-score, indicating a diminishing trend. On the other hand, Mauá (MA) pre-sented the greatest value for the P95% percentile for R50mm e R80mm, evidencing that the greatest number of days of rainfall with these intensities occurred in this municipality.
The R95p index, which also characterizes the annual accumulation of days with high humidity, showed positive trends for almost all municipalities with Santo André (SA) and Mauá showing the greatest average annual increase. Yet, the maximum threshold (P95%) of R95p was detected in Mauá and Diadema (DIA), evidencing that the years with the most humid days during the period studied were registered in these municipalities. Conversely, the RX1day and RX5day indices are strong indicators of the occur-rence of overflows and landslides. Increasing trends for RX1day were only not observed in São Bernardo do Campo (SBC) and São Caetano do Sul (SCS). Yet, the RX5day index only did not show increasing trends in Santo André and São Caetano do Sul.
The Mauá municipality did not show any increasing or diminishing trends (Z=0). The greatest values of the P95% percentile for RX1day were for São Bernardo do Campo and Mauá, and for RX5day were for Diadema and Mauá.
The PRCPTOT index, which represents accumulated annual rainfall showed diminishing trends in almost all municipalities (except Santo André). São Bernardo do Campo showed the greatest decrease in rainfall, with the lowest negative Z parameter value. It is important to mention that the decrease in accumulated annual rainfall is not necessarily related to a decrease in the R80mm, R50mm, RX1day and RX5day indices, as demonstrated by their positive Z-values. Intense rain events that occur daily or in consecutive days can also happen in years where annual rainfall was less than average; that is, the rains can be concentrated in few and short periods of time and, thus, be so intense as to cause disasters.
Table II.Trends from Climatic Indices for Extreme Precipitation using Mann-Kendal (Z) Test for the ABC Paulista Region
Source: Elaborated by the author. ** significance at 0.05% / * significance at 0.01%
3.2. Calculation and analysis of vulnerability indices
The analysis of social, economic, demographic, urban, and sanitary factors of a municipality can reveal how exposed, susceptible, and helpless, a population may be to the impacts of an extreme rainfall event. For this reason, the diverse vulnerabilities are analyzed in this study in order to evaluate their interdependence.
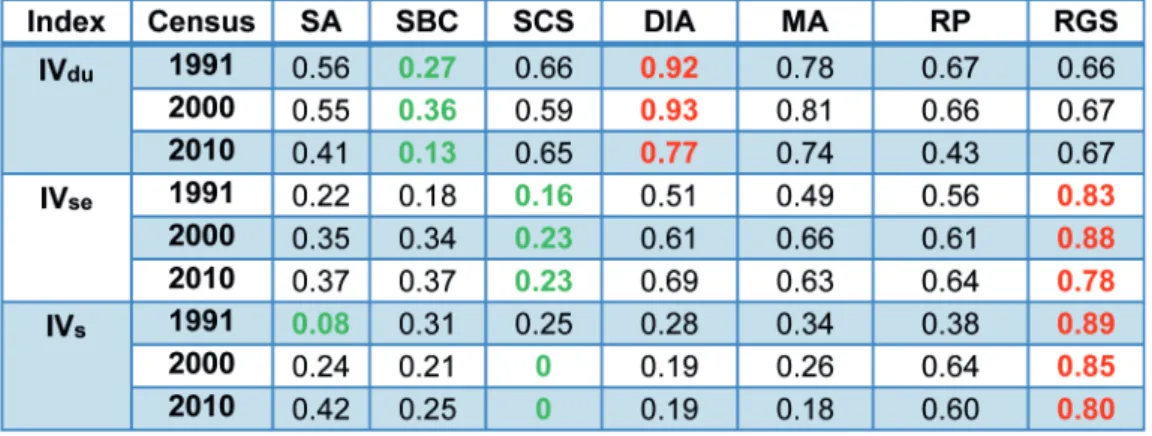
Thus, IVse, IVdu, and IVs were calculated utilizing indicators obtained from three censuses from the IBGE database (1991, 2000 and 2010) with the goal of observing the evolution of vulnerabilities. The indices with values closest to one (1) indicate high vulnerability and the closest to zero (0) indicate low vulnerability. Table III shows the results from indices for the three censuses and for each municipality in the ABC Paulista.
30 years, as shown in Figure 1a. According to the Basic Data Summary of Diademaiv, the
municipality is the second smallest city in the ABC Paulista region, with a 30.84 km² area, three times smaller than São Bernardo do Campo; nevertheless, it has a population density that 6.7 times greater. According to Pinheiro (2007), the main aspects of the process through which Diadema was populated include the implantation of industries and disorderly land use, which created accelerated urbanization during the 1970s and 1980s that reached growth rates of 20% per year. In the 2000s, the urban environment became consolidated with few empty areas for expansion and land use, but the peripheral neighborhoods still lacked necessary infrastructure (PINHEIRO, 2007).
The process of land occupancy in ABC Paulista was more accelerated in the mu-nicipalities of Diadema, São Caetano do Sul and Mauá, as a result of the migratory flow that was more intense in São Paulo state from the 1970s until 2000. In the course of the migratory flow, there were two important relationships “migration-industrialization” and “migration-employment,” the latter of which predominated in the 2000s (BAENINGER, 2005).
The evaluation of socioeconomic indicators showed that Rio Grande da Serra presented the greatest IVse value for all three censuses. This municipality presented the lowest average monthly family income per capita (Figure 1b), the highest rate of popula-tion in condipopula-tions of extreme poverty (Figure 1c), and the highest illiteracy rate. However, in the last census from 2010 the poverty rate had reduced by almost half in relation to the 2000 census, yet it remains higher when compared to other municipalities (Figure 1c). The least vulnerable municipality with the lowest IVse in the three censuses was the municipality of São Caetano do Sul (Table III).
Rio Grande da Serra is one of the newest municipalities in the ABC Paulista. The territory is classified as an urban area, despite having a vast area with vegetation. Today, the municipality has the least favorable social indicators out of all seven cities, suggesting that the population has high social vulnerability although it is an industrial region. Despite the public investments in the last fifteen years, Rio Grande da Serra continues to suffer the consequences of low municipal budgets and the inability to form its own industrial park, due to legislation that protects its watershed areas since the 1970s (NORONHA, 2015). In the context of its disadvantaged social and economic situation, Rio Grande da Serra also presented the highest IVs and followed by Ribeirão Pires as the second most vulnerable. The greatest problems in these municipalities related to the low level of sanitation service attendance (Figura 1d) and garbage disposal. Although the sanitation service has improved between the 1991 e 2000 censuses, there was little change between the 2000 e 2010 censuses (Figura 1d), and associated vulnerability remained high in rela-tion to the other municipalities.
Table III. Demographic-urban (IVdu), socioeconomic (IVse) and sanitary (IVs) indices for the ABC Paulista municipalities. Highest indices are in red, and lowest in green.
Source: Elaborated by the author
By contrast, São Caetano do Sul showed a IVs equal to 0 for the last two cen-suses. Santo André had an increase in the IVs over the three censuses analyzed, due to a considerable drop in percentage of water service. The universalization of water service involves a basic network of distribution and the treatment of water for each domicile in the municipality that has access to the water supply.v Santo André still faces problems
in its supply network to guarantee the distribution of potable water of sufficient quality and regularity as its population grows.
3.3. Index of climatic extremes vulnerability (IVec)
We used the climatic indices described in section 3.1 for the construction of the IVec, with consideration of the Mann-Kendal test Z parameter, the Sen method S parameter, the 95th percentile (P95%), and the frequency of years in which the indices were greater
or equal to the 95th percentile. The IV
ec was not calculated for Rio Grande da Serra, due
to the lack of historic rainfall data for this municipality. We verified that the highest value for the IVec corresponds to the municipality of Mauá (0.48) and the lowest to São Caetano do Sul (0.31) (Figure 3). The second highest IVec was attributed to the municipality of Diadema (0.46). The highest values of these municipalities relate to the sharper positive tendency for R80mm (Diadema and Mauá), RX1day (Mauá and Diadema), RX5day (Diadema) indices, and with the highest 95th percentile for R50mm (Mauá), R80mm
Figure 1. Evolution of the rates of population density (a), average household income per capita (b), poverty as percentage of population (c), level of sanitation service (d) of the ABC Paulista municipalities for the 1991, 2000 and 2010 censuses.
Source: Elaborated by the author. Data from IBGE censuses
2.4. Aggregated vulnerability index for climatic extremes (IAV)
For the construction of the IAV, we aimed to merge the IVse, IVdu, IVs and IVec into a single value that depicted the interdependence of socioeconomic, demographic-urban, and sanitation vulnerabilities with the climatic extremes vulnerability for each munici-pality in the ABC Paulista. To calculate the IAV, we used only the indices corresponding to the 2010 census. The municipality of Rio Grande da Serra was not included as it does not have historic rain data. The results for the aggregate index (Figure 2) were calculated considering the established weights (IAVp) in the methodology, as well as the weights equal to 1 (IAV). Both indices indicated that the municipality of Ribeirão Pires is the most vulnerable, followed by Diadema and Mauá.
By contrast, São Caetano do Sul received the lowest IAV, as a consequence of lower IVec, IVse and IVs values. Nevertheless, it is necessary to call attention to the municipality’s IVdu, which had the third highest value mainly by virtue of the high population density.
Figure 2 – Map of ABC Paulista region with the Climatic Extreme Vulnerability Index (IVec) and the Aggregated Vulnerability Index (IAV)
Source: Elaborated by the author
3. Final Remarks
actions that contribute to the perception of risks from disasters and to the reduction of vulnerability are fundamental for the development of public policy.
The calculation and analysis of the climatic indicators taken from daily rainfall showed increasing trends in the number of days with moderately intense rainfall (R50mm), and in the annual accumulation of high-humidity days (daily rainfall above the 95th
percentile) in almost all the municipalities. The municipalities of Mauá and Diadema presented the most accentuated increasing trends of moderately intense (50mm) and strong (80mm) daily rainfall. However, Mauá was highlighted as it presented the maximum values in almost all of the climatic indicators (above the 95th percentile).
The analysis of socioeconomic, demographic-urban, and sanitation vulnerabilities by way of calculating the IVse, IVdu, and IVs revealed different issues in the ABC Paulista municipalities. The Diadema municipality showed the greatest demographic-urban prob-lems, while Rio Grande da Serra stood out as the most vulnerable from the socioeconomic and sanitation point of view.
The evolution of the vulnerabilities, throughout the three periods analysis, evi-denced the increase in the IVse in Santo André, São Bernardo do Campo, Diadema and Ribeirão Pires. There was an observed increase in IVs by almost twofold between 2000 and 2010 in the municipality of Santo André. In addition, São Caetano do Sul also had a considerable increase in the IVdu during the same period.
By contrast, a reduction in the IVdu was detected in the municipality fo Ribeirão Pires, as well as in the IVs in São Caetano do Sul, Diadema, Mauá and Rio Grande da Serra. Although, Rio Grande da Serra experienced a reduction in vulnerability during the three periods studied, its vulnerability remains high in relation to the other municipalities.
Finally, the Aggregated Vulnerability Indices (IAV e IAVp) showed Ribeirão Pi-res, Diadema and Mauá as the three municipalities with highest values, and with little difference between them. For the IAVp, the difference was slightly larger between the municipalities of Ribeirão Pires and Diadema by virtue of the greater contribution of the IVs, which weighed heavier. However, among the three municipalities, Diadema and Mauá can be considered the most vulnerable to intense rainfall as they possess the highest IVec, in addition to the IVdu and IVse, which could increase the impact of rainfall in these municipalities if there are no policies that reducing these vulnerabilities.
Ribeirão Pires did not have a high IVec, but showed high sanitation and socioeco-nomic vulnerabilities. These factors could contribute to an increase in vulnerability if rain extremes intensify in this municipality. Increasing the level of water, sanitation, and garbage disposal service, should be prioritized by administrators. Impacts could reach beyond flooding and landslides, and aggravate the health of the population, as the poo-rest residents from a social and economic point of view are those that suffer the greatest consequences.
coin-cide helps orient public policies and the greatest commitments regarding the reduction of vulnerabilities, as well as measures to adapt and mitigate the impacts of extreme rainfall. Still, in the current context of intensifying climatic extremes and expanding urbanization in Brazil, identifying, measuring, and characterizing the vulnerability of population groups and their territories are essential for informing the design of urban public policies within newly established settings (ALVES, 2006).
Notes
i Convolution is a mathematic term that refers to concomitance and mutual conditioning - in this case between threat and vulnerability.
ii http://dcsbcsp.blogspot.com.br/2011/11/chuva-x-escorregamentos.html
iii http://www.semasa.sp.gov.br/protecao-e-defesa-civil/operacao-chuvas-de-verao/indicadores-de-chuva/ iv http://www.diadema.sp.gov.br/dmp/comunicacao/Comunicacao/Site2/sumario_miolo_20x26.pdf
v http://www.riograndedaserra.sp.gov.br/legis_pdf/2011%5CLei%201.909.doc%20-%20Anexo%20I%20-%20Plano%20 de%20Saneamento.pdf
vi http://www.planalto.gov.br/ccivil_03/_ato2007-2010/2007/lei/l11445.htm
4. Bibliographic References
ADGER, W. N. Vulnerability. Global Environmental Change v. 16, n. 3, p. 268-281, 2006. ALEXANDER, L. V. et al. Global observed changes in daily climatic extremes of tem-perature and precipitation. Journal of Geophysical Research, v. 111, p. 1-22, 2005. ALVES, H. P. F. Vulnerabilidade socioambiental na metrópole paulistana: uma análise sociodemográfica das situações de sobreposição espacial de problemas e riscos sociais e ambientais. Revista Brasileira de Estudos de População, São Paulo, v. 23, n. 1, p. 43-59, jan./jun. 2006.
ANAZAWA, T. M.; FEITOSA, F. F.; MONTEIRO, A. M. V. Vulnerabilidade socioeco-lógica nas áreas ocupadas nos municípios de Caraguatatuba e São Sebastião, litoral norte de São Paulo: medidas e representações. Revista Espinhaço, v. 3, n. 1, p.138-151, 2014. BAENINGER, R. São Paulo e suas migrações no final do século 20. São Paulo em Pers-pectiva. São Paulo , v. 19, n. 3, p. 84-96, set. 2005.
CARDONA, O. D. The need for rethinking the concepts of vulnerability and risk from a holistic perspective: a necessary review and criticism for effective risk management. In: BANKOFF, G.; FRERKS, G.; HILHORST, D. Mapping Vulnerability, Disasters, Development and People. London: Earthscan, 2004. p. 37-51.
COELHO, C. A. S.; CARDOSO, D. H. F.; FIRPO, M. A. F. Precipitation diagnostics of an exceptionally dry event in São Paulo, Brazil. Theorical and Applied Climatology. p. 1-16, July 2015.
CONSÓRCIO INTERMUNICIPAL GRANDE ABC. Consórcio Intermunicipal Grande ABC: 20 anos planejando e executando ações regionais. Revista Planejamento Estra-tégico. Disponível em: <http://www.consorcioabc.sp.gov.br/imagens/pagina/Revista%20 Planejamento%20Estrategico%20-%20Consorcio%20Intermunicipal%20Grande%20 ABC.pdf>. Acesso em: 19 abr. 2017.
CUTTER, S. L.; BORUFF, B. J.; SHIRLEY, W. L. Social vulnerability to environmental hazards. Social Science Quarterly, v. 84, n. 2, p. 242– 261, jun. 2003.
DINIZ, C. C.; CAMPOLINA, B. A região metropolitana de São Paulo: reestruturação, reespacialização e novas funções. EURE, Santiago de Chile, v.33, n. 98, pp. 27-43, Abr. 2007. Disponível em: <http://www.scielo.cl/pdf/eure/v33n98/art02.pdf>. Acesso em: 9 jul. 2015.
GILBERT, R. O. Statistical methods for environmental pollution monitoring. New York: Van Nostrand Rienhold Company Inc., 1987. 320 p.
HOGAN, D. J.; MARANDOLA, E. Towards an interdisciplinary conceptualization of vulnerability. Population, Space and Place, n. 11, p. 455-471, 2005.
GUTIERREZ, A. P.; ENGLE, N. L.; De NYS, E.; MOLEJÓN, C.; MARTINS, E. S. Drougth preparedness in Brazil. Weather and Climate Extremes, v.3, p. 95-106. 2014. INSTITUTO BRASILEIRO DE GEOGRAFIA E ESTATÍSTICA (IBGE).
IBGE Cidades. 2010. Disponível em: < <http://cidades.ibge.gov.br/xtras/ uf.php?lang=&coduf=35&search=sao-paulo>. Acesso em 14 out. 2015.
INTERGOVERNMENTAL PANEL ON CLIMATE CHANGE - IPCC, 2014: Sum-mary for policymakers. In:FIELD, C. B.; BARROS, V. R.; DOKKEN, D. J.; MACH, K. J.; MASTRANDREA, M. D.; BILIR, T. E.; CHATTERJEE, M.; EBI, K. L.; ESTRADA, Y. O.; GENOVA, R. C.; GIRMA, B.; KISSEL, E. S.; LEVY, A. N.; MACCRACKEN, S.; MASTRANDREA, P. R.; WHITE, L. L. (Eds.). Climate Change 2014: Impacts, Adaptation, and Vulnerability. Part A: Global and Sectoral Aspects. Contribution of Working Group II to the Fifth Assessment Report of the Intergovernmental Panel on Climate Change. Cambridge University Press, Cambridge, United Kingdom and New York, NY, USA. p. 1-32.
KENDALL, M. G. Rank correlation measures. London, UK: Charles Griffin, 1975. p. 220. MARANDOLA, E.; HOGAN, D. J. Vulnerabilidades e riscos: entre geografia e demografia.
Revista Brasileira de Estudos de População, v. 22, n. 1, p. 29-53, 2005.
MARANDOLA, E.; HOGAN, D. J. Vulnerabilidade do lugar vs. vulnerabilidade socio-demográfica: implicações metodológicas de uma velha questão. Revista Brasileira de Estudos de População, v. 26, n. 2, p. 161-181, 2009.
Ministério do Meio Ambiente. Caracterização do clima atual e definição das alterações climáticas para o território brasileiro ao longo do Século XXI. Brasília, 2007. Disponível em <http://www.grec.iag.usp.br/link_grec_old/outros/ambrizzi/relatorio5.pdf>. Acesso em: 15 jan. 2013.
MARENGO, J. A.; TOMASELLA, J.; ALVES, L.; SOARES, W. R.; RODRÍGUEZ, D. A. The Drought of 2010 in the context of historical drougths in the Amazon region.
Geophysical Research Letters. v. 38, 2011.
NORONHA, C. P. Os Pentecostais na “Periferia” da Periferia: O caso de Rio Grande da Serra, Município do Grande ABC Paulista. In: V CONGRESSO DA ANPTECRE: “Reli-gião, Direitos Humanos e Laicidade”, 2015, Curitiba. Anais... Curitiba, v. 05, p. ST0508. PELLING, M.; UITTO J. I. Small Island Developing States: natural disasters vulnerability and global change. Global Environmental Change, Part B Environmental Hazard, v.3, n.2, p.49-62, 2001.
PINHEIROS, S. S. Metrópole e políticas públicas: a centralidade difusa do município de Diadema. 2007. 85 f. Dissertação (Mestrado em Arquitetura e Urbanismo) - Univer-sidade Presbiteriana Mackenzie. Diadema - SP.
RAMALHO, D. Rio Tamanduateí – Nascente à Foz: percepções da paisagem e processos participativos. Paisagem Ambiente: ensaios. São Paulo, n. 24 p. 99 –114. 2007.
RYGEL, L.; O’SULLIVAN, D.; YARNAL, B. A method for constructing a social vulner-ability index: an application to hurricane storm surges in a developed country. Mitigation and Adaptation Strategies for Global Change, v.11, p.741-764. 2006.
SOUSA, J. R.; ALMEIDA, R. A. Vazante e enchente na Amazônia brasileira: impactos ambientais, sociais e econômicos. In: VI SEMINÁRIO LATINO-AMERICANO DE GEOGRAFIA FÍSICA, 2010, Coimbra – Portugal. Anais eletrônicos... Disponível em:
<http://www.uc.pt/fluc/cegot/VISLAGF/actas/tema4/jose_camilo.pdf>. Acesso em: 15 jan. 2016.
TIMMERMAN, P. Vulnerability, Resilience and the Collapse of Society. Environ-ment Monograph N°1, Institute for EnvironEnviron-mental Studies, University of Toronto, 1981. Disponível em: <http://www.ilankelman.org/miscellany/Timmerman1981.pdf>. Acesso em: 10 mar. 2016.
METEOROLOGIA, 2014, Recife. Anais eletrônicos … 2014.
VINCENT, K. Creating an index of social vulnerability to climate change for Africa. Tyndall Centre for Climate Change Research, Working Paper 56, ago. 2004.
Submitted on: 18/04/2016 Accepted on: 25/07/2017
Abstract: This study aimed to analyze the socio-economic, demographic, health and climatic vulnerabilities in the ABC Paulista region that comprises the municipalities of Santo André, São Caetano do Sul, São Bernardo do Campo, Mauá, Diadema, Rio Grande da Serra and Ribeirão Pires. The vulnerabilities were analyzed through the construction of indices based on the aggregation of indicators collected in the IBGE census and climate indices of extreme rainfall. The municipalities of Diadema and Mauá were identified as the most vulnerable areas to heavy rains, presenting an increasing trend of days with moderate and intense rainfall (50 mm and 80 mm). In addition, these municipalities pre-sented higher socio-economic and urban-demographic vulnerabilities, as a consequence of asymmetric social and economic development, poor environmental management and accelerated unplanned urbanization. Therefore, all these issues contributed to enhance the impact of heavy rains.
Key-words: Socio-economic vulnerability, ABC Paulista region, extreme rainfall
Resumo: Este trabalho teve como objetivo identificar as vulnerabilidades socioeconômicas, demográficas, sanitárias e de extremos de chuva na região do ABC Paulista, que compre-ende os municípios de Santo André, São Caetano do Sul, São Bernardo do Campo, Mauá, Diadema, Rio Grande da Serra e Ribeirão Pires. As vulnerabilidades foram analisadas por meio da construção de índices baseados na agregação de indicadores coletados nos censos do IBGE e índices climáticos de chuva extrema. Como resultado, identificaram-se os municípios de Diadema e Mauá como os mais vulneráveis às chuvas intensas e aos seus impactos, uma vez que houve a constatação de tendências de aumento na frequência de dias com chuvas moderada e intensa (50mm e 80mm). Tais localidades também apresenta-ram altas vulnerabilidades socioeconômica e demográfico-urbana, traduzidas em processos assimétricos de desenvolvimento econômico e social, saneamento ambiental deficiente e urbanização acelerada e não planejada, que contribuíram para potencializar os impactos das fortes chuvas.
Palavras-chaves: Vulnerabilidade socioeconômica, ABC Paulista, extremos de chuva.
THE INTERDEPENDENCE OF CLIMATE AND SOCIOECONOMIC
VULNERABILITY IN THE ABC PAULISTA REGION
demográficas, sanitarias y de extremos climáticos en la región del ABC Paulista. Esta re-gión está conformada por los municipios de Santo André, São Caetano, São Bernardo do Campo, Mauá, Diadema, Rio Grande da Serra y Ribeirão Pires. La vulnerabilidad de estos municipios fue analizada con base a diferentes indicadores obtenidos usando datos de los censos de IBGE e índices climáticos de lluvia. Los resultados apuntan que Diadema y Mauá son los más vulnerables ante las lluvias extremas por presentar tendencias positivas en la frecuencia de días con lluvia moderada e intensa (50mm a 80mm). Asimismo, se encontró que dichos municipios muestran vulnerabilidad socioeconómica y demográfico-urbana, que se refleja en procesos asimétricos de desarrollo económico y social, falta de saneamiento ambiental, urbanización rápida y no planificada, los cuales contribuyen a maximizar el impacto de las fuertes lluvias.