Predictors of early treatment discontinuation and
severe anemia in a Brazilian cohort of hepatitis C
patients treated with
fi
rst-generation
protease inhibitors
N. Miotto, L.C. Mendes, L.P. Zanaga, E.S.L. Goncales, M.S.K. Lazarini, M.N. Pedro,
F.L. Goncales Jr., R.S.B. Stucchi and A.G. Vigani
Divisão de Moléstias Infecciosas, Departamento de Clínica Médica, Faculdade de Ciências Médicas, Universidade Estadual de Campinas, Campinas, SP, Brasil
Abstract
The aim of this study was to determine risk factors for adverse events (AE)-related treatment discontinuation and severe anemia among patients with chronic hepatitis C virus (HCV) genotype 1 infection, treated with first-generation protease inhibitor (PI)-based therapy. We included all patients who initiated treatment with PI-based therapy at a Brazilian university hospital between November 2013 and December 2014. We prospectively collected data from medical records using standardized questionnaires and used Epi Info 6.0 for analysis. Severe anemia was defined as hemoglobinp8.5 mg/dL. We included 203 patients: 132 treated with telaprevir (TVR) and 71 treated with boceprevir (BOC). AE-related treatment discontinuation rate was 19.2% and anemia was the main reason (38.5%). Risk factors for treatment discontinuation were higher comorbidity index (OR=1.85, CI=1.05–3.25) for BOC, and higher bilirubin count (OR=1.02, CI=1.01–1.04) and lower BMI (OR=0.98, CI=0.96–0.99) for TVR.
Severe anemia occurred in 35 (17.2%) patients. Risk factors for this outcome were lower estimated glomerularfiltration rate (eGFR; OR=0.95, CI=0.91–0.98) for patients treated with TVR, and higher comorbidity index (OR=2.21, CI=1.04–4.67)
and ribavirin dosage (OR=0.84, CI=0.72–0.99) for those treated with BOC. Fifty-five (57.3%) patients treated with TVR and
15 (27.3%) patients treated with BOC achieved sustained virological response (SVR). Among patients who received TVR and interrupted treatment due to AE (n=19), only 26.3% (n=5) achieved SVR (P=0.003). Higher number of comorbidities, lower eGFR and advanced liver disease are associated with severe anemia and early treatment cessation, which may compromise SVR achievement.
Key words: Hepatitis C treatment; Protease inhibitor; Anemia; Adverse events; Treatment interruption
Introduction
Hepatitis C virus (HCV) infection is the leading cause of chronic liver disease and a major public health problem worldwide, affecting 1.1–2% of the global population
(1–3). The course of HCV infection and the fibrosis
progression rate varies extremely and is influenced by host, viral, and environmental factors (3–6). Patients with
chronic HCV infection are at increased risk of developing cirrhosis, hepatic decompensation, and hepatocellular carcinoma (7). Proper and effective antiviral treatment is associated with a reduction in portal hypertension, hepatic decompensation, hepatocellular carcinoma, liver trans-plantation, and liver-related mortality (3,4).
Since the discovery of the HCV in 1989, treatment options have improved. Interferon alfa (IFN-a) was thefirst
therapeutic option, with sustained virologic response (SVR) rates of 8–21% (8). Afterwards, therapy consisted
in IFN-a combined to ribavirin (RBV), which enhanced
SVR rates to 40%, and then pegylated IFN-a(PEG-IFN-a)
and RBV, with SVR rates of 42–52% (9–11). In 2010,
direct antiviral agents (DAA) became available; the first DAA were the protease inhibitors (PI) telaprevir (TVR) and boceprevir (BOC). These drugs are used in combination with PEG-IFN-aand RBV. The SVR among naive patients
treated with triple therapy based on TVR or BOC are 75% and 67–68%, respectively (12–16). More recently, new
DAA targeting protease, NS5A, and polymerase inhibitors allowed IFN-free effective regimens, with SVR rates above 90% (17,18).
Correspondence: N. Miotto:<miotto.noelle@gmail.com>
Adverse events (AE) are common in both IFN-a and
PEG-IFN-a-based regimens. First-generation PIs increase
the rates of certain AE such as anemia, pruritus, rash, gastrointestinal effects, and dysgeusia. Observational cohort studies outside the context of clinical trials demonstrated that AE rates are higher and tolerability of PI-regimens tend to be worse than reported in clinical trials, particularly for patients with comorbidities and cirrhosis (19,20). AE can lead to treatment discontinua-tion, which may compromise SVR achievement (19–21).
Treatment discontinuation rates due to AE in patients treated with RBV associated with IFN-a or PEG-IFN-a
were 10 and 12%, respectively (22,23). First-generation PI-based treatment discontinuation rates due to AE vary from 12 to 17% in clinical trials and from 12 to 29% in observational cohorts (19–21). Real-life studies
demonstrate that anemia is the most frequent adverse event responsible for PI-based treatment discontinuation (20,21).
Despite of the effectiveness and safety of new DAA, treatments involving these drugs are costly and are an economic burden for many countries. In these settings, first-generation PI-based triple therapy may be a treatment option for certain patients. On the other hand, high rates of serious AE leading to PI discontinuation remain an issue that could compromise treatment outcome. The aim of this study is to determine the risk factors for treatment discontinuation due to AE and severe anemia in a cohort of Brazilian patients treated with TVR- or BOC-based therapy.
Material and Methods
Patient enrollment and data collection
We included all patients with HCV genotype 1 chronic infection who started treatment with PEG-IFN-a, RBV, and
either TVR or BOC at Hospital de Clínicas, Universidade Estadual de Campinas, from November 2013 through December 2014. Treatment naive patients and patients that previously failed to PEG-IFN-a plus RBV treatment
were included. We excluded patients with HIV infection, detectable hepatitis B surface antigen, evidence of hepatic decompensation (ascites, encephalopathy, Child-Pugh B or C), and drug or alcohol abuse. This study was approved by the Ethics Committee of the Universidade Estadual de Campinas, and was conducted in accordance with the Helsinki Declaration.
We collected patient data after every clinical evalua-tion using standardized quesevalua-tionnaires that included demographic and anthropometric information, medical history, and data on HCV infection such asfibrosis hepatic stage, HCV viral loads, HCV genotype, and previous HCV treatment history. Chronic HCV infection was defined as the presence of HCV antibody (Abott AxSYM Anti-HCV 3.0; Abbott Laboratories, Germany) and detectable serum HCV RNA (Amplicor HCV 3, Roche Diagnostics Systems
Inc., USA). Presence of diabetes mellitus was determined according to the American Diabetes Association criteria (24). The severity of comorbidities was estimated using Charlson comorbidity index (CCI) (25). Hepatic histo-logical evaluation was graded and staged according to Metavir scoring system (26). The diagnosis of cirrhosis was made upon histological examination (Metavir stage F4), or a combination of characteristics that included clinical (history of ascites, encephalopathy or variceal bleeding), laboratorial (association of thrombocytopenia, hypoalbuminemia, hyperbilirubinemia, and prolonged pro-thrombin time), and imaging studies (splenomegaly, portal hypertension, and elastography compatible with Metavir stage F4).
Treatment was proposed to patients following standard practices and guidelines at the outpatient clinic, with-out influence from the study team. Patients received a combination of TVR or BOC, and PEG-IFN-a2a (180 mg)
or 2b (1.5 mg/kg) and RBV (weight-adjusted dose).
We performed a 4-week lead-in with PEG-IFN-aand RBV
prior to BOC. Lead-in phase for TVR was optional. 1125 mg of TVR was given twice a day, and 800 mg of BOC was administered 3 times a day, following meals. Changes in PEG-IFN-a and RBV dosages were documented and
PI dosage did not change during treatment.
Clinical evaluation and laboratory data tests were performed at baseline and every 4 weeks during treatment or more frequently, if needed. Serum biochemical and hematological analysis included glucose, hemoglobin (Hb), platelets, neutrophils, bilirubin, albumin, creatinine and prothrombin time. Estimated glomerularfiltration rate (eGFR) was calculated by Modification of Diet in Renal Disease formula (27). HCV viral loads were determined at baseline and treatment weeks 4, 8, 12, 24 and at follow-up 12 weeks after the end of treatment (SVR-12) using Amplicor HCV 3, Roche Diagnostics Systems Inc. We documented all reported AE and any clinically significant abnormalities throughout the treatment period that led to therapy cessation.
Anemia was defined as mild if Hb was between 10.1 and 12.9 g/dL in males and 10.1 and 11.9 g/dL in females; moderate, if Hb was between 8.6 and 10.0 g/dL, and severe, if Hb p8.5 g/dL. Anemia management included RBV dose reduction, use of erythropoiesis-stimulating agents, such as erythropoietin (EPO), and transfusion of packed red blood cell (PRBC). Information about use, dosage and timing of initiation of each strategy was recorded. Anemia management and discontinuation of PI or triple therapy was based on the discretion of the physicians attending each patient.
Statistical analysis
performed using chi-square, Fisher’s, and analysis of variation or Mann-Whitney, as appropriate. A Po0.05 was considered to be statistically significant. Variables with Po0.2 were selected for a backward logistic regression model to evaluate risk factors for severe anemia, treatment discontinuation due to AE and SVR rates. Results are reported as hazard ratios and 95% confidence interval (CI).
Results
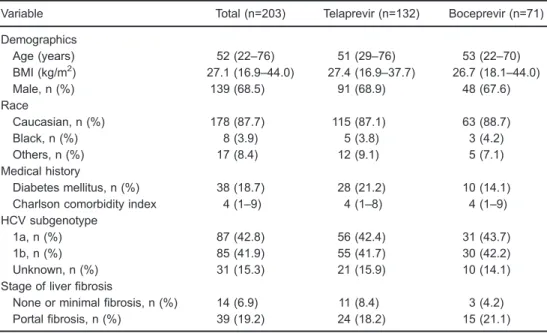
We included 203 patients treated with triple therapy based on TVR or BOC. Table 1 shows patients’ characteristics. Among all patients, median age was 52 years, most were male (68.5%) and Caucasian (87.7%). The majority of patients had experienced HCV-treatment (77.3%) and 49.8% had cirrhosis. Liver biopsy was performed in 187 patients; 16 patients had a combination of clinical, laboratory and imaging findings that were compatible with cirrhosis.
PI interruption due to AE
Overall, 39 (19.2%) of 203 patients had PI discon-tinued due to AE, which occurred in 24 (18.1%) of 132 patients treated with TVR and in 15 (21.1%) of 71 treated with BOC. Among patients treated with TVR, anemia was the main reason for PI discontinuation, occurring in 10 (41.6%) of 24 patients, followed by rash in 7 (29.2%), anorectal disorders in 4 (16.6%), cirrhosis decompensation
in 1 (4.1%), soft tissue infection in 1 (4.1%), and uncon-trollable vomiting in 1 (4.1%). Among patients treated with BOC, anemia was also the main reason that lead to PI discontinuation, occurring in 5 (37.5%) of 15 patients, followed by cirrhosis decompensation in 3 (20%), uncon-trollable vomiting in 2 (13.3%), rash in 1 (6.6%), and infection in 1 (6.6%). Three (20%) patients discontinued BOC due to other reasons.
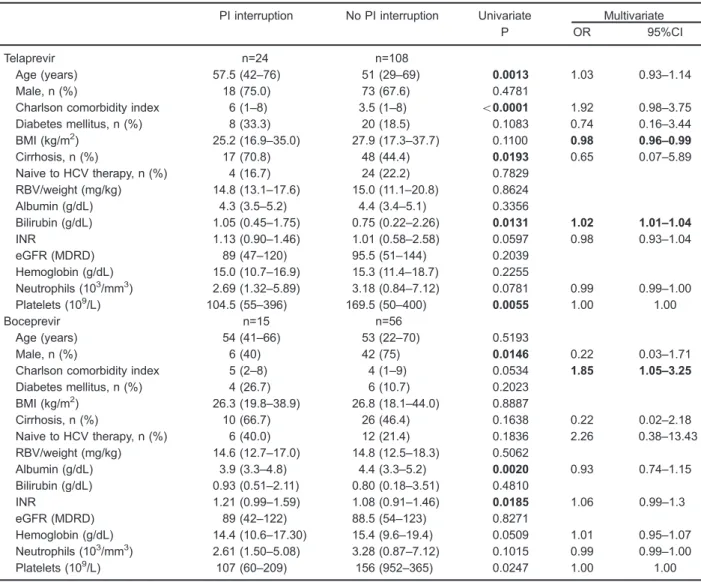
Table 2 shows univariate and multivariate analyses results of factors associated with PI discontinuation due to AE. Concerning patients treated with TVR, univariate analysis demonstrated that higher age, higher CCI, cirrhosis, higher bilirubin count, and lower platelet counts were associated with PI interruption. Multivariate analysis revealed that higher bilirubin count and lower BMI were associated with TVR discontinuation. Among those patients treated with BOC, univariate analysis showed that female gender, lower albumin count, and higher prothrombin international normalized ratio (INR) were associated with PI discontinuation due to AE. Higher CCI was associated with BOC discontinuation in multi-variate analysis.
Anemia
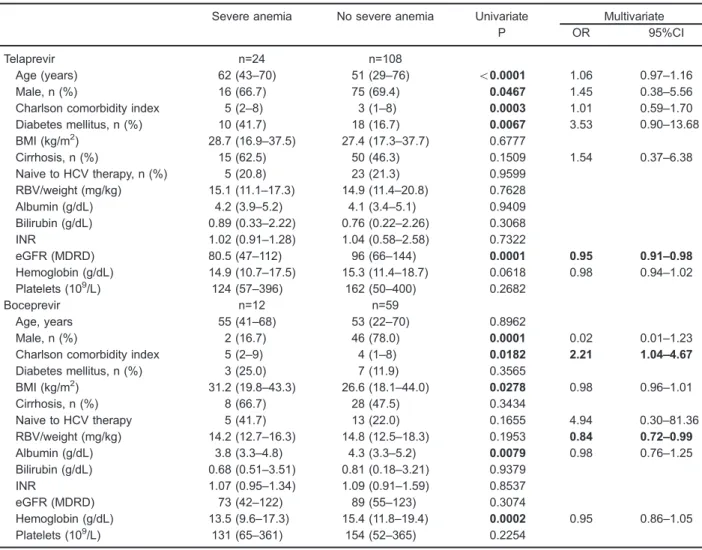
Anemia occurred during treatment in 187 (92.1%) patients and was classified as mild in 87 (42.9%), moderate in 65 (32%), and severe in 35 (17.2%). Table 3 illustrates factors associated with severe anemia. Among patients treated with TVR, older age, female gender,
Table 1.Baseline characteristics of hepatitis C infected patients treated with protease inhibitor telaprevir and boceprevir in Campinas, Brazil (n=203).
Variable Total (n=203) Telaprevir (n=132) Boceprevir (n=71)
Demographics
Age (years) 52 (22–76) 51 (29–76) 53 (22–70)
BMI (kg/m2) 27.1 (16.9
–44.0) 27.4 (16.9–37.7) 26.7 (18.1–44.0)
Male, n (%) 139 (68.5) 91 (68.9) 48 (67.6)
Race
Caucasian, n (%) 178 (87.7) 115 (87.1) 63 (88.7)
Black, n (%) 8 (3.9) 5 (3.8) 3 (4.2)
Others, n (%) 17 (8.4) 12 (9.1) 5 (7.1)
Medical history
Diabetes mellitus, n (%) 38 (18.7) 28 (21.2) 10 (14.1)
Charlson comorbidity index 4 (1–9) 4 (1–8) 4 (1–9)
HCV subgenotype
1a, n (%) 87 (42.8) 56 (42.4) 31 (43.7)
1b, n (%) 85 (41.9) 55 (41.7) 30 (42.2)
Unknown, n (%) 31 (15.3) 21 (15.9) 10 (14.1)
Stage of liverfibrosis
None or minimalfibrosis, n (%) 14 (6.9) 11 (8.4) 3 (4.2)
Portalfibrosis, n (%) 39 (19.2) 24 (18.2) 15 (21.1)
higher CCI, and diabetes mellitus were associated with development of severe anemia. Lower eGFR was associated with development of severe anemia in univariate analysis and multivariate logistic regression. Among patients treated with BOC, female gender, higher BMI, higher CCI, lower baseline albumin, and lower Hb count were associated with development of severe anemia. Higher CCI and higher baseline RBV dosage were associated with development of severe anemia at multivariate logistic regression.
Figure 1 shows changes in Hb in patients who develop or not severe anemia according to the two PI-based
treatments. Among patients treated with TVR, the median time to achieve severe anemia was 8 weeks and the median time to Hb nadir was 12 weeks. In patients treated with BOC, median time to achieve severe anemia and to Hb nadir was 12 weeks. Throughout treatment, Hb remained significantly lower in patients who developed severe anemia for both PI compared to patients who did not develop severe anemia. Strategies used for anemia management were RBV dose reduction [32 patients (15.8%)], EPO [15 (7.4%)], combination of EPO and RBV dose reduction [55 (27%)], EPO and PRBC transfu-sion [2 (0.9%)], RBV dose reduction and PRBC Table 2.Results of univariate and multivariate analyses of factors associated with protease inhibitor (PI) interruption due to adverse events, in patients with hepatitis C infection (n=203).
PI interruption No PI interruption Univariate Multivariate
P OR 95%CI
Telaprevir n=24 n=108
Age (years) 57.5 (42–76) 51 (29–69) 0.0013 1.03 0.93–1.14
Male, n (%) 18 (75.0) 73 (67.6) 0.4781
Charlson comorbidity index 6 (1–8) 3.5 (1–8) o0.0001 1.92 0.98–3.75
Diabetes mellitus, n (%) 8 (33.3) 20 (18.5) 0.1083 0.74 0.16–3.44
BMI (kg/m2) 25.2 (16.9–35.0) 27.9 (17.3–37.7) 0.1100 0.98 0.96–0.99
Cirrhosis, n (%) 17 (70.8) 48 (44.4) 0.0193 0.65 0.07–5.89
Naive to HCV therapy, n (%) 4 (16.7) 24 (22.2) 0.7829
RBV/weight (mg/kg) 14.8 (13.1–17.6) 15.0 (11.1–20.8) 0.8624
Albumin (g/dL) 4.3 (3.5–5.2) 4.4 (3.4–5.1) 0.3356
Bilirubin (g/dL) 1.05 (0.45–1.75) 0.75 (0.22–2.26) 0.0131 1.02 1.01–1.04
INR 1.13 (0.90–1.46) 1.01 (0.58–2.58) 0.0597 0.98 0.93–1.04
eGFR (MDRD) 89 (47–120) 95.5 (51–144) 0.2039
Hemoglobin (g/dL) 15.0 (10.7–16.9) 15.3 (11.4–18.7) 0.2255
Neutrophils (103/mm3) 2.69 (1.32–5.89) 3.18 (0.84–7.12) 0.0781 0.99 0.99–1.00
Platelets (109/L) 104.5 (55
–396) 169.5 (50–400) 0.0055 1.00 1.00
Boceprevir n=15 n=56
Age (years) 54 (41–66) 53 (22–70) 0.5193
Male, n (%) 6 (40) 42 (75) 0.0146 0.22 0.03–1.71
Charlson comorbidity index 5 (2–8) 4 (1–9) 0.0534 1.85 1.05–3.25
Diabetes mellitus, n (%) 4 (26.7) 6 (10.7) 0.2023
BMI (kg/m2) 26.3 (19.8–38.9) 26.8 (18.1–44.0) 0.8887
Cirrhosis, n (%) 10 (66.7) 26 (46.4) 0.1638 0.22 0.02–2.18
Naive to HCV therapy, n (%) 6 (40.0) 12 (21.4) 0.1836 2.26 0.38–13.43
RBV/weight (mg/kg) 14.6 (12.7–17.0) 14.8 (12.5–18.3) 0.5062
Albumin (g/dL) 3.9 (3.3–4.8) 4.4 (3.3–5.2) 0.0020 0.93 0.74–1.15
Bilirubin (g/dL) 0.93 (0.51–2.11) 0.80 (0.18–3.51) 0.4810
INR 1.21 (0.99–1.59) 1.08 (0.91–1.46) 0.0185 1.06 0.99–1.3
eGFR (MDRD) 89 (42–122) 88.5 (54–123) 0.8271
Hemoglobin (g/dL) 14.4 (10.6–17.30) 15.4 (9.6–19.4) 0.0509 1.01 0.95–1.07
Neutrophils (103/mm3) 2.61 (1.50–5.08) 3.28 (0.87–7.12) 0.1015 0.99 0.99–1.00
Platelets (109/L) 107 (60
–209) 156 (952–365) 0.0247 1.00 1.00
transfusion [3 (1.5%)] and the three strategies combined [29 (14.2%)]. Median time for first introduction of any anemia treatment was 8 weeks.
Sustained virological response
During the follow-up period, SVR-12 was available for 151 patients. Among these patients, median age was 51 years; most were male (70.4%), and Caucasian (88.7%). The majority of patients were HCV-treatment-experienced (74.8%) and 49.7% had cirrhosis. Ninety-six (63.6%) received TVR-based therapy and 55 (36.4%) received BOC.
SVR-12 rates were 57.3% (55) in the TVR group and 27.3% (15) in the BOC group. Among patients treated with TVR, SVR rates in 22 previously untreated, 36 relapsers,
and 25 non-responders were 81.8, 66.7 and 56.2%, respectively. SVR rates for the subgenotypes were 54.8% (42) for 1a, 56.4% (39) for 1b, and 15 patients were not subgenotyped. Considering fibrosis stage, SVR rate was 100% (9) for minimumfibrosis, 73.3% (15) for portalfibrosis, 55% (20) for bridgingfibrosis, and 46% (50) for cirrhosis. In patients treated with BOC, SVR rates in 15 previously untreated patients, 17 relapsers, and 18 non-responders were 46.6, 41.2, and 5.5%, respectively. Regarding the subgenotype, SVR rate was 25% (24) for 1a, 26.1% (17) for 1b, and 21.4% (15) for non-subgenotyped patients. Considering thefibrosis stage, SVR rate was 33.3% (3) for minimumfibrosis, 63.6% (11) for portalfibrosis, 28.6% (14) for bridging fibrosis, and 11.5% (26) for cirrhosis. Table 4 shows factors associated with SVR-12.
Table 3.Results of univariate and multivariate analyses of factors associated with severe anemia in a logistic regression model, in patients with hepatitis C infection (n=203).
Severe anemia No severe anemia Univariate Multivariate
P OR 95%CI
Telaprevir n=24 n=108
Age (years) 62 (43–70) 51 (29–76) o0.0001 1.06 0.97–1.16
Male, n (%) 16 (66.7) 75 (69.4) 0.0467 1.45 0.38–5.56
Charlson comorbidity index 5 (2–8) 3 (1–8) 0.0003 1.01 0.59–1.70
Diabetes mellitus, n (%) 10 (41.7) 18 (16.7) 0.0067 3.53 0.90–13.68
BMI (kg/m2) 28.7 (16.9
–37.5) 27.4 (17.3–37.7) 0.6777
Cirrhosis, n (%) 15 (62.5) 50 (46.3) 0.1509 1.54 0.37–6.38
Naive to HCV therapy, n (%) 5 (20.8) 23 (21.3) 0.9599
RBV/weight (mg/kg) 15.1 (11.1–17.3) 14.9 (11.4–20.8) 0.7628
Albumin (g/dL) 4.2 (3.9–5.2) 4.1 (3.4–5.1) 0.9409
Bilirubin (g/dL) 0.89 (0.33–2.22) 0.76 (0.22–2.26) 0.3068
INR 1.02 (0.91–1.28) 1.04 (0.58–2.58) 0.7322
eGFR (MDRD) 80.5 (47–112) 96 (66–144) 0.0001 0.95 0.91–0.98
Hemoglobin (g/dL) 14.9 (10.7–17.5) 15.3 (11.4–18.7) 0.0618 0.98 0.94–1.02
Platelets (109/L) 124 (57
–396) 162 (50–400) 0.2682
Boceprevir n=12 n=59
Age, years 55 (41–68) 53 (22–70) 0.8962
Male, n (%) 2 (16.7) 46 (78.0) 0.0001 0.02 0.01–1.23
Charlson comorbidity index 5 (2–9) 4 (1–8) 0.0182 2.21 1.04–4.67
Diabetes mellitus, n (%) 3 (25.0) 7 (11.9) 0.3565
BMI (kg/m2) 31.2 (19.8–43.3) 26.6 (18.1–44.0) 0.0278 0.98 0.96–1.01
Cirrhosis, n (%) 8 (66.7) 28 (47.5) 0.3434
Naive to HCV therapy 5 (41.7) 13 (22.0) 0.1655 4.94 0.30–81.36
RBV/weight (mg/kg) 14.2 (12.7–16.3) 14.8 (12.5–18.3) 0.1953 0.84 0.72–0.99
Albumin (g/dL) 3.8 (3.3–4.8) 4.3 (3.3–5.2) 0.0079 0.98 0.76–1.25
Bilirubin (g/dL) 0.68 (0.51–3.51) 0.81 (0.18–3.21) 0.9379
INR 1.07 (0.95–1.34) 1.09 (0.91–1.59) 0.8537
eGFR (MDRD) 73 (42–122) 89 (55–123) 0.3074
Hemoglobin (g/dL) 13.5 (9.6–17.3) 15.4 (11.8–19.4) 0.0002 0.95 0.86–1.05
Platelets (109/L) 131 (65–361) 154 (52–365) 0.2254
In the TVR group, univariate analysis showed that lower comorbidity index, no previous treatment, absence of cirrhosis, lower bilirubin, lower INR, higher Hb, and higher platelets counts at baseline were associated with higher SVR-12. Multivariate analysis revealed that no pre-treatment and lower INR at baseline were associated with higher SVR-12. Among patients who interrupted treatment due AE (19), only 5 (26.3%) achieved SVR (P=0.003). Among patients treated with BOC, absence of cirrhosis was associated with higher SVR-12 in univariate analysis. Multivariate logistic regression demonstrated that lower eGFR at baseline was associated to higher SVR 12. Only 23% (2) of patients who interrupted therapy due to AE (12) reached SVR (P=0.477).
Discussion
Our study investigated AE in an observational cohort of HCV infected patients and found that PI interruption due to AE occurred in 19.2% of patients. Treatment interrup-tion was associated with higher comorbidity index, lower BMI, and advanced liver disease. Seventeen percent of patients had severe anemia, which was the main reason for PI discontinuation. Lower eGFR, no prior history for HCV treatment and absence of cirrhosis was associated with higher chances of SVR.
Treatment discontinuation due to AE was higher in our study (19.2%) than in clinical trials for TVR and BOC (10–13 and 8–12%, respectively) which could be
explained by the higher proportion of patients with cirrhosis in our study (12–16). However, our AE-related treatment
discontinuation rate was similar to the CUPIC cohort (21%), where anemia was also the main reason for PI tion (21). Risk factors for AE-related treatment discontinua-tion were also consistent with other real-life cohorts, showing that patients with higher number of comorbidities and advanced liver disease are a difficult-to-treat popula-tion with higher chances of treatment interruppopula-tion due to AE (19,21,28,29). Among patients treated with TVR, advanced age and lower BMI was also a risk factor for treatment interruption due to AE (29). Since TVR has fixed dose, patients with lower body mass may have higher drug serum concentration, which may induce more severe AE. Female gender was associated with BOC-based treatment dis-continuation due to AE in univariate analysis. However, these data were not corroborated by other cohorts and need further investigation.
Severe anemia rates in our sample was slightly lower (17.2%) than in other reports (22.9–38%) (21,30,31).
This could be explained by our definition for severe anemia, which was considered when Hb counts were lower (p8.5 g/dL) than established by other authors (p8.9 andp10.0 g/dL) (30,31). Predicting factors for the development of severe anemia in multivariate logistic regression were lower eGFR for patients who received TVR, and higher CCI, and baseline RBV dosage for those treated with BOC. We also found that older age and presence of diabetes was associated with severe anemia among patients treated with TVR in univariate analysis, which is comparable to a previous observational cohort (31). Since renal clearance is the major mechanism for clearance of RBV, lower eGFR could lead to higher serum levels of RBV, which is associated with lower Hb levels (32). Presence of multiple comorbidities enhances the chances of multifactorial anemia, possibly contributing to the development of anemia in HCV-infected patients treated with first-generation PI-based regimens (33). These data suggest that patients with renal impairment, older age, and multiple comorbidities should have closer monitoring and early management for anemia to avoid complications such as treatment discontinuation and worsening of clinical status.
Several strategies for the management of anemia in patients receiving triple therapy based onfirst-generation PI exist. Since PI dosage cannot be reduced due to the risk of resistance development, RBV dose reduction is the main strategy used in the management of anemia in these patients. TVR registration trials prohibited the use of EPO for anemia management, although often experts recom-mend initiating EPO when Hb levels persist lower than 10 g/dL despite RBV dose reductions. Red blood cell transfusion is an option in the absence of response Figure 1. Mean hemoglobin in patients treated for chronic
to other measures or in the presence of clinical symptoms (12,33). The main strategy used in our study was RBV dose reduction associated with EPO, followed by RBV dose reduction alone and the association of the three strategies. Our rate of PRBC transfusion (34%) was slightly lower than reported in previous studies (40–48%),
probably because we used it as the last option in order to avoid transfusion-related complications (21,31). Our data show a trend for severe anemia development in patients with Hbp10.0 g/dL at week 4 as illustrated in Figure 1. Median interval for initiation of treatment for anemia
corresponded to the median time to achieve Hbp8.5 g/L (8 weeks), suggesting that early management is important to avoid development of severe anemia.
Overall SVR rate for TVR-treated patients in our study was 57.3%, which is comparable to other observational cohorts (52–60.8%) (34,35). A cohort with 208 treatment
naive patients receiving TVR or BOC showed SVR rates of 42% [36)]. Other real-life studies showed SVR rates around 50% (21,28,35). However, the SVR rate for patients treated with BOC in our study (27.3%) was higher than in these studies. The high proportion of Table 4.Results of univariate and multivariate analyses of factors associated with sustained virological response (SVR) in patients with hepatitis C infection (n=151).
SVR No SVR Univariate Multivariate
P OR 95%CI
Telaprevir n=55 n=41
Age (years) 51 (33–76) 54 (29–64) 0.5100
Male, n (%) 41 (74.5) 28 (68.3) 0.5002
Charlson comorbidity index 3 (1–8) 4 (1–8) 0.0174 0.90 0.62–1.32
Diabetes mellitus, n (%) 8 (14.5) 13 (31.7) 0.0506 0.70 0.16–3.03
BMI (kg/m2) 27.1 (18.5
–37.5) 27.2 (16.9–37.7) 0.9752
Cirrhosis, n (%) 23 (41.8) 27 (65.9) 0.0197 18.42 0.48–7.03
Naive to HCV therapy, n (%) 18 (32.7) 4 (9.8) 0.0129 5.29 1.34–20.87
RBV/weight (mg/kg) 14.9 (11.1–20.8) 15.0 (11.5–17.6) 0.5528
Albumin (g/dL) 4.4 (3.6–5.0) 4.3 (3.4–5.2) 0.5917
Bilirubin (g/dL) 0.75 (0.30–2.22) 0.88 (0.34–2.26) 0.0484 1.01 0.99–1.02
INR 1.00 (0.58–1.26) 1.11 (0.94–1.35) o0.001 0.90 0.84–0.96
eGFR (MDRD) 94 (51–144) 94 (47–142) 0.8055
Hemoglobin (g/dL) 15.3 (12.0–18.7) 15.1 (10.7–15.7) 0.0496 1.02 0.98–1.06
Neutrophils (103/mm3) 3110 (1390
–7120) 2710 (840–6740) 0.2327
Platelets (109/L) 169 (62–388) 131 (50–396) 0.0485 1.00 1.00–1.00
HCV RNA (103UI/mL) 844 (201
–9440) 848 (104–4905) 0.8163
Boceprevir n=15 n=40
Age (years) 54 (34–66) 52 (27–70) 0.4722
Male, n (%) 11 (73.3) 27 (67.5) 0.7542
Charlson comorbidity Index 3 (1–7) 4 (1–8) 0.1328 0.80 0.37–1.71
Diabetes, n (%) 2 (13.3) 5 (12.5) 1.0000
BMI (kg/m2) 25.4 (23.6–43.3) 27.0 (18.1–38.9) 0.9526
Cirrhosis, n (%) 3 (20.0) 23 (57.5) 0.0167 0.60 0.03–9.35
Naive to HCV therapy, n (%) 7 (46.7) 8 (20.0) 0.0861 9.96 0.88–1.12
RBV/weight (mg/kg) 15.8 (13.5–17.1) 14.6 (12.8–17.8) 0.0852 1.06 0.98–1.14
Albumin (g/dL) 4.6 (3.9–4.8) 4.2 (3.3–5.2) 0.0539 1.14 0.80–1.61
Bilirubin (g/dL) 0.68 (0.42–2.31) 0.90 (0.35–3.51) 0.1720 1.00 0.97–1.02
INR 1.02 (0.97–1.41) 1.11 (0.93–1.59) 0.0650 0.95 0.86–1.05
eGFR (MDRD) 82 (50–104) 90 (54–122) 0.0707 0.92 0.85–0.99
Hemoglobin (g/dL) 15.0 (9.6–16.9) 15.2 (10.6–18.5) 0.3110
Neutrophils (103/mm3) 3450 (2120–7120) 3125 (870–6860) 0.1388 1.00 0.99–1.00
Platelets (109/L) 186 (52
–361) 139 (58–365) 0.0682 1.00 1.00–1.00
HCV RNA (103UI/mL) 292 (5–3876) 726 (25–6895) 0.2971
patients considered difficult to treat (74.7% of prior non-responders, 75% of advancedfibrosis, and high number of comorbidities), and the relatively small number of patients in this group could explain these results. Two observational cohorts demonstrated that cirrhosis and prior treatment for HCV was associated with lack of SVR (28,35). Likewise, multivariate analysis in our cohort demonstrated that treatment-naive and lower baseline INR patients treated with TVR had higher chances of SVR. Among patients treated with BOC, lower eGFR was associated with SVR. This could be explained by the fact that lower eGFR could decrease drug clearance, exposing patients to higher doses. Lastly, treatment interruption due to AE was associated with lower chances of achieving SVR among TVR-treated patients, highlighting the impor-tance of predicting serious AE in order to allow more timely interventions, potentially reducing the risk of treatment cessation and poor outcome.
Limitations of our study include the population hetero-geneity and the relatively small number of patients treated with BOC. We also included patients treated at a single tertiary care outpatient clinic. Since it was an observa-tional study, PI group and strategies used in the manage-ment of anemia could not be compared in terms of outcomes. The strength of our study is its focus on
patients treated with DAA outside clinical registration trials. To our knowledge, this is thefirst study to evaluate predicting factors related to severe anemia and treatment discontinuation in Brazil. We demonstrated the relation-ship between lower eGFR, development of severe anemia and higher chances of SVR.
We believe that it is important to investigate AE and PI interruption rates to evaluate the limitations of first-generation PI-based treatment, and to consider the need for new DAA access. Furthermore, in many countries, new DAA are not extensively available and first-genera-tion PIs are accessible primarily to advanced fibrosis patients. Our findings support that this strategy may expose patients to higher rates of severe anemia, treatment discontinuation and lower SVR rates. In this setting, while new DAA are not universally available, specific cases of previously untreated young patients, with low fibrosis and comorbidity scores could possibly benefit from treatment with triple therapy that are still PEG-IFN-a/RBV based.
Acknowledgments
The authors would like to thank Alexandre Macedo de Oliveira for reviewing the manuscript.
References
1. Gower E, Estes C, Blach S, Razavi-Shearer K, Razavi H. Global epidemiology and genotype distribution of the hepatitis C virus infection.J Hepatol 2014; 61: S45–S57, doi: 10.1016/j.jhep.2014.07.027.
2. Bruggmann P, Berg T, Ovrehus AL, Moreno C, Brandao Mello CE, Roudot-Thoraval F, et al. Historical epidemiology of hepatitis C virus (HCV) in selected countries. J Viral Hepat2014; 21 (Suppl 1): 5–33, doi: 10.1111/jvh.12247. 3. Westbrook RH, Dusheiko G. Natural history of hepatitis C.
J Hepatol 2014; 61: S58–S68, doi: 10.1016/j.jhep.2014. 07.012.
4. Thein HH, Yi Q, Dore GJ, Krahn MD. Estimation of stage-specificfibrosis progression rates in chronic hepatitis C virus infection: a meta-analysis and meta-regression.Hepatology
2008; 48: 418–431, doi: 10.1002/hep.22375.
5. Abdelrahman T, Hughes J, Main J, McLauchlan J, Thursz M, Thomson E. Next-generation sequencing sheds light on the natural history of hepatitis C infection in patients who fail treatment. Hepatology 2015; 61: 88–97, doi: 10.1002/ hep.27192.
6. Marcellin P, Asselah T, Boyer N. Fibrosis and disease progression in hepatitis C.Hepatology2002; 36: S47–S56, doi: 10.1002/hep.1840360707.
7. Lingala S, Ghany MG. Natural history of hepatitis C. Gastro-enterol Clin North Am 2015; 44: 717–734, doi: 10.1016/ j.gtc.2015.07.003.
8. Lindsay KL. Therapy of hepatitis C: overview.Hepatology
1997; 26: 71S–77S, doi: 10.1002/hep.510260713. 9. Brillanti S, Garson J, Foli M, Whitby K, Deaville R, Masci C,
et al. A pilot study of combination therapy with ribavirin plus
interferon alfa for interferon alfa-resistant chronic hepatitis C.
Gastroenterology1994; 107: 812–817, doi: 10.1016/0016-5085(94)90131-7.
10. Manns MP, McHutchison JG, Gordon SC, Rustgi VK, Shiffman M, Reindollar R, et al. Peginterferon alfa-2b plus ribavirin compared with interferon alfa-2b plus ribavirin for initial treatment of chronic hepatitis C: a randomised trial.
Lancet2001; 358: 958–965, doi: 10.1016/S0140-6736(01) 06102-5.
11. Fried MW, Shiffman ML, Reddy KR, Smith C, Marinos G, Goncales FL Jr, et al. Peginterferon alfa-2a plus ribavirin for chronic hepatitis C virus infection.N Engl J Med2002; 347: 975–982, doi: 10.1056/NEJMoa020047.
12. Jacobson IM, McHutchison JG, Dusheiko G, Di Bisceglie AM, Reddy KR, Bzowej NH, et al. Telaprevir for previously untreated chronic hepatitis C virus infection. N Engl J Med 2011; 364: 2405–2416, doi: 10.1056/ NEJMoa1012912.
13. McHutchison JG, Manns MP, Muir AJ, Terrault NA, Jacobson IM, Afdhal NH, et al. Telaprevir for previously treated chronic HCV infection. N Engl J Med 2010; 362: 1292–1303, doi: 10.1056/NEJMoa0908014.
14. Poordad F, McCone J Jr, Bacon BR, Bruno S, Manns MP, Sulkowski MS, et al. Boceprevir for untreated chronic HCV genotype 1 infection.N Engl J Med2011; 364: 1195–1206, doi: 10.1056/NEJMoa1010494.
16. Zeuzem S, Andreone P, Pol S, Lawitz E, Diago M, Roberts S, et al. Telaprevir for retreatment of HCV infection.
N Engl J Med 2011; 364: 2417–2428, doi: 10.1056/ NEJMoa1013086.
17. Gutierrez JA, Lawitz EJ, Poordad F. Interferon-free, direct-acting antiviral therapy for chronic hepatitis C.J Viral Hepat2015; 22: 861–870.
18. Asselah T, Marcellin P. Optimal IFN-free therapy in treatment-naive patients with HCV genotype 1 infection.
Liver Int2015; 35 (Suppl 1): 56–64, doi: 10.1111/liv.12745. 19. Majid A, McAninch J, Morgan DJ, El Kamary SS, Zhan M,
Kapelusznik L, et al. Predictors of early treatment disconti-nuation in a cohort of patients treated with boceprevir-based therapy for hepatitis C infection.J Viral Hepat 2014; 21: 585–589, doi: 10.1111/jvh.12201.
20. Colombo M, Fernandez I, Abdurakhmanov D, Ferreira PA, Strasser SI, Urbanek P, et al. Safety and on-treatment efficacy of telaprevir: the early access programme for patients with advanced hepatitis C. Gut 2014; 63: 1150–1158, doi: 10.1136/gutjnl-2013-305667.
21. Hezode C, Fontaine H, Dorival C, Zoulim F, Larrey D, Canva V, et al. Effectiveness of telaprevir or boceprevir in treatment-experienced patients with HCV genotype 1 infec-tion and cirrhosis.Gastroenterology 2014; 147: 132–142, doi: 10.1053/j.gastro.2014.03.051.
22. Schalm SW, Hansen BE, Chemello L, Bellobuono A, Brouwer JT, Weiland O, et al. Ribavirin enhances the efficacy but not the adverse effects of interferon in chronic hepatitis C. Meta-analysis of individual patient data from European centers. J Hepatol 1997; 26: 961–966, doi: 10.1016/S0168-8278(97)80103-1.
23. Bagheri H, Fouladi A, Barange K, Lapeyre-Mestre M, Payen JL, Montastruc JL, et al. Follow-up of adverse drug reactions from peginterferon alfa-2b-ribavirin therapy. Pharmacother-apy 2004; 24: 1546–1553, doi: 10.1592/phco.24.16.1546. 50947.
24. American Diabetes Association. Diagnosis and classifi ca-tion of diabetes mellitus.Diabetes Care2010; 33: 562–569, doi: 10.2337/dc09-1524.
25. Charlson M, Szatrowski TP, Peterson J, Gold J. Validation of a combined comorbidity index. J Clin Epidemiol 1994; 47: 1245–1251, doi: 10.1016/0895-4356(94)90129-5. 26. Bedossa P. [Presentation of a grid for computer analysis
for compilation of histopathologic lesions in chronic viral hepatitis C. Cooperative study of the METAVIR group].Ann Pathol1993; 13: 260–265.
27. Levey AS, Greene T, Schluchter MD, Cleary PA, Teschan PE, Lorenz RA, et al. Glomerular filtration rate measure-ments in clinical trials. Modification of Diet in Renal Disease Study Group and the Diabetes Control and Complications
Trial Research Group. J Am Soc Nephrol 1993; 4: 1159–1171.
28. Butt AA, Yan P, Shaikh OS, Freiberg MS, Lo Re V III, Justice AC, et al. Virologic response and haematologic toxicity of boceprevir- and telaprevir-containing regimens in actual clinical settings. J Viral Hepat 2015; 22: 691–700, doi: 10.1111/jvh.12375.
29. Werner CR, Franz C, Egetemeyr DP, Beck R, Malek NP, Lauer UM, et al. First-generation protease inhibitor-triple therapy: SVR 24, safety, and predictors of response in a large single center cohort.Virol J2015; 12: 37, doi: 10.1186/ s12985-015-0261-0.
30. Zeuzem S, DeMasi R, Baldini A, Coate B, Luo D, Mrus J, et al. Risk factors predictive of anemia development during telaprevir plus peginterferon/ribavirin therapy in treatment-experienced patients. J Hepatol 2014; 60: 1112–1117, doi: 10.1016/j.jhep.2014.01.013.
31. Crismale JF, Martel-Laferriere V, Bichoupan K, Schonfeld E, Pappas A, Wyatt C, et al. Diabetes mellitus and advanced liver fibrosis are risk factors for severe anaemia during telaprevir-based triple therapy. Liver Int 2014; 34: 1018–1024, doi: 10.1111/liv.12342.
32. Hu CC, Weng CH, Lin CL, Tien HC, Kuo YL, Chien CH, et al. Predictors of changes in hemoglobin levels in patients with chronic hepatitis C treated with ribavirin plus pegylated interferon-alpha.Ren Fail2012; 34: 429–434, doi: 10.3109/ 0886022X.2011.650562.
33. Romero-Gomez M, Berenguer M, Molina E, Calleja JL. Management of anemia induced by triple therapy in patients with chronic hepatitis C: challenges, opportunities and recommendations. J Hepatol 2013; 59: 1323–1330, doi: 10.1016/j.jhep.2013.07.014.
34. Wehmeyer MH, Eissing F, Jordan S, Roder C, Hennigs A, Degen O, et al. Safety and efficacy of protease inhibitor based combination therapy in a single-center "real-life" cohort of 110 patients with chronic hepatitis C genotype 1 infection.BMC Gastroenterol2014; 14: 87, doi: 10.1186/ 1471-230X-14-87.
35. Backus LI, Belperio PS, Shahoumian TA, Cheung R, Mole LA. Comparative effectiveness of the hepatitis C virus protease inhibitors boceprevir and telaprevir in a large U. S. cohort. Aliment Pharmacol Ther 2014; 39: 93–103, doi: 10.1111/apt.12546.