ISSN 0100-879X
BIOMEDICAL SCIENCES
AND
CLINICAL INVESTIGATION
www.bjournal.com.br
www.bjournal.com.br
Volume 43 (12) 1135-1244 December 2010
Institutional Sponsors
The Brazilian Journal of Medical and Biological Research is partially financed by
Hotsite of proteomics metabolomics developped by:
Braz J Med Biol Res, December 2010, Volume 43(12) 1225-1231
doi: 10.1590/S0100-879X2010007500135
Gene trio signatures as molecular markers to predict response to
doxorubicin cyclophosphamide neoadjuvant chemotherapy in breast
cancer patients
Gene trio signatures as molecular markers
to predict response to doxorubicin
cyclophosphamide neoadjuvant
chemotherapy in breast cancer patients
M.C. Barros Filho
1, M.L.H. Katayama
1, H. Brentani
2, A.P.S. Abreu
3,
E.M. Barbosa
3, C.T. Oliveira
3, J.C.S. Góes
3, M.M. Brentani
1and
M.A.A.K. Folgueira
11Disciplina de Oncologia, Departamento de Radiologia e Oncologia, 2Departamento de Psiquiatria, Faculdade de Medicina, Universidade de São Paulo, São Paulo, SP, Brasil
2Hospital do Câncer A.C. Camargo, São Paulo, SP, Brasil 3Instituto Brasileiro de Controle do Câncer, São Paulo, SP, Brasil
Abstract
In breast cancer patients submitted to neoadjuvant chemotherapy (4 cycles of doxorubicin and cyclophosphamide, AC), expres-sion of groups of three genes (gene trio signatures) could distinguish responsive from non-responsive tumors, as demonstrated
by cDNA microarray profiling in a previous study by our group. In the current study, we determined if the expression of the same
genes would retain the predictive strength, when analyzed by a more accessible technique (real-time RT-PCR). We evaluated 28 samples already analyzed by cDNA microarray, as a technical validation procedure, and 14 tumors, as an independent biological
validation set. All patients received neoadjuvant chemotherapy (4 AC). Among five trio combinations previously identified, defined
by nine genes individually investigated (BZRP, CLPTM1, MTSS1, NOTCH1, NUP210, PRSS11, RPL37A, SMYD2,and XLHSRF-1), the most accurate were established by RPL37A, XLHSRF-1 based trios, with NOTCH1 or NUP210. Both trios correctly separated
86% of tumors (87% sensitivity and 80% specificity for predicting response), according to their response to chemotherapy (82%
in a leave-one-out cross-validation method). Using the pre-established features obtained by linear discriminant analysis, 71%
samples from the biological validation set were also correctly classified by both trios (72% sensitivity; 66% specificity). Further -more, we explored other gene combinations to achieve a higher accuracy in the technical validation group (as a training set). A new trio, MTSS1, RPL37 and SMYD2, correctly classified 93% of samples from the technical validation group (95% sensitivity
and 80% specificity; 86% accuracy by the cross-validation method) and 79% from the biological validation group (72% sensitivity and 100% specificity). Therefore, the combined expression of MTSS1, RPL37 and SMYD2, as evaluated by real-time RT-PCR, is a potential candidate to predict response to neoadjuvant doxorubicin and cyclophosphamide in breast cancer patients.
Key words: Breast neoplasms; Discriminant analysis; Doxorubicin; Drug resistance; Neoadjuvant therapy; Reverse
transcriptase-polymerase chain reaction
Introduction
Correspondence: M.A.A.K. Folgueira, Disciplina de Oncologia, Departamento de Radiologia e Oncologia, Faculdade de Medicina, USP, Av. Dr. Arnaldo, 455, 4º andar, Sala 4112, 01246-903 São Paulo, SP, Brasil. Fax: +55-11-3082-6580.
E-mail: [email protected]
Received May 17, 2010. Accepted October 22, 2010. Available online November 26, 2010. Published December 20, 2010.
A major benefit of primary chemotherapy in breast
cancer is the opportunity to increase breast-conserving surgery rates (1,2). However, for a more precise indication of this treatment, it is crucial to identify responsive and non-responsive patients. In this ideal situation, responsive patients, who might present a reduction in tumor dimen-sion, would be offered primary chemotherapy, while non-responsive patients, who might present stable or progressive
disease, would be offered breast surgery at once.
1226 M.C. Barros Filho et al.
Moreover, many studies have been carried out to
iden-tify a gene expression profile predictive of drug response
in breast cancer patients employing cDNA microarray (5-10) or RT-PCR techniques (11). Most investigators have
tried to detect expression profiles associated with patho -logical complete response (7-9,11), which is a surrogate marker for improved overall survival. Others, however,
have searched for expression profiles related to clinical response (5,6,10), which allow identification of patients who may benefit from tumor reduction and enhanced pos -sibility of breast-conserving surgery. Differential expression
profiles have been identified, and the response to various
regimens, based on anthracycline (5,8), taxanes (6) or both drugs (7,9-11), has been analyzed. Some of these studies included samples only in a training group (8,10), while others assessed the reproducibility of the model in an independent group of patients, regardless of the use of cross-validation analysis (5,6,9,11). In common, these stud-ies have employed the same technique (cDNA microarray or RT-PCR) to detect gene expression in both the training and validation groups.
We have identified predictive markers of the response
to neoadjuvant chemotherapy based on doxorubicin (5). Forty-four breast cancer patients submitted to neoadjuvant chemotherapy (AC) had tumor samples collected before treatment and their response was evaluated according to RECIST criteria. Tumor gene expression was evaluated by cDNA microarray and after an extensive search, 10 groups
of three genes (gene trio signatures) were identified, which
could separate responsive from non-responsive tumors
with high accuracy (spread error ≤0.05): PRSS11/CLPTM1/ MTSS1; PRSS11/SMYD2/MTSS1; XLHSRF-1/NOTCH1/ RPL37A; PRSS11/BZRP/MTSS1; XLHSRF-1/NUP210/ RPL37A; XLHSRF-1/NCKAP1/PHLDA3; AP3M1/PRSS11/ MTSS1; PRSS11/VAPB/MTSS1; XLHSRF-1/RPL37A/ TPM1; PRSS11/GCC1/MTSS1. Expression of one of these trios (PRSS11, CLPTM1, MTSS1) could properly group all the 31 samples of the training set with 100% correct
clas-sification upon the leave-one-out cross-validation, which is
a procedure to test the validity of class predictors (5-8). In addition, this trio could correctly classify 84.6% of the 13 samples from the validation set (91% sensitivity and 50%
specificity to predict tumor response) (5).
Our objective was to determine whether expression of some of these trios of genes, as evaluated by real-time
RT-PCR, which is a more accessible mRNA identification and quantification technique, would retain its predictive strength
to separate tumors according to response to primary che-motherapy based on doxorubicin and cyclophosphamide.
Patients and Methods
Patients
The study was approved by the local Ethics Committee of the Instituto Brasileiro de Controle do Câncer and Hospital
das Clínicas da Faculdade de Medicina da USP, São Paulo, and breast cancer patients, candidates for neoadjuvant chemotherapy on a routine basis, gave written informed consent to participate.
Twenty-eight patients whose samples had been studied by cDNA microarray in a previous study (5) had enough material available for the determination of gene expression by real-time RT-PCR and their samples were included in a technical validation group. Another 14 patients were prospectively accrued, and their tumors were analyzed in a biological validation group (Table 1).
Patients included in the technical and biological valida-tion groups presented mainly a locally advanced disease and were treated with 4 cycles of neoadjuvant doxorubicin and cyclophosphamide. There were no differences between groups, except for estrogen receptor immuno-expression, which was detected in a higher proportion of tumors from the technical validation group (Table 1).
Breast tumor dimension was evaluated by clinical
examination before the first cycle and approximately three
weeks after the last cycle of chemotherapy. Responsive patients were those whose tumor achieved a reduction of at least 30% of the longest diameter of the primary tumor (Table 1). Around 80% of patients from both technical and biological validation groups presented at least a partial response (Table 1). No association was detected between response to chemotherapy and menopausal status, clini-cal stage, histologiclini-cal type, histologiclini-cal grade, hormone receptor status, HER2 and P53 immuno-expression (data not shown).
RNA extraction, reverse transcription and real-time PCR
Tumor samples collected before chemotherapy were examined by light microscopy and hand dissected if neces-sary, to guarantee the presence of at least 80% invasive tumor cells. Total RNA was isolated using Trizol reagent (Invitrogen Corporation, USA). RNA quality was determined by ratio of absorbance at 260 and 280 nm (higher than 1.6)
and by 28S/18S rRNA band intensities, as verified by 1%
agarose gel electrophoresis under denaturing conditions and visualization through ethidium bromide (>1.5 ratio).
Total RNA (2 µg) was reverse transcribed using the oligo dT12-18 primer (GE Healthcare Life Sciences, UK)
and Superscript III (Invitrogen Corporation). Real-time RT-PCR was carried out using SYBR-green I (Sigma, USA) in a Rotor-gene system (Corbett Research, Australia). Primer sets were designed based on a coding region closer to the 3’ end of the gene, using Primer3 (http://frodo.wi.mit.edu/ cgi-bin/primer3/primer3_www.cgi) (Table 2). Sequences present in different exons, preferentially separated by long introns, were selected according to sequences deposited at http://www.ncbi.nlm.nih.gov/nucleotide. To avoid
nonspe-cific product formation, BLAST alignment analysis (http://
blast.ncbi.nlm.nih.gov/Blast.cgi) was carried out.
con-ditions were 95°C for 5 min, followed by 40 cycles at 95°C for 20 s, 60°C for 15 s and 72°C for 20 s. PCR assays were analyzed with the Rotor-Gene 6 System software (Corbett
Research). Average values were used for quantification
and cDNA obtained from a pool of breast samples was used as reference.
Reference gene selection and real-time RT-PCR normalization
Expression stability of four housekeeping genes, in-cluding ACTB (actin, beta), GUSB (glucuronidase, beta),
PPIA [peptidylprolyl isomerase A (cyclophilin A)], and
RPLP0 (ribosomal protein, large, P0) was determined in target samples using the geNorm software tool (available at http://medgen.ugent.be/~jvdesomp/genorm/). All candidate genes presented an M value below the 1.5 cut-off, indicat-ing a small variability of their expression among samples.
ACTB, PPIA and RPLP0 presented similar expression in responsive and non-responsive samples, whereas GUSB
was significantly less expressed in non-responsive samples
(P = 0.006, Mann-Whitney test), being excluded as a refer-ence gene from this analysis (data not shown).
The relative normalized expression ratio was calculated
from the real-time PCR efficiency and the crossing point de -viation of an unknown sample versus a control divided by the normalization factor, which was the geometric mean of the relative expression values of ACTB, PPIA and RPLP0.
Statistical analysis
Statistical analysis was performed using the SPSS 11.0 version software (SPSS, USA). Relative normalized
expres-sion data were first transformed to their natural logarithm (ln)
format and the Shapiro-Wilk test was performed to determine the distribution of the values. The results obtained by cDNA microarray and real-time RT-PCR were then compared us-ing the Spearman or Pearson correlation test, as
appropri-ate. The level of significance of the differential expression
between responsive and non-responsive samples was
determined by the Mann-Whitney test and a two sided P ≤ 0.05 value was considered to be significant.
Predictive models using gene expression values were designed using linear discriminant analysis. Gene sets showing greater accuracy in leave-one-out cross-validation analysis were further tested with samples from the biologi-cal validation group.
Results
We first determined whether there was a correlation between the mRNA quantification techniques (cDNA mi -croarray vs real-time RT-PCR) for the expression values of all nine genes studied. Samples from the technical validation group (N = 28) were used in this analysis, as their gene expression had already been evaluated by cDNA microarray.
A significant positive correlation between values was found
Table 1. Patient characteristics and response to neoadjuvant chemotherapy.
Characteristics Technical validation group(N = 28)
Biological validation group (N = 14)
P
Median age (years, min-max) 50 (32-67) 54 (27-70) 0.680a
Postmenopausal 50% (13/26) 69% (9/13) 0.254#
Clinical stage III 75% (21/28) 71% (10/14) 1.000* Breast lesion dimension (mm) (mean; min-max) 72 (20-300) 81 (40-150) 0.250b
IDC 82% (23/28) 79% (11/14) 1.000*
HG 3 22% (6/27) 36% (4/11) 0.432*
ER(+) 79% (22/28) 43% (6/14) 0.036*
PR(+) 50% (14/28) 43% (6/14) 0.690#
HER2(+) 19% (5/27) 36% (5/14) 0.267*
p53(+) 46% (11/24) 42% (5/12) 0.473#
LN(+) 64% (16/25) 38% (5/13) 0.133#
Median chemotherapy duration 70 days 72 days
Mean dose administered 97% 97%
Clinical responsec 1.000*
Complete or partial 82% 79%
Stable/progressive disease 18% 21%
IDC = invasive ductal carcinoma; HG 3 = histological grade 3; (+) positive; ER = estrogen receptor; PR = pro-gesterone receptor; HER2 = HER2 over-expression; p53 = p53 immunoexpression; LN = lymph node involve-ment. *Fisher exact test; #Pearson chi-square. The Kolmogorov-Smirnov test was applied followed by at-test
for parametric data or bMann-Whitney test for non-parametric data. cClinical response determined according to
1228 M.C. Barros Filho et al.
for NUP210 (nucleoporin 210 kDa; r = 0.484; P = 0.009), PRSS11 [protease, serine, 11 (IGF binding); r = 0.408; P
= 0.031], RPL37A [(ribosomal protein L37a); r = 0.505; P =
0.033], SMYD2 [(SET and MYND domain containing 2); r
= 0.434; P = 0.021], and a trend towards a correlation was
found for MTSS1 [(mammalian metastasis suppressor 1); r
= 0.360; P = 0.060] expression values (Pearson or Spear -man correlation test, as appropriate). Although there was no correlation between the two methods for the expression of BZRP (peripheral benzodiazepine receptor), CLPTM1
(cleft lip and palate-associated transmembrane protein-1),
NOTCH1 [Notch homolog 1, translocation-associated ( Dros-ophila)], XLHSRF-1 (heat shock regulated 1), no significant
negative correlation was detected. Among the correlated genes, RPL37A was the only one with significant differential
expression in both techniques for the same 28 samples, indicating lower expression in non-responsive than in re-sponsive tumors (cDNA microarray, P = 0.021 vs RT-PCR,
P = 0.011; Mann-Whitney test).
Our next step was to examine whether real-time RT-PCR expression values from these nine genes grouped into trios
could provide results similar to those obtained by cDNA microarray in separating responsive from non-responsive tu-mors, using linear discriminant analysis. Initially, we evaluated the three-dimensional distribution of tumors according to the
expression of five gene trios previously identified. Samples
from the technical validation group were used to generate the best separation plane to discriminate responsive from
non-responsive tumors. Among the five trios, the best sepa -ration of tumors was achieved by the RPL37A, XLHSRF-1
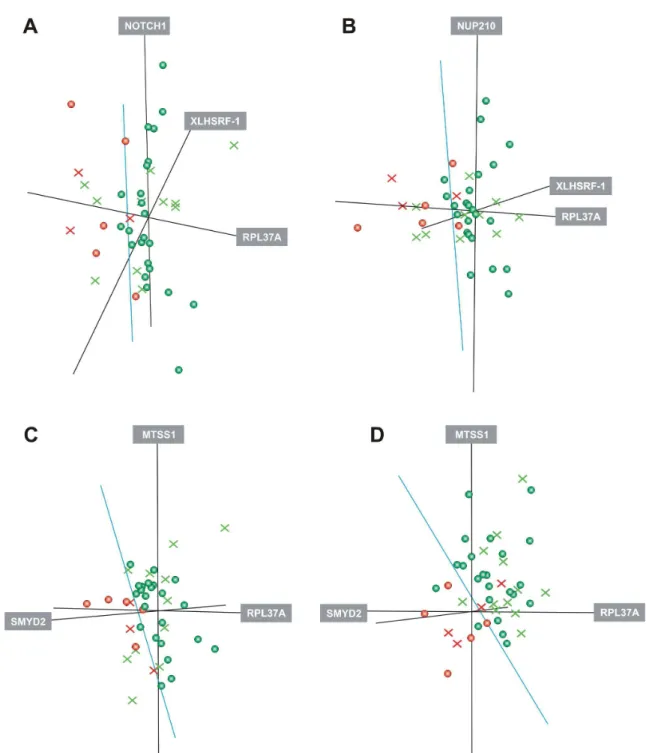
based trios (with NOTCH1 or NUP210, as third genes), which could correctly classify 86% (21/23 responsive) and 60% (3/5 non-responsive) of the technical validation group. In a cross-validation analysis (leave-one-out) 82% of samples maintained the adequate separation considering both gene trios (20/23 responsive and 3/5 non-responsive). Conversely, the other three trios presented less than 50% correct sample discrimination in cross-validation analysis. Next, samples from the biological validation group were spatially distributed using the pre-established features from these two trios, resulting in a 71% (8/11 responsive and 2/3 non-responsive) correct
classification by both of them (Figure 1A and B).
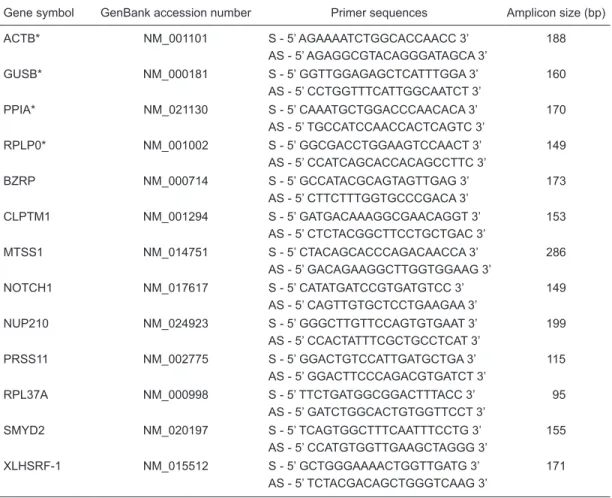
Table 2. List of primers.
Gene symbol GenBank accession number Primer sequences Amplicon size (bp)
ACTB* NM_001101 S - 5’ AGAAAATCTGGCACCAACC 3’ 188 AS - 5’ AGAGGCGTACAGGGATAGCA 3’
GUSB* NM_000181 S - 5’ GGTTGGAGAGCTCATTTGGA 3’ 160 AS - 5’ CCTGGTTTCATTGGCAATCT 3’
PPIA* NM_021130 S - 5’ CAAATGCTGGACCCAACACA 3’ 170 AS - 5’ TGCCATCCAACCACTCAGTC 3’
RPLP0* NM_001002 S - 5’ GGCGACCTGGAAGTCCAACT 3’ 149 AS - 5’ CCATCAGCACCACAGCCTTC 3’
BZRP NM_000714 S - 5’ GCCATACGCAGTAGTTGAG 3’ 173 AS - 5’ CTTCTTTGGTGCCCGACA 3’
CLPTM1 NM_001294 S - 5’ GATGACAAAGGCGAACAGGT 3’ 153 AS - 5’ CTCTACGGCTTCCTGCTGAC 3’
MTSS1 NM_014751 S - 5’ CTACAGCACCCAGACAACCA 3’ 286 AS - 5’ GACAGAAGGCTTGGTGGAAG 3’
NOTCH1 NM_017617 S - 5’ CATATGATCCGTGATGTCC 3’ 149 AS - 5’ CAGTTGTGCTCCTGAAGAA 3’
NUP210 NM_024923 S - 5’ GGGCTTGTTCCAGTGTGAAT 3’ 199 AS - 5’ CCACTATTTCGCTGCCTCAT 3’
PRSS11 NM_002775 S - 5’ GGACTGTCCATTGATGCTGA 3’ 115 AS - 5’ GGACTTCCCAGACGTGATCT 3’
RPL37A NM_000998 S - 5’ TTCTGATGGCGGACTTTACC 3’ 95 AS - 5’ GATCTGGCACTGTGGTTCCT 3’
SMYD2 NM_020197 S - 5’ TCAGTGGCTTTCAATTTCCTG 3’ 155 AS - 5’ CCATGTGGTTGAAGCTAGGG 3’
XLHSRF-1 NM_015512 S - 5’ GCTGGGAAAACTGGTTGATG 3’ 171 AS - 5’ TCTACGACAGCTGGGTCAAG 3’
Figure 1.A, Three-dimensional distribution of samples from technical and biological validation groups according to the expression of gene trios. A, RPL37A, XLHSRF-1, NOTCH1. B, RPL37A, XLHSRF-1, NUP210. C and D, RPL37A, SMYD2, MTSS1. A, B, C, D, The expression of gene trios was evaluated in samples from a technical validation group (N = 28, circles) and biological validation group
(N = 14, crosses). Expression values from samples of the technical validation (training) group were first used to generate a separation
plane (green line) between responsive (green) and non-responsive tumors (red), using linear discriminant analysis. Then, samples of the biological validation group were spatially distributed according to these pre-established features to determine the accuracy of the model. A and B, Gene trios previously identified in cDNA microarray analysis had their expression now evaluated by RT-PCR and these
1230 M.C. Barros Filho et al.
Since neither of these trios could discriminate samples with the same accuracy as in previous cDNA microarray analysis, we decided to search for other predictive trios, combining the real-time RT-PCR expression values of genes with at least a trend towards a positive correlation between techniques (MTSS1, NUP210, PRSS11, RPL37A, and SMYD2). Expression of RPL37A, SMYD2 and MTSS1
presented the highest accuracy, correctly separating 93% of
the technical validation group samples (22/23 responsive;
4/5 non-responsive) and 86% accuracy by cross-validation analysis (21/23 responsive and 3/5 non-responsive). This trio was further tested using samples from the biological validation group, which were spatially distributed using the
pre-established features, resulting in 79% proper classifica -tion (8/11 responsive and 3/3 non-responsive) (Figure 1C). Hence, this predictive model presented 72% sensitivity,
100% specificity, and positive and negative predictive values
of 100 and 50%, respectively, in discriminating responsive tumors from an independent sample group.
As this newly identified trio was not one of the top 10
trios detected by cDNA microarray analysis, we re-evaluated its strength in separating responsive from non-responsive samples from all 44 patients included in our previous study (5). cDNA microarray expression for the 28 patients included in the technical validation group (who had samples analyzed by both cDNA microarray and RT-PCR) was used to
delin-eate a separating plane, which correctly classified 89% of
the samples (21/23 responsive and 4/5 non-responsive). Cross-validation analysis also demonstrated 86% accu-racy (20/23 responsive and 4/5 non-responsive). Thus, using the same samples and gene expression evaluated by cDNA microarray, four samples were erroneously
clas-sified. However, only two of them were misclassified by
both RT-PCR and cDNA microarray analysis (one of them responsive and the other non-responsive). The remain-ing 16 samples of the 44 included in our previous study, which were analyzed only by cDNA microarray (there was not enough material available for RT-PCR analysis), were later included as another validation group. The median age of this group of patients was 46 years, 94% had invasive ductal carcinoma (75% ER+, 69% PR+ and 56% ErbB2+), clinical stage III disease (mean dimension of the primary tumor before chemotherapy: 82 mm), and 75% of them were considered to be responsive after treatment. In this new biological validation group of 16 patients, 81% of the samples were properly separated (11/12 responsive and 2/4 non-responsive) (Figure 1D). This model presented
92% sensitivity, 50% specificity, and positive and negative
predictive values of 85 and 67%, respectively, in discrimi-nating responsive tumors.
Discussion
We have performed a more comprehensive analysis
of tumor gene expression profile using cDNA microarray,
in which ten trios of genes presented high accuracy in dis-criminating samples according to drug response (5). We have determined whether expression of some of these trios could predict the response of canine mammary carcinomas using an in vitro tissue slice culture and RT-PCR assay. In this model, however, they could not predict in vitro respon-siveness to doxorubicin. In this case, inter-species genetic heterogeneity may have contributed to determining a diverse gene expression associated with tumor response (12).
In the present study, we observed that expression of the
same trios of genes previously identified and now evaluated
by real-time RT-PCR did not provide predictive informa-tion with the same accuracy as that obtained with cDNA microarray data, even when the same 28 samples (of 44) previously analyzed were used. This can be explained in
part by the fact that only one among the five trios included
all three genes (PRSS11, SMYD2 and MTSS1) with at least a trend towards a positive correlation, considering the expression values obtained by the two techniques (cDNA microarray and real-time RT-PCR).
This difficulty in reproducing gene expression profiles identified by cDNA microarray and real-time RT-PCR meth -odology has been reported by other investigators and a wide
range of validation rates, represented by significant positive
correlations between the techniques, was detected (34-71%) (5,6,13-16). This can be explained by disparieties in technical principles and normalization approaches between these two methods. Microarray data are frequently normal-ized globally, and therefore the expression levels of all genes are assumed to be constant among samples. Conversely, RT-PCR expression data are normalized by a much smaller number of reference genes (e.g., often only one), assumed to be constant, despite the fact that no single gene is ex-pressed at a constant level in all biological samples. Based on these observations, we took extreme care in choosing reference genes for RT-PCR in order to select those with stable expression among all cancer samples and between groups (response vs non-response).
Using RT-PCR expression values of the pre-selected
genes, we identified the RPL37A, SMYD2 and MTSS1 trio as a new, potential predictive marker. This discriminating power could represent the sum of effect of these three genes within the process of response to chemotherapy response. A higher expression of RPL37A and MTSS1 and a lower expression of SMYD2 contributed to graphic localization of responsive compared to non-responsive samples, using both procedures (cDNA microarray and RT-PCR). RPL37A
References
1. van der Hage JA, van de Velde CJ, Julien JP, Tubiana-Hulin M, Vandervelden C, Duchateau L. Preoperative chemotherapy in primary operable breast cancer: results from the European Organization for Research and Treatment of Cancer trial 10902.
J Clin Oncol 2001; 19: 4224-4237.
2. Bear HD, Anderson S, Brown A, Smith R, Mamounas EP, Fisher B, et al. The effect on tumor response of adding sequential preoperative docetaxel to preoperative doxorubicin and cy-clophosphamide: preliminary results from National Surgical Adjuvant Breast and Bowel Project Protocol B-27. J Clin Oncol
2003; 21: 4165-4174.
3. Jones RL, Salter J, A’Hern R, Nerurkar A, Parton M, Reis-Filho JS, et al. Relationship between oestrogen receptor status and proliferation in predicting response and long-term outcome to neoadjuvant chemotherapy for breast cancer. Breast Cancer Res Treat 2010; 119: 315-323.
4. Carey LA, Dees EC, Sawyer L, Gatti L, Moore DT, Collichio F, et al. The triple negative paradox: primary tumor chemosensitivity of breast cancer subtypes. Clin Cancer Res 2007; 13:
2329-2334.
5. Folgueira MA, Carraro DM, Brentani H, Patrao DF, Barbosa
EM, Netto MM, et al. Gene expression profile associated with
response to doxorubicin-based therapy in breast cancer. Clin Cancer Res 2005; 11: 7434-7443.
6. Chang JC, Wooten EC, Tsimelzon A, Hilsenbeck SG, Gutierrez
MC, Elledge R, et al. Gene expression profiling for the predic -tion of therapeutic response to docetaxel in patients with breast cancer. Lancet 2003; 362: 362-369.
7. Hannemann J, Oosterkamp HM, Bosch CA, Velds A, Wessels LF, Loo C, et al. Changes in gene expression associated with response to neoadjuvant chemotherapy in breast cancer. J Clin Oncol 2005; 23: 3331-3342.
8. Bertucci F, Finetti P, Rougemont J, Charafe-Jauffret E, Nasser
V, Loriod B, et al. Gene expression profiling for molecular char
-acterization of inflammatory breast cancer and prediction of
response to chemotherapy. Cancer Res 2004; 64: 8558-8565.
9. Hess KR, Anderson K, Symmans WF, Valero V, Ibrahim N, Mejia JA, et al. Pharmacogenomic predictor of sensitivity to
preopera-tive chemotherapy with paclitaxel and fluorouracil, doxorubicin,
and cyclophosphamide in breast cancer. J Clin Oncol 2006; 24:
4236-4244.
10. Park S, Shimizu C, Shimoyama T, Takeda M, Ando M, Kohno T,
et al. Gene expression profiling of ATP-binding cassette (ABC)
transporters as a predictor of the pathologic response to neoad-juvant chemotherapy in breast cancer patients. Breast Cancer Res Treat 2006; 99: 9-17.
11. Gianni L, Zambetti M, Clark K, Baker J, Cronin M, Wu J, et al.
Gene expression profiles in paraffin-embedded core biopsy
tissue predict response to chemotherapy in women with locally advanced breast cancer. J Clin Oncol 2005; 23: 7265-7277.
12. Sobral RA, Honda ST, Katayama ML, Brentani H, Brentani MM, Patrao DF, et al. Tumor slices as a model to evaluate doxorubicin in vitro treatment and expression of trios of genes PRSS11, MTSS1, CLPTM1 and PRSS11, MTSS1, SMYD2 in canine mammary gland cancer. Acta Vet Scand
2008; 50: 27.
13. Dallas PB, Gottardo NG, Firth MJ, Beesley AH, Hoffmann K, Terry PA, et al. Gene expression levels assessed by oligonucle-otide microarray analysis and quantitative real-time RT-PCR - how well do they correlate? BMC Genomics 2005; 6: 59.
14. Specht K, Harbeck N, Smida J, Annecke K, Reich U, Naehrig
J, et al. Expression profiling identifies genes that predict re -currence of breast cancer after adjuvant CMF-based chemo-therapy. Breast Cancer Res Treat 2009; 118: 45-56.
15. Koike Folgueira MA, Brentani H, Carraro DM, De Camargo Bar-ros FM, Hirata Katayama ML, Santana de Abreu AP, et al. Gene
expression profile of residual breast cancer after doxorubicin
and cyclophosphamide neoadjuvant chemotherapy. Oncol Rep
2009; 22: 805-813.
16. Folgueira MA, Brentani H, Katayama ML, Patrao DF, Carraro
DM, Mourao NM, et al. Gene expression profiling of clinical
stages II and III breast cancer. Braz J Med Biol Res 2006; 39:
1101-1113.
17. Miller WR, Larionov A, Renshaw L, Anderson TJ, Walker
JR, Krause A, et al. Gene expression profiles differentiating
between breast cancers clinically responsive or resistant to letrozole. J Clin Oncol 2009; 27: 1382-1387.
18. Huang J, Perez-Burgos L, Placek BJ, Sengupta R, Richter M, Dorsey JA, et al. Repression of p53 activity by Smyd2-mediated methylation. Nature 2006; 444: 629-632.
19. Parr C, Jiang WG. Metastasis suppressor 1 (MTSS1) demon-strates prognostic value and anti-metastatic properties in breast cancer. Eur J Cancer 2009; 45: 1673-1683.
20. Fan C, Oh DS, Wessels L, Weigelt B, Nuyten DS, Nobel AB, et al. Concordance among gene-expression-based predictors for breast cancer. N Engl J Med 2006; 355: 560-569.
suppressor protein and participates in the assembly of actin
filaments. Its negative regulation correlates with prolifera -tion, adhesion loss and invasion and a higher breast tumor expression of MTSS1 was correlated with increased patient overall survival and disease-free survival (19).
Although the RPL37A, SMYD2, MTSS1 trio does not
overlap with other identified predictive gene expression pro
-files, we believe that a wide range of gene combinations can
be used to predict tumorresponse to chemotherapy.
Accord-ingly, differential profiles have been shown to identify samples
with the same prognosis, indicating that various gene groups
can distinguish specific tumor behaviors (20).
In conclusion, expression of the RPL37A, SMYD2,
MTSS1 gene trio,as evaluated by RT-PCR, is a potential candidate for a predictive marker of response to neoadjuvant AC chemotherapy in breast cancer patients.