Revista Brasileira de Hematologia e Hemoterapia
Brazilian Journal of Hematology and Hemotherapy
w w w . r b h h . o r g
Original article
Murine leukemia virus-derived retroviral vector
has differential integration patterns in human cell
lines used to produce recombinant factor VIII
Marcela Cristina Correa de Freitas
∗, Aparecida Maria Fontes,
Andrielle de Castilho Fernandes, Virginia Picanc¸o-Castro, Elisa Maria de Sousa Russo,
Dimas Tadeu Covas
Universidade de São Paulo (USP), Ribeirão Preto, SP, Brazil
a r t i c l e
i n f o
Article history:
Received 16 August 2013 Accepted 1 January 2014 Available online 13 April 2014
Keywords: Factor VIII Virus integration Hemophilia A
a b s t r a c t
Objective:Nowadays recombinant factor VIII is produced in murine cells including in Chi-nese hamster ovary (CHO) and baby hamster kidney cells (BHK). Previous studies, using the murine leukemia virus-derived retroviral vector pMFG-FVIII-P140K, modified two recom-binant human cell lines, HepG2 and Hek293 to produce recomrecom-binant factor VIII. In order to characterize these cells, the present study aimed to analyze the integration pattern of retroviral vector pMFG-FVIII-P140K.
Methods:This study used ligation-mediated polymerase chain reaction to locate the site of viral vector integration by sequencing polymerase chain reaction products. The sequences were compared to genomic databases to characterize respective clones.
Results:The retroviral vector presented different and non-random profiles of integration between cells lines. A preference of integration for chromosomes 19, 17 and 11 was observed for HepG2FVIIIdB/P140K and chromosome 9 for Hek293FVIIIdB/P140K. In genomic regions such as CpG islands and transcription factor binding sites, there was no difference in the integration profiles for both cell lines. Integration in intronic regions of encoding protein genes (RefSeq genes) was also observed in both cell lines. Twenty percent of integrations occurred at fragile sites in the genome of the HepG2 cell line and 17% in Hek293.
Conclusion: The results suggest that the cell type can affect the profile of chromosomal integration of the retroviral vector used; these differences may interfere in the level of expression of recombinant proteins.
© 2014 Associac¸ão Brasileira de Hematologia, Hemoterapia e Terapia Celular. Published by Elsevier Editora Ltda. All rights reserved.
∗ Corresponding author at: Av. Tenente Catão Roxo, 2501 – Monte Alegre, Hemocentro de Ribeirão Preto – FMRP/USP, 14051-140 Ribeirão Preto, SP, Brazil.
E-mail address:[email protected](M.C. Correa de Freitas).
http://dx.doi.org/10.1016/j.bjhh.2014.03.002
Introduction
Hemophilia A is an X-linked bleeding disorder caused by the absence or abnormality of factor VIII (FVIII), a cofactor necessary to generate fibrin. Deficiency of FVIII is the most common coagulation disorder with an incidence of approx-imately one in 5000 men; it currently affects about 400,000
people worldwide.1,2 Intravenous administration of
plasma-derived or recombinant FVIII (rFVIII) protein is the most accepted treatment for bleeding episodes in hemophilic patients.
The production of recombinant FVIII by biopharmaceuti-cal industries mostly uses murine cell lines such as Chinese hamster ovary cells (CHO) and baby hamster kidney cells (BHK) with many studies having shown the efficacy and
safety of these strains.3–5 However, there are some human
pattern post-translational modifications which the murine cell lines are not able to emanate as these cells do not
present the necessary cellular machinery.6,7 An alternative
would be to use human cell lines capable of performing the post-translational modifications that occur in the human
body.7
FVIII is one of the most complex proteins produced by recombinant DNA technology. Although recombinant coag-ulation factor products have been available in the market
for 20 years,8–10 the heterologous expression of FVIII still
presents some problems such as: gene size, low mRNA expression, and low protein secretion as most is trapped in the endoplasmic reticulum. Moreover, all currently approved recombinant products are produced using murine cells that have a non-human pattern of post-translational modifica-tions.
This work generated two human cell lines: HEK293, derived from kidney, and HepG2, derived from liver tissues which were genetically modified using a new retroviral vector derived from the murine leukemia virus (MLV). The pMFG-FVIII-P140K vec-tor contains the human FVIII gene with the B domain deleted and the selection marker gene (P140K) that confers resistance
to the drugs, O6-benzylguanine and temozolomide. With this
system, high levels of recombinant FVIII were produced in HepG2 cells (8 IU/mL).
Selecting a human cell line with high productivity of recombinant FVIII is the first step in the future production of a recombinant protein more similar to that produced by the human body with a resulting low risk of inhibitory anti-body development, thereby providing a better quality of life for hemophiliac patients.
The goal of this study was to characterize and map the inte-gration sites of this new vector in two human cell lines. Highly sensitive ligation-mediated polymerase chain reaction (LM-PCR) was combined with sequencing to identify integration patterns of a MLV vector carrying rFVIII. In this work, a detailed mapping of integration sites of the human cell expression of recombinant FVIII was performed using a very stringent selection method. Analyses are very important to understand the behavior of these viral vectors and whether their inte-gration sites can influence the expression of recombinant proteins.
Methods
Cell lines and retroviral vector
Human hepatocellular carcinoma cell (HepG2 – ATCC num-ber HB-8065) and human embryonic kidney cell lines (Hek293 – ATCC number CRL-1573) were transduced with a retro-virus vector (pMFG-P140K) that contains elements derived from the Moloney murine leukemia virus (MoMuLV). This is a bicistronic vector, which can express the P140K resistance gene and the human B-domain-deleted FVIII coagulation fac-tor. Stable recombinant human FVIII-producing cell lines were obtained by highly stringent O6-benzylguanine and temo-zolomide treatment. The rFVIII expressing cells were named HepG2FVIIIdB/P140K and Hek293FVIIIdB/P140K.
Factor VIII activity quantification
Supernatants were harvested and analyzed for FVIII expres-sion using a one-stage clotting assay (activated partial thromboplastin time – aPTT). The FVIII concentrations are given as international units (IU) as defined by the World Health Organization; 1 IU/mL FVIII is equivalent to 200 ng/mL. Briefly,
a test sample of 100L of FVIII-deficient plasma (Biomerieux,
Durham) was incubated at 37◦C with 100
L of the APTT
reagent (Platelin® LS – Biomerieux). Clotting was initiated
by the addition of 100L 25 mM CaCl2 and clotting times
were determined using the COAG-A-MATE device (Organon Teknika).
Ligation-mediated polymerase chain reaction
Integration sites were cloned by LM-PCR as previously
described.11Briefly, genomic DNA was extracted from 3×10⁶
cells digested with MseI and SacI to prevent amplification of
internal 5′ long terminal repeat (LTR) fragments, and bound
to a MseI double-strand linker. LM-PCR was performed with
nested primers specific for the LTR and the linker.11 PCR
products were shotgun-cloned by the TOPO TA cloning kit (Invitrogen) into libraries of integration junctions which were sequenced to saturation.
Sequence analysis
The sequences generated were subjected to an initial anal-ysis using the ChromasPro computer program. In this first stage, only the sequence that contained the adapter sequence (linker) at one end and the sequence related to the retro-viral LTR at the other end were selected. The sequences were converted into Fasta format and sent to the Human Genome
BLAT database12 to analyze the homology of the human
genome. Only sequences that showed over 95% homology with sequences stored in the database were considered.
Then, sequences were submitted to analysis using the
pub-lic Quickmap tool,13which allows detailed mapping of local
integration of the retroviral vector.14This tool analyzes a wide
Table 1 – Biological activity of recombinant FVIII in HepG2FVIIIdB/P140K and Hek293FVIIIdB/P140K cell lines.
Sample IU/mL
DMEM medium 0.01
Supernatant HepG2 (non-transduced) 0.04
Supernatant Hek293 (non-transduced) 0.12
Supernatant HepG2FVIIIdB/P140K 7.90
Supernatant Hek293FVIIIdB/P140K 2.10
of±250 kb around the vector integration site. Moreover, the strands on either side were analyzed separately and the indi-vidual distance of each feature to the base of integration was calculated in base pairs.
Statistical analysis
As described by Laufs et al. in 2006, in order to test whether the number of integrations is equally distributed along the chromosomes, the chi-squared goodness-of-fit test was used to analyze whether the observed number of integrations (oi) arose from a multinomial distribution with specified expected integrations (ei) for the 24 chromosomes (22 autosomes as well as the sex chromosomes, X and Y). The differences obtained were highly significant as evidenced by the retroviral inser-tion site in chromosome score (RISC) defined as: (oi−ei)2/ei
values [oi < ei then RISC score×(−1)].15,16For the detection of
preferred genomic integration sites a cut-off of (oi−ei)2/ei = 3
was set.
Fisher’s exact test was used to determine whether there is an association between the integrations and the TFBS or CpG
island regions in the two cell lines (p-value≤0.05).
Results
Activity analysis of biologically active recombinant factor VIII
For the characterization of recombinant cell lines, rFVIII activ-ity levels were determined as previously detailed.
As shown in Table 1, the HepG2FVIIIdB/P140K and
Hek293FVIIIdB/P140K cell lines showed high secretion of biologically active recombinant FVIII (about 7.9 IU/mL and 2.1 IU/mL, respectively).
Chromosomal integration pattern
A total of 422 clones were sequenced of which 201 were derived from HepG2FVIIIdB/P140K and 221 from Hek293FVIIIdB/P140K cells. Of these, 302 (71.56%) sequences were found in the
human DNA database with identities≥98% (123 from HepG2
and 179 from Hek293 cell lines). The integration sites were sequenced to saturation; these sites began to repeat sub-sequent to the integrations described here. DNA sequences
were submitted to an analysis using the Quickmap tool,12
which classifies sequences as ‘true’ when they are homol-ogous to only one place in the human genome, or ‘false’ when sequences are ambiguous, i.e. they are homologous to more than one location in the genome. Of the 123
HepG2FVIIIdB/P140K sequences, 73 were considered true whereas the remaining 50 were ambiguous. For the 179 Hek293FVIIIdB/P140K sequences, 64 were true and 115 were ambiguous.
HepG2/FVIIIdBP140K clone sequences showed that inte-grations occurred in 18 of 23 chromosomes with preference for specific chromosomes. For these cells, 19% of the inte-grations occurred within chromosome 19, followed by 16% within chromosome 17 and 9.6% within chromosome 11. For the Hek293FVIIIdB/P140K cells, insertions affected 20 of the 23 chromosomes, with high frequencies of integrations occurring
within chromosomes 9 (14%) and X (9%) (Figure 1A).
Statistical analysis of the number of integrations observed versus expected number of integrations is given by the RISC score. Using a cut-off of 3, the profiles of integration of retroviral vectors are not random and differ between the cells studied. For the HepG2 cell line there was a preference for chromosomes 19 (RISC = 94.28), 17 (RISC = 49.28) and 11 (RISC = 3.44), and for the HEK293 cell line, a preference for
chro-mosome 9 (RISC = 10.67) was observed as shown inFigure 1B.
Frequency of integration near transcription factor binding sites and CpG islands
In this study, a total of 140 TFBS were affected by integrations that occurred in HepG2FVIIIdB/P140K cells. Of these, five inte-grations occurred in areas within 5 kb, nine inteinte-grations within 10 kb and 39 within 30 kb of TFBS. In Hek293FVIIIdB/P140K kidney cells, a total of 117 TFBS were affected, and only two insertions occurred within 5 kb, one integration within 10 kb and nine within 30 kb of TFBS. The integration profiles of TFBS regions showed no statistically significant differences
between the two cell lines according to Fisher’s exact test (p
-value = 0.606) as shown inFigure 2A.
The distance of integration sites from the next CpG islands up- or down-stream was also quantified. Of 73 integrations of the retroviral vector, 106 CpG islands were affected in the HepG2 cell line. Of these, 17 occurred in areas within 5 kb, eight integrations within 10 kb and 25 within 30 kb of CpG islands. Of 64 integrations of the retroviral vector in Hek293FVIIIdB/P140K kidney cells, 81 CpG islands were affected with six of these insertions occurring within 5 kb, only one integration within 10 kb and seven within 30 kb of CpG
islands. As shown inFigure 2B, there was no statistical
dif-ferences between cell lines related to the integration profiles of the retroviral vector pMFG-FVIII-P140K near CpG islands
(Fisher test;p-value = 0.5462).
Analysis of targeted genes
1 2 3 4 5 6 7 8 9 10 11 12 13 14
12
10
8
6
4
2
0
Chromosomes
HepG2FVIIIdB/P140K
A
B
Hek293FVIIIdB/P140K
Number of integ
ration sites
RISC
14 15 16 17 18 19 20 21 22 X Y
1 2 -2
0 2 4 6 8 10 40 80
3 4 5 6 7 8 9 10 11 12 13
Chromosomes
14 15 16 17 18 19 20 21 22 X Y
Figure 1 – (A) Integration pattern of retroviral vector pMFG-FVIII-P140K in the 23 chromosomes of two cell lines producing recombinant factor VIII. (B) RISC score – number of chromosomal integrations observed versus number of expected integrations of the PMFG-FVIII-P140K vector in the HepG2FVIIIdB/P140K and Hek293FVIIIdB/P140K cell lines (cut-off = 3).
40%). Hek293 cells showed a similar frequency to that expected randomly (44%).
For HepG2 cells, of the 38 integrations in RefSeq genes, the gene with the largest number of insertions (32%) was thecollagen type 1(COL1A1) gene, followed by theDown syn-drome cell adhesion molecule(DSCAML1) gene (13%). These genes are located on chromosomes 17 and 11 respectively. Hek293 cells had a total of 28 integrations in RefSeq genes with 29% occurring in the PPAPR3 gene, which is part of the lipid phos-phatases family and is located on chromosome 9.
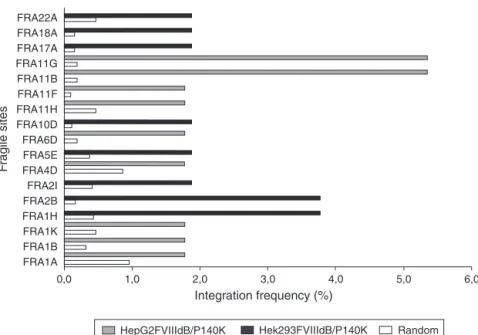
Integration in fragile sites
When retroviral integrations in fragile sites were analyzed, the HepG2/FVIIIdBP140K cells showed 20% of integrations in fragile sites whereas Hek293/FVIIIdBP140K cells showed around 17%. Fragile sites are classified into rare and common according to their frequency and characteristics on chromo-somes. Integrations were observed in both groups. As shown inFigure 3, the most affected fragile sites of HepG2 cells were FRA11G (5.35%) and FRA11B (5.35%), whereas the most affected sites for Hek293 were FRA2B (3.77%) and FRA1H (3.77%). When these results are compared with a set of 10,000 random inte-grations simulated by the Quickmap computer program, there
was a difference in the percentage of integration as the inte-gration was random; expected frequencies would be 0.18% of fragile sites for HepG2 and 0.44% for Hek293.
Discussion
The present study aimed to characterize the integration pat-tern of the retroviral vector pMFG-FVIII-P140K in two cell lines producing recombinant B-deleted FVIII. The strains used
were grown in artificialin vitroconditions using culture and
selected by very stringent treatment using chemotherapeutic
drugs (temozolomide and O6-benzylguanine). The integration
profile of the retrovirus described is specific to these popula-tions. The cell lines used in this work serve as a model that may not accurately represent the biology of normal primary cells.
HepG2FVIIIdB/P140K
–60 –30 –10 10
16 25
26
15
10
5
0
14
12
10
8
6
4
2
0
30 60
–5 5
–60 –30 –10 –5 5 10 30 60
Distance from CpGs island Distance from TFBS (Kb)
A
B
Number of integ
ration sites
Number of integ
ration sites
Hek293FVIIIdB/P140K
Figure 2 – (A) Number of retroviral vector integrations observed in regions near to transcription factor binding sites (TFBS) (p-value = 0.606). (B) Number of retroviral vector integrations observed in regions near to CpG island (p-value = 0.5462).
have a difficult karyotype to define.17The differences in the
integration frequencies between chromosomes are in part a function of gene density. For example, Mitchell et al. in 2004 described that the gene-rich Chromosome 19 showed more integration than expected by chance, whereas the gene-poor
Chromosome 18 showed less integration.18The intracellular
location of the chromosomes can also influence integration, as it has been suggested that this is relatively fixed for each cell
type but differs between cell types.18–20 Moreover, retroviral
vector integration into chromosomes with high gene density could explain why, when the two cell lines were compared in this study, the expression of rFVIII in HepG2 was almost four times higher than for HEK293 cells.
The analysis of insertion in genomic regions showed that for the HepG2 cell line, 52% of the integrations were in genes encoding proteins, whereas for HEK293 this figure was 44%. These results corroborate those of other authors who reported that the integration of viral vectors derived from MLV are greater than 45% in cells such as the hematopoietic stem
cells of rhesus monkeys,21CD34+cells and HeLa cells.22It is
worth mentioning that despite the high frequency of integra-tion within protein-coding genes, more than 90% occurred in intronic regions in both cell lines. Ustek et al., using next gen-eration sequencing technology, showed a high frequency of intragenic integration sites in 293T cells using the lentiviral
vector pLVTHM.23
In regard to the integration into genomic regions, such as CpG islands and TFBS, the HEK293 and HepG2 cell lines showed similar integration patterns. However it is interesting to note that when the distance of retroviral vector integra-tion was analyzed, the results for integraintegra-tion within 1 kb of CpG islands and TFBS are not in agreement with the
literature11,17,18,24 as most of the integrations occurred at
a distance of between 30 and 60 kb. This finding may be related to the fact that in most published studies the authors used infected cells and analyzed the integration within a
Integration frequency (%)
F
ragile sites
0,0 FRA1A FRA1B FRA1K FRA1H FRA2B FRA2I FRA4D FRA5E FRA6D FRA10D FRA11H FRA11F FRA11B FRA11G FRA17A FRA18A FRA22A
1,0 2,0 3,0 4,0 5,0 6,0
HepG2FVIIIdB/P140K Hek293FVIIIdB/P140K Random
maximum of 48 h and did not use any selection strategy, unlike the present study in which the cells remained in a culture after transduction of the retroviral vector and underwent highly stringent treatment to select a cell clone producing FVIII.
A study by Russo-Carbolante et al., using the Sk-Hep and 293T cell lines and Green Fluorescent Protein (GFP) for selec-tion, showed that the lentiviral vector had different integration
profiles for the two strains.25However, when analyzing
inser-tion to specific regions of the genome, such as CpG islands and transcriptional start sites (TSS), both cells showed similar integration patterns with over 50% of the integrations
occur-ring at a distance of within 30 kb,25thus in accordance with the
present study. Since the cells and viral vectors used were dif-ferent and the integration pattern was similar between cells, this suggests that it is possible that the selection strategies used may have an influence on the identification of cell clones with similar integration sites.
Conclusion
These results show that the vector integration profiles of both cells were different from those described in the literature pos-sibly because of the use of selection systems. There is evidence that there is no preferential integration site of the vector when the integration profiles into genomic regions are analyzed. However, the vector showed non-random patterns of chro-mosomal integration which differ between the studied cell lines.
HepG2FVIIIdB/P140K cells expressed higher levels of FVIII compared to Hek293FVIIIdB/P140K, possibly due to a higher number of integrations in chromosomes with high gene den-sity (chromosomes 17 and 19).
Together, these results suggest that cell type can affect the profile of chromosomal integration of the retroviral vec-tor used and such discrepancies may interfere in the level of expression of recombinant proteins.
Conflicts of interest
The authors declare no conflicts of interest.
r e f e r e n c e s
1. Aledort LM. History of haemophilia. Haemophilia. 2007;13:1–2.
2. Mannucci PM. Back to the future: a recent history of haemophilia treatment. Haemophilia. 2008;14:10–8.
3. Scharrer I, Ehrlich HJ. Lack of evidence for increased inhibitor incidence in patients switched from plasma-derived to recombinant factor VIII. Haemophilia. 2001;7:346–8. 4. Singleton E, Smith J, Kavanagh M, Nolan B, White B. Low risk
of inhibitor formation in haemophilia patients after a change in treatment from Chinese hamster ovary cell-produced to baby hamster kidney cell-produced recombinant factor VIII. Thromb Haemost. 2007;98:1188–92.
5. Bacon CL, Singleton E, Brady B, et al. Low risk of inhibitor formation in haemophilia A patients following en masse switch in treatment to a third generation full length plasma
and albumin-free recombinant factor VIII product (ADVATE®).
Haemophilia. 2011;17:407–11.
6. Brooks SA. Appropriate glycosylation of recombinant proteins for human use: implications of choice of expression system. Mol Biotechnol. 2004;28:241–55.
7. Swiech K, Picanc¸o-Castro V, Covas DT. Human cells: new platform for recombinant therapeutic protein production. Protein Expr Purif. 2012;84:147–53.
8. Baxter. Advate®prescribing information. Deerfield: Baxter;
2010.
9. Bayer HealthCare. Kogenate®prescribing information.
Leverkusen: Bayer HealthCare; 2009.
10. Wyeth Pharma (Pfizer). ReFacto®prescribing information.
Madison: Wyeth Pharma (Pfizer); 2007.
11. Wu X, Li Y, Crise B, Burgess SM. Transcription start regions in the human genome are favored targets for MLV integration. Science. 2003;300:1749–51.
12. University of California Santa Cruz Genome Bioinformatics. Human BLAT search [internet]; 2014. Available from: http://genome.ucsc.edu/cgi-bin/hgBlat[cited 21.01.14]. 13. Gene Therapy Safety Group. QuickMap [internet]; 2014.
Available from:www.gtsg.org[cited Jan 22.01.14].
14. Appelt JU, Giordano FA, Ecker M, et al. QuickMap: a public tool for large-scale gene therapy vector insertion site mapping and analysis. Gene Ther. 2009;16:885–93.
15. Laufs S, Gentner B, Nagy KZ, et al. Retroviral vector integration occurs in preferred genomic targets of human bone marrow-repopulating cells. Blood. 2003;101:2191–8. 16. Laufs S, Guenechea G, Gonzalez-Murillo A, et al. Lentiviral
vector integration sites in human NOD/SCID repopulating cells. J Gene Med. 2006;8:1197–207.
17. Lewinski MK, Yamashita M, Emerman M, et al. Retroviral DNA integration: viral and cellular determinants of target-site selection. PLoS Pathog. 2006;2:e60.
18. Mitchell RS, Beitzel BF, Schroder AR, et al. Retroviral DNA integration: ASLV, HIV, and MLV show distinct target site preferences. PLoS Biol. 2004;2:E234.
19. Boyle S, Gilchrist S, Bridger JM, Mahy NL, Ellis JA, Bickmore WA. The spatial organization of human chromosomes within the nuclei of normal and emerin-mutant cells. Hum Mol Genet. 2001;10:211–9.
20. Chubb JR, Bickmore WA. Considering nuclear
compartmentalization in the light of nuclear dynamics. Cell. 2003;112:403–6.
21. Hematti P, Hong BK, Ferguson C, et al. Distinct genomic integration of MLV and SIV vectors in primate hematopoietic stem and progenitor cells. PLoS Biol. 2004;2:e423.
22. Cattoglio C, Facchini G, Sartori D, et al. Hot spots of retroviral integration in human CD34+ hematopoietic cells. Blood. 2007;110:1770–8.
23. Ustek D, Sirma S, Gumus E, et al. A genome-wide analysis of lentivector integration sites using targeted sequence capture and next generation sequencing technology. Infect Genet Evol. 2012;12:1349–54.
24. Felice B, Cattoglio C, Cittaro D, et al. Transcription factor binding sites are genetic determinants of retroviral integration in the human genome. PLoS ONE. 2009;4:e4571. 25. Russo-Carbolante EM, Picanc¸o-Castro V, Alves DC, et al.