with a biased distribution among chromosomes. Transcriptome data implicate a number of biological processes affected by human selection, and suggest that the domestication process has prolonged the duration of fiber elongation in modern cultivated forms. Functional analysis suggested that wild cottons allocate greater resources to stress response pathways, while domestication led to reprogrammed resource allocation toward increased fiber growth, possibly through modulating stress-response networks. This first global transcriptomic analysis using multiple accessions of wild and domesticated cottons is an important step toward a more comprehensive systems perspective on cotton fiber evolution. The understanding that human selection over the past 5,000+years has dramatically re-wired the cotton fiber transcriptome sets the stage for a deeper understanding of the genetic architecture underlying cotton fiber synthesis and phenotypic evolution.
Citation:Yoo M-J, Wendel JF (2014) Comparative Evolutionary and Developmental Dynamics of the Cotton (Gossypium hirsutum) Fiber Transcriptome. PLoS Genet 10(1): e1004073. doi:10.1371/journal.pgen.1004073
Editor:Kirsten Bomblies, Harvard University, United States of America
ReceivedSeptember 2, 2013;AcceptedNovember 15, 2013;PublishedJanuary 2, 2014
Copyright:ß2014 Wendel, Yoo. This is an open-access article distributed under the terms of the Creative Commons Attribution License, which permits unrestricted use, distribution, and reproduction in any medium, provided the original author and source are credited.
Funding:This work was supported by the National Science Foundation Plant Genome Program award#0817707. The funders had no role in study design, data collection and analysis, decision to publish, or preparation of the manuscript.
Competing Interests:The authors have declared that no competing interests exist. * E-mail: [email protected]
Introduction
Ever since Darwin’s time, biologists have recognized that human domestication of wild plants and animals offers promising opportunities for enhancing our understanding of the evolutionary process. As highlighted in recent reviews [1,2], comparisons among wild and domesticated forms of crop plants often lead to insights into the genetic architecture and developmental mecha-nisms that underlie traits subjected to strong directional human selection. The power of this approach is magnified by the recent advent of high-throughput ‘‘omics’’ technologies, which hold promise for leading us to an eventual systems-level understanding of phenotypic change. Domesticated forms of cultivated species differ from their wild counterparts in numerous traits, particularly those subjected to intentional directional selection, e.g., loss of seed dormancy, larger and/or more fruits, determinate growth, annualized habit, and earlier flowering. Insights into the evolution of this ‘‘domestication syndrome’’ [3] are made possible by comparative studies of wild and domesticated representatives of individual cultivated species [1,2].
Upland cotton (Gossypium hirsutum L.) is the most important domesticated fiber plant in the world, accounting for more than 90% of global cotton production. Originally native to the northern coast of the Yucatan peninsula in Mexico, upland cotton is widely cultivated in over 50 countries in both hemispheres [4]. The trait
for which cotton was initially domesticated is the remarkably elongated, single-celled epidermal trichomes, or hairs, that cover the cottonseed surface (colloquially termed ‘‘fibers’’). These seed hairs vary greatly in length, color, strength, and density among the myriad wild, semi-domesticated, feral and modern annualized forms that collectively comprise the speciesG. hirsutum. In truly wildG. hirsutumtrichomes are short (typically ,1.5 cm), coarse, and are various shades of tan to brown.Gossypium hirsutum was initially domesticated at least 5000 years ago, and following millennia of directional selection, domesticated forms now produce long, strong, and fine white fibers along with a dramatically enhanced fiber yield. In addition to this increase in fiber length, strength, and quality, the domestication process brought about other morphological transformations, including decreased plant stature, earlier flowering, and loss of seed dormancy.
plants [6], comparative analyses of wild and domesticated cottons may provide new perspectives about how human selection affects duplicated genes in allopolyploids. In addition, many important crops, such as alfalfa, potato, wheat, soybean, and cabbage, are obvious polyploids, so studying gene expression in allopolyploid cotton has the potential to offer novel insights on the role of polyploidy in crop evolution (e.g., Bao et al.[7]).
To date, and despite its importance to understanding molecular mechanisms governing fiber development, there have been only a handful studies of global gene expression in G. hirsutum, using expressed sequence tags (ESTs) [8,9] and microarrays [10–14]. In addition, most have focused on comparisons of modern, annual-ized G. hirsutum and its fiberless/lintless mutants. The single notable exception is the study of Rapp et al., who used microarrays to compare truly wild and domesticatedG. hirsutum[13]. Notably, Rapp et al. explored global gene expression patterns in wild and domesticated G. hirsutum cotton fibers across five temporal/ developmental time points, and found that about one quarter of all genes examined exhibited expression changes during domes-tication, indicating massive alteration of the cotton fiber transcriptome by domestication and crop improvement [13]. However, a limitation of the study of Rapp et al. is that they employed only one accession representing each of the wild and domesticated gene pools, raising the possibility that some of the observed differential expression might simply reflect expression variation that is unconnected to the evolutionary transformation of interest [13]. Also, the microarray methodology relies on less precise probe/target hybridization, is subject to high background noise, and has a narrower range of gene expression quantification, in comparison to profiling using RNA-Seq data [15]. Finally, the genome sequence forG. raimondiionly recently became available [16], providing deeper annotation and better discrimination among homologs (and homoeologs), and hence enhanced power to decipher gene expression level changes across the whole genome.
Here, to gain insight into the evolutionary genomics of cotton domestication, we conducted comparative transcriptome profiling of developing cotton fibers from multiple accessions of wild and domesticatedG. hirsutumusing RNA-Seq data. Two developmental stages were studied, 10 and 20 days post anthesis (dpa), representing key stages of primary cell wall growth and the transition to secondary cell wall growth, respectively [17,18]. By examining gene expression levels digitally, we found that approximately one-third of the genes in the genome are expressed in cotton fiber regardless of lineage, accession, and developmental stages. Notably, nearly 5,000 genes are diagnosed as being differentially expressed as a consequence of cotton fiber domes-tication. These data suggest that human selection has repro-grammed the transcriptome on a massive scale, and that part of this rewiring entails a reallocation from stress response pathways toward fiber growth.
Results
We performed global transcriptome profiling of developing cotton fibers from wild and domesticatedG. hirsutumusing RNA-Seq. A total of 310 million (M) reads was generated from 20 libraries, and on average 70% of these uniquely mapped to the reference genome (Table 1). To determine how many genes were expressed in fibers and whether there was variation among accessions, we first evaluated the number of expressed genes. Since we did not include external controls, such as the External RNA Controls Consortium (ERCC) controls, we used arbitrary mea-sures for ‘‘expression’’, such as RPKM = 2 or 5 ( = 32 or 80 short reads on average for a 1.6 kb-gene; RPKM = Reads Per Kilobase of gene model per Million mapped reads) [19]. Based on the criterion of RPKM§5, approximately 12,700 (33.9%) and 12,000 (33.0%) genes were expressed at 10 and 20 dpa, respectively, in most accessions (Table 2); three domesticated accessions (Cascot L-7, Coker 315, and CRB250) showed lower numbers of expressed genes at 20 dpa compared to other accessions, which we attribute to the higher proportions of redundantly mapped reads in these accessions (data not shown). This is consistent with the fiber transcriptome diversity obtained from domesticated G. hirsutumcv. TM-1 [20] and from diploid cottonG. arboreum[21]. In general, more genes were expressed in wild than domesticated cottons at both developmental stages. More genes were expressed at 20 dpa than 10 dpa in wild cottons, while the opposite was observed for domesticated cottons (Table 2). Before identifying differentially expressed genes during domestication and develop-ment, variation among samples was evaluated using Multidimen-sional scaling (MDS). Because the transcriptome profile from Maxxa 10 dpa exhibited a large distance from other domesticated cottons and was embedded in wild cottons (Figure S1), it was excluded from further analyses. However, in general, samples clustered as expected, indicating that the variation among samples is largely explained by developmental stage and domestication.
Transcriptomic change during development in wild and domesticatedG. hirsutum
We profiled the transcriptome during development in wild and domesticated cottons using two developmental stages, 10 and 20 dpa. Both wild and domesticated cottons showed more gene up-regulation than down-regulation during the transition from 10 to 20 dpa, e.g., 782 vs. 362 in domesticated cottons (Figure 1). However, three times as many genes (3,487 vs. 1,144) were differentially expressed during development in wild cottons compared to domesticated cottons (Figure 1). This pattern is also supported by the MDS plot, which showed less variation between
Author Summary
the two developmental stages of domesticated cottons compared to wild cottons (Figure S1). Our results with respect to developmental variation differ from those of Rapp et al. [13], where differential expression was observed at 2.6-times as many genes in domesti-cated cotton relative to a wild accession (5,851 vs. 2,207 with 1.5-fold change; Table S1). However, our results parallel those from a second domesticated allopolyploid, G. barbadense, using either microarrays [22] or RNA-Seq data (M.J. Yoo et al., unpublished data). To clarity the difference between the two studies, we reanalyzed our data using the same accessions used in Rapp et al. [13]. The inclusion of TX2094 and YUC as two biological replicates resulted in 10 times as many DE genes compared to a single accession analysis (TX2094 vs. ‘‘TX2094+YUC’’ = 436 vs. 4,520; Table S1) and a 30% increase in DE genes relative to the ‘‘All accession’’ analysis (4,520 vs. 3,487; Table S1). As for domesticated cottons, since we have only one replicate for TM1, we included a second domesticated cotton for comparison, which resulted in a 17,21% increase compared to the ‘‘All accession’’
analysis (Table S1).These results suggest that the observed conflict between the two studies likely is explained by technical differences among platforms and the reference genome used.
As expected based on our understanding of primary and secondary cell wall biosynthesis in cotton [17,18], the two developmental stages were clearly differentiated by the expression patterns of genes involved in cell wall biogenesis. Cellulose synthase (CesA) genes, such asCesA4,CesA6,CesA7, andCesA8were more up-regulated at 20 than 10 dpa in wild cottons, while they exhibited less differential expression during fiber development in domesticated cottons (Figure S2A, B). Among them, four CesA genes were highly expressed at 20 dpa in domesticatedG. hirsutum, consistent with a previous report [23], but only CesA8, a homologue ofGhCesA1, was up-regulated at 20 dpa compared to 10 dpa in domesticated cottons (Figure S2A, B). Cellulose
synthase-like (Csl) genes, particularly CslA and CslC, responsible for glucomannan and xyloglucan synthesis, respectively [24], were up-regulated at 10 dpa in both wild and domesticated accessions (Figure S2A, C). Additional differentially expressed genes related to cell wall biogenesis exhibited various patterns during fiber development. For example,b-galactosidase was up-regulated at 10 dpa, whileb-1,3-glucosidase andb-xylosidase were up-regulated at 20 dpa; these two enzymes are thought to function in hydrolyzing galactan, glucan, and xylogucan, respectively, into monosaccharides, such as glucose, which can be further processed to either cellulose or pectin [25–27]. Xyloglucan endotransglyco-sylase (XTH) genes, which encode proteins involved in xyloglucan breakdown and subsequent rejoining with different acceptor chains, showed variable expression patterns during development (Figure S3). For example,XTH5andXTH28were up-regulated at 10 and 20 dpa, respectively, in both wild and domesticated cottons. Genes related to pectin synthesis, for example, UDP-D-glucuronate-4-epimerase,b-galactosidase, and pectate lyase, were also up-regulated at 10 dpa relative to 20 dpa in both wild and domesticated accessions. However, UDP-glucose-6-dehydrogenas-es, which oxidize UDP-glucose into UDP-glucuronate, were up-regulated at 10 dpa of domesticated cottons, but down-up-regulated in wild cottons. Since the foregoing genes represent only a small portion of the total number of differentially expressed genes, we further investigated the difference in development between wild and domesticated cottons using functional analyses (see below).
Transcriptomic changes accompanying domestication To investigate transcriptomic changes in cotton fiber that distinguish wild from domesticated cottons, and hence reflect the presumptive effects of human selection, we compared the gene expression patterns of wild and domesticated cottons from multiple accessions. A total of 4,946 (13.2%) genes were differentially
20 dpa 29,461,705 23,229,997 (78.8)
G. hirsutumcv. Cascot L-7 Plains in U.S.A 10 dpa 20 dpa
10,688,995 31,345,469
8,488,820 (79.4) 17,785,760 (56.7) G. hirsutumcv. Coker 315 Eastern U.S.A 10 dpa
20 dpa
14,201,314 10,615,133
11,065,757 (77.9) 5,881,452 (55.4) G. hirsutumcv. CRB252{ Eastern U.S.A 10 dpa
20 dpa
9,986,108 8,344,787
7,583,439 (75.9) 4,720,388 (56.6)
G. hirsutumcv. Maxxa* Western U.S.A 10 dpa
20 dpa
12,266,868 15,484,446
9,410,233 (76.7) 12,353,194 (79.8) G. hirsutumcv. Texas Marker 1 (TM1) Delta in U.S.A. 10 dpa
20 dpa
14,706,919 13,078,240
11,766,434 (80.0) 9,003,797 (68.8)
{
CRB252-Derives from a double cross, SG 248/PHY 72//ST 474/Maxxa.
*data from the study number SRP001603 at NCBI SRA. Fiber samples from TX2094 and Maxxa were collected in different growing seasons; thus, this TX2094 was noted as ‘‘YUC’’ to be distinguished from TX2094, which was collected in the same year as the other materials.
expressed between wild and domesticated cottons (Figure 1), approximately evenly split between genes that were differentially up- and down-regulated between these two pools. However, nearly three times as many genes were differentially expressed at 10 relative to 20 dpa, a result that at least partially mirrors the data in Rapp et al. [13] (1.7-fold more genes differentially expressed at 10 dpa relative to 20 dpa); the two studies differ in that there was a greater bias toward up-regulation in domesticated than in wild cotton in the earlier study. However, if strict criteria for differential expression are applied, such as RPKM§5 and more than 2-fold change (All accessions (RPKM.= 5) and Rapp et al. in Table S2), the two studies yield similar results; for example, about 60% of differentially expressed genes at both developmental time points were up-regulated in domesticated cottons relative to wild cottons, although it looks like there are more differentially expressed genes at 20 dpa in domesticated cottons than in wild cottons in Rapp et al. [13] compared to this study (not statistically significant; P = 0.1106) (Table S1). A single accession analysis resulted in an extremely small number of DE genes (,1% of the genes in the reference genome), perhaps due to the lack of biological replicates,
while inclusion of two TX2094 samples in RNA-Seq data showed more DE genes compared to multiple accession analysis ((TX2094+YUC)2TM1 vs. All accession = 3,609 vs. 2,910 at 10 dpa, 3,299 vs. 1,339 at 20 dpa; Table S2). These results suggest that variation among biological replicates plays an important role in analyzing RNA-Seq data; that is, more biological replicates from one accession increase the power of DE gene detection (see the previous section). However, at the same time, including multiple accessions facilitates discovery of DE genes across multiple accessions (e.g., (TX2094+TX665+TX2095)2(TM1+
CRB250+cascot7) vs. All accession = 1,254 vs. 3,581 at 10 dpa, 876 vs. 1,365 at 20 dpa; Table S2).
We evaluated whether the effects of human selection were biased with respect to the genomic distribution of the effected loci. To do this we tabulated differentially expressed genes by chromosome, and then calculated an expectation based on a null hypothesis of equal distribution, calibrated by the number of genes in each scaffold. This analysis revealed that chromosomes 8 and 1 were differentially targeted during domestication at 10 and 20 dpa, respectively (red text in Table S3). With respect to the
Table 2.The number of genes expressed inGossypium hirsutumandG. arboretum.
Accession Tissue* domestication RPKM§2 (%) RPKM§5 (%) N1{
Reference
TX665 10 wild 17,724 (47.3) 12,501 (33.3) This study
TX2090 10 wild 18,846 (50.2) 13,674 (36.5)
TX2095 10 wild 17,741 (47.3) 12,383 (33.0)
TX2094 10 wild 19,057 (50.8) 13,849 (36.9)
YUC 10 wild 20,396 (54.4) 15,096 (40.3)
Cascot L-7 10 domesticated 15,977 (42.6) 11,150 (29.7)
Coker 315 10 domesticated 16,885 (45.5) 11,852 (31.6)
CRB 252 10 domesticated 17,264 (46.0) 12,260 (32.7)
TM1 10 domesticated 16,544 (44.1) 11,884 (31.7)
Maxxa 10 domesticated 17,465 (46.6) 12,055 (32.1)
TX665 20 wild 18,487 (49.3) 13,068 (34.8) This study
TX2090 20 wild 19,850 (52.9) 15,033 (40.1)
TX2095 20 wild 19,393 (51.7) 14,094 (37.6)
TX2094 20 wild 20,396 (54.4) 15,026 (40.1)
YUC 20 wild 19,877 (53.0) 14,660 (39.1)
Cascot L-7 20 domesticated 13,154 (35.1) 7,900 (21.1)
Coker 315 20 domesticated 10,804 (28.8) 6,640 (17.7)
CRB 252 20 domesticated 14,223 (37.9) 8,674 (23.1)
TM-1 20 domesticated 17,212 (45.9) 11,730 (31.3)
Maxxa 20 domesticated 16,652 (44.4) 11,506 (30.7)
TM-1{
2 domesticated 11,094 (29.6) [20]
TM-1{ 7 domesticated 10,278 (27.4)
TM-1{
10 domesticated 10,814 (28.8)
TM-1{
20 domesticated 11,078 (29.5)
TM-1{ 25 domesticated 10,716 (28.6)
TM-1{
various1
domesticated 11,913 (31.8)
TX2094 young leaf wild 18,794 (50.1) 11,350 (32.5) [55]
Maxxa young leaf domesticated 19,618 (52.3) 12,183 (32.5)
G. arboreum 10 to 24 domesticated diploid 12,227 (32.6) [21]
*numbers indicate day post anthesis (dpa) fibers.
{
denotes the number of genes expressed at levels significantly different from zero (P,0.01) [20].
1
latter observation about chromosome 1, the results reflect a putative nuclear mitochondrial DNA (NUMT) sequence block (Figure S4) [16] that contained an unexpectedly high number of up-regulated genes at 20 dpa in both ‘‘domestication’’ (wild vs. domesticated) and ‘‘development’’ (10 vs. 20 dpa) contrasts. For example, during domestication 36 of 84 differen-tially expressed genes on chromosome 1 were included in this NUMT block and 12 genes are found to be mitochondrial genes, including eight NADH dehydrogenase and four cytochrome-c-related genes.
The comparison of wild and domesticated cottons highlights the fact that the transcriptome of developing cotton fibers was highly altered by five thousand years or more of domestication and crop improvement. To explore this complexity, we first investigated genes previously inferred to be involved in fiber initiation, elongation, and secondary wall biosynthesis (reviewed in [28]). Interestingly, most of the genes involved in the first (initiation) and third (secondary wall biosynthesis) of these stages were up-regulated in wild cottons compared to domesticated cottons at 10 and 20 dpa, respectively (Table S4). In contrast, many genes involved in fiber elongation were highly up-regulated in domes-ticated cotton compared to wild cottons at 10 dpa, while several genes from this same developmental stage were up-regulated in wild cottons at 20 dpa, encoding annexin, actin depolymerizing factor, FASCICLIN-like arabinogalactan-protein, and tubulin alpha-2 chain (Table S4). Considering expression levels of these genes, differentiation between wild and domesticated cottons was greater during fiber elongation, which is also true at the global transcriptome level, as reported here.
Among the 3,581 genes differentially expressed between wild and domesticated cotton at 10 dpa, we tabulated the most highly up-regulated genes in wild or domesticated cottons, relative to their counterparts, with respect to fold change (with RPKM§50). This analysis reveals that many genes involved in fiber elongation were over-expressed in domesticated cottons, including profilin 1, HXXXD-type acyl-transferase family protein, expansin A8, beta-6 tubulin, FASCICLIN-like arabinogalactan 9 (FLA9), and 3-ketoacyl-CoA synthase 2 (KCS2) (Table 3).KCSgenes are involved in fatty acid elongation and are known to be highly expressed during fiber elongation [29–31]. In this study, nine and three of 27 KCSs were up-regulated in domesticated cotton compared to wild
types at 10 and 20 dpa, respectively (Figure S5). Notably, five of nine differentially expressed KCSs showed A-homoeolog expres-sion bias, while the other four exhibited no bias (Table S5).CesA andCslplay critical roles in cell wall biosynthesis [17,18,23] and were differentially expressed between wild and domesticated cottons. Five of 18CesA, five of sevenCslCand three of sixCslD genes in the reference genome were up-regulated in domesticated cotton at 10 dpa (Figure 2).
FLAs have been classified into four groups [32], but the function of only a fewFLAs are known. For example, inArabidopsis,FLA4or SOS5(At3g36550) plays a role in cell expansion [33], and several FLAhomologues ofG. hirsutumwere highly expressed during fiber elongation [34]. We also observed severalFLA homologues that were up-regulated in domesticated cottons compared to wild cottons at 10 dpa, including twoSOS5homologues and three of fourAtFLA7homologues (Figure S6).
Profilin (PRF) and its partners (e.g., actin, tubulin, and villin), which play an important role in actin polymerization [7,35], were also up-regulated in domesticated cotton, and their expression levels were high, except for villins (Figure S7). Consistent with Bao et al. [7], PRF1 exhibited the highest expression differences between wild and domesticated cottons, andPRF3andPRF4were up-regulated in domesticated cottons relative to wild cottons (Figure S7). However, the other two PRF genes were not differentially expressed (cf. ref [7]), a conflict perhaps explained by the larger number of accessions studied here. As forACTIN (ACT), there were two main clades ofGossypium ACTs,ACT1/3/4/ 11/12(clade I) and ACT7(clade II) (Figure 3). These two clades are distinct in their gene expression patterns; members ofACT1/ 3/4/11/12generally are expressed in reproductive organs, such as pollen, pollen tubes, and ovules of Arabidopsis, while ACT7 is expressed in vegetative tissues, including root hairs and trichomes along with ACT2 and ACT8 [36–39]. In the present study, at 10 dpa nine and twoACT genes were up-regulated in domesti-cated and wild cottons, respectively (Figure 3). Interestingly, all of the genes closely related toArabidopsis ACT7were commonly and highly up-regulated in domesticated cottons, except Gor-ai.N017400. Previously identifiedGhACT1, which was shown to participate in fiber elongation [40], showed the highest similarity to Gorai.007G063600 (probablyGhACT2; see Table S4) included in the ACT7 clade. Notably, Gorai.007G063600 seems to be Figure 1. Number of genes differentially expressed during fiber development within and between wild and domesticated cottons. Left: Representative images of individual seeds with attached fiber are presented for domesticated (top) and wild (bottom) accessions. Right: Number of differentially expressed genes in developing cotton fiber within and between wild and domesticated cottons (RPKM§1, FDR,0.05,
fold-change§1.5). For example, between two developmental stages within domesticated cottons, 362 genes were up-regulated at 10 dpa, whereas 762
genes were more highly expressed at 20 dpa. Similarly, between wild and domesticated cottons at 10 dpa, 1,844 genes were up-regulated in domesticated cottons, while 1,737 genes were more highly expressed in wild cottons.
duplicated; its duplicate, Gorai.007G063700, was also up-regulated in domesticated cottons with expression levels similar to that of Gorai.007G063600 (Figure 3). OtherACTgenes, which are members of clade I or which are up-regulated in wild cottons, exhibited relatively low expression levels compared toACT7homologues.
In contrast to some key genes observed to be up-regulated under domestication, in wild cottons some genes involved in
phenylpropanoid metabolism, such as flavonoid biosynthesis and anthocyanin biosynthesis, were highly up-regulated at both developmental time points compared to their counterparts in domesticated cottons (Figure 4). For example,PHENYLALANINE AMMONIA LYASE 1(PAL1) exhibited 5.6 times higher expression than in domesticated cottons at 10 dpa, and other genes involved in this pathway showed similar patterns (Figure 4B). In addition,
Table 3.The most abundantly up-regulated genes in domesticated cottons (log2FC.0) or wild cottons (log2FC,0) relative to their counterparts at 10 dpa.
GoraiID Sequence description Expression level (RPKM) log2FC*
wild dom
Gorai.009G028500 Profilin 1 7 755 7.117
Gorai.012G006600 HXXXD-type acyl-transferase family protein 17 292 4.390
Gorai.010G045500 glycerol-3-phosphate acyltransferase 3 4 56 4.014
Gorai.006G240600 Lipid-transfer protein 38 229 2.923
Gorai.002G193500 proline-rich protein 2 383 2260 2.880
Gorai.012G014400 expansin A8 10 52 2.706
Gorai.004G211800 beta-6 tubulin 103 431 2.378
Gorai.006G150100 NDR1/HIN1-like 1 26 102 2.311
Gorai.006G000200 Chalcone and stilbene synthase family protein 29 112 2.264
Gorai.011G035400 GDSL-like Lipase/Acylhydrolase protein 354 1346 2.245
Gorai.002G245900 gamma tonoplast intrinsic protein 246 924 2.230
Gorai.013G177600 glutathione S-transferase TAU 19 14 52 2.174
Gorai.013G270600 heat shock protein 70B 25 89 2.125
Gorai.006G150600 Eukaryotic aspartyl protease family protein 383 1293 2.075
Gorai.008G155400 FASCICLIN-like arabinoogalactan 9 569 1901 2.058
Gorai.011G165200 3-ketoacyl-CoA synthase 2 63 203 2.018
Gorai.002G161400 polygalacturonase 2 18 59 2.009
Gorai.006G148600 syntaxin of plants 121 31 100 2.009
Gorai.010G069000 alpha/beta-Hydrolases superfamily protein 30 97 2.005
Gorai.002G248400.2 plasma membrane intrinsic protein 2 27 88 2.001
Gorai.008G131700 O-methyltransferase 1 (OMT1) 365 3 26.422
Gorai.007G336600 Plant invertase/pectin methylesterase inhibitor 134 2 25.544
Gorai.007G029700 HXXXD-type acyl-transferase family protein 213 4 25.341
Gorai.008G198200 Cytochrome P450 superfamily protein (CYP75B1) 239 8 24.642
Gorai.001G136100 Lipid-transfer protein 57 3 24.155
Gorai.013G023400 Chalcone-flavanone isomerase family protein 709 36 23.988
Gorai.010G255300 Clathrin light chain protein 62 3 23.947
Gorai.011G161300 Chalcone and stilbene synthase family protein 1541 88 23.811
Gorai.004G205900 leucoanthocyanidin dioxygenase 1744 101 23.785
Gorai.008G062900 flavanone 3-hydroxylase 5324 349 23.611
Gorai.011G161200 Chalcone and stilbene synthase family protein 1120 74 23.604
Gorai.004G105500 NAD(P)-binding Rossmann-fold superfamily protein 443 33 23.447
Gorai.009G182300 ethylene-forming enzyme 112 9 23.360
Gorai.005G035100 Chalcone and stilbene synthase family protein 1752 143 23.297
Gorai.004G184100 NAD(P)-binding Rossmann-fold superfamily protein 329 29 23.209
Gorai.001G134900 Cytochrome P450 superfamily protein (CYP75B1) 2157 193 23.166
Gorai.007G322600 metallothionein 3 82 8 23.133
Gorai.004G277300 Histone superfamily protein 84 8 23.064
Genes were filtered by RPKM§50 in either wild or domesticated cottons. Bold indicates genes involved in phenylpropanoid metabolism. Eleven and four genes
up-regulated in domesticated and wild cottons, respectively, were removed because of no annotation. *Log2 Fold Change calculated from raw mapped read numbers using DESeq software.
some MYB transcription factors (TFs) were also up-regulated in wild cotton compared to domesticated cotton (Figure 5, Figure S8). In particular, half of the 23 differentially expressed MYB TFs in wild cottons were related to the phenylpropanoid pathway, as noted earlier [16], and their up-regulation was observed at both developmental stages (Figure S8).
At 20 dpa, similar sets of genes were differentially expressed, but their expression levels were relatively lower compared to those observed in 10 dpa (e.g., Figure S3, S4, S5, S6, S7, S8). Many of the genes up-regulated in domesticated cottons were related to protein synthesis (see below) or were found in a putative nuclear mitochondrial DNA (NUMT) sequence block (Table S3; see above). In addition and importantly, 14–19% of the differentially expressed genes encode unknown proteins, in agreement with previous reports [13,21]; these genes become obvious targets for future functional analysis, to discover their roles in cellular development and in evolution.
Among the 2,830 TFs that are annotated in the cotton genome, fewer than 10% were differentially expressed between wild and domesticated cottons. Specifically, 266 (184 vs. 82 up-regulated in wild vs. domesticated, or the reverse) and 132 (100 vs. 32 up-regulated in wild vs. domesticated, or the reverse) were
differentially expressed at 10 and 20 dpa, respectively. Among these, only 48 TFs were expressed at the level of RPKM§50, indicating that the majority of TFs are not highly expressed in fibers. Of these 48 highly expressed TFs, 27 and 16 were up-regulated in wild and domesticated cottons relative to their counterparts, respectively. Five genes were not differentially expressed including GLABRA2 (GL2) and MYB60 which have been functionally studied. GL2 regulates cell wall-related gene expression (CeSA5 and XTH17) during root development in Arabidopsis[41], while MYB60is involved in stomatal regulation and root growth under drought stress in grapevine [42] and Arabidopsis[43], or repressing anthocyanin biosynthesis in lettuce [44]. As for TFs up-regulated in wild cottons relative to domesticated cottons, three TFs families were the most commonly represented, including homeobox, MADS and MYB TFs (Figure 5, Table S6). This is consistent with previous studies on the importance of MYBs in fiber development [45–48], but over-representation of MADS genes has not previously been reported for cotton fibers. MADS genes that were differentially expressed were related to carpel (e.g., AGAMOUS, SHATTERPROOF1, SEPALLATA) and seed development (SEEDSTICK); results here suggest the possibility that these genes have found a new role in Figure 2. The phylogeny of cellulose synthase (CesA) and cellulose synthase-like (CSL) genes.Inside and outside circles show differential expression between wild and domesticated cottons at 10 and 20 dpa, respectively. Red circle represents up-regulation at domesticated cottons, while blue one indicates up-regulation at wild cottons during domestication. Grey circle shows no differential expression, while white circle designates no expression (zero read count).
fiber development. In domesticated cottons, three TFs, C3H, TCP, and trihelix, were the most commonly represented classes among the 48 TFs (Figure 5, Table S6); this includes a TF that recently has been identified as important for fiber development in bothG. barbadense[49] andG. hirsutum[50]. Gorai.007G036800, a homologue ofGhTCP14 [50], was up-regulated in domesticated cottons relative to wild cottons, supporting its relatedness to fiber elongation.
Functional analyses of differential expression
To evaluate whether specific biological processes were enriched in representation by either development or domestication, two different functional analyses were performed, the Singular Enrichment Analysis (SEA) and the Parametric Analysis of Gene set Enrichment (PAGE). Although SEA and PAGE deploy different strategies, both methods yielded similar results. Thus, we present only SEA results here (Table S7), to highlight some of the differences between wild and domesticated cottons. In general, during development more biological processes were differentially regulated in wild cottons than domesticated cottons (wild vs. domesticated = 71 vs. 1 biological processes (P) in Table S7A), as expected based on the degree of differential expression found in comparison of two developmental time points in wild and domesticated cottons (Figure 1). For example, at 10 dpa in wild cottons, genes related to lipid metabolism were enriched, including
fatty acid biosynthetic process, very-long-chain fatty acid (VLCFA) metabolic process, sterol biosynthetic process, and steroid biosyn-thetic process, and secondary metabolites biosynthesis process was also up-regulated, including phenylpropanoid, coumarin, flavonoid, and anthocyanin biosynthesis processes (Table S7A). In addition, gibberellic acid (GA) mediated signaling pathway was also over-represented at 10 dpa in wild cottons, noting that GA is required for fiber initiation and elongation [51,52]. At 20 dpa in wild cottons, in addition to in cell wall organization or biogenesis, genes involved in response to abiotic and biotic stimuli, such as water deprivation, organic substance, chemical and hormone stimuli were over-represented relative to 10 dpa (Table S7A). In domesticated cottons, there was no biological process enriched between 10 and 20 dpa based on PAGE analysis (data not shown), while SEA results indicated that genes related to lipid metabolic process were up-regulated at 10 dpa compared to 20 dpa (Table S7A).
In the domestication contrast, SEA results showed that more biological processes were up-regulated in domesticated cottons than in wild cottons (123 in domesticated cottons vs. 49 in wild cottons; Table S7B). Many up-regulated genes in wild cottons relative to domesticated cottons at 10 dpa were related to protein-DNA complex assembly, nucleosome assembly, response to disaccharide stimulus, and secondary metabolite synthetic pro-cesses, such as anthocyanin, flavonoid, and phenylpropanoids (Table S7B). Consistent with this result, cellular components, such Figure 3. Phylogenetic relationship ofACTINand their gene expression patterns at 10 dpa.(A) Phylogenetic relationship ofG. raimondii ACTIN genes. Red and blue dots on the node indicate up- or down regulation at domesticated cottons, respectively. Asterisk (*) shows ACTIN homologues previously studied. (B) Expression patterns of differentially expressedACTgenes. Bar denotes standard error.
as chromosome and nucleosome, and molecular function of transcription factor activity were highly enriched in wild cottons (Table S7B). At 20 dpa of wild cottons, genes involved in cell wall macromolecule metabolism and amine catabolism were up-regulated relative to domesticated cottons, suggesting that secondary cell wall synthesis is active in wild cottons. Amine catabolism involves protein degradation, which may generate nitrogen-containing compounds for secondary metabolite synthesis. In fact, most genes related to amine catabolism were associated with phenylpropanoid biosynthesis, for example, 4-coumarate:CoA ligase 1 (4CL1), PAL1, cinnamyl alcohol dehydrogenase (CAD), and cinnamoyl CoA reductase 1 (CCR1). On the other hand, domesticated cottons were defined by fiber elongation-related processes (e.g., vesicle-mediated transport, actin cytoskeleton
organization, and cellulose metabolism) at 10 dpa and energy generation and protein synthesis at 20 dpa (Table S7B). For example, many genes differentially expressed at 20 dpa of domesticated cottons compared to wild cottons were involved in RNA elongation, cellular respiration along with oxidative phos-phorylation, and protein synthesis (translation). Also, some genes involved in fatty acid biosynthesis were up-regulated, perhaps to facilitate membrane growth and turnover during fiber elongation and maturation [53].
Homoeolog-specific biases and change during development and domestication
To explore whether there is a bias in usage of parental gene copies (homoeologs) during development and domestication, a Figure 4. Expression patterns of genes related to phenylpropanoid pathway (A) and their actual expression levels (B) in wild and domesticated cottons.Blue text in (A) indicates up-regulation in wild cottons relative to domesticated cottons at 10 dpa, and bar in (B) denotes standard error. PAL, phenylalanine ammonium lyase; C4H, cinnamate-4-hydroxylase; 4CL, 4-coumaroyl-CoA synthase; CHI, chalcone isomerase; F3H, flavonol 3-hydroxylase; FLS, flavonol synthase; DFR, dihydroflavonol-4-reductase; ANS, anthocyanin synthase, LDOX, leucoanthocyanidin dioxygenase; ANR, anthocyanidin reductase; COMT, F5H, CCR, CCD.
doi:10.1371/journal.pgen.1004073.g004
Figure 5. Number of TFs differentially expressed between wild and domesticated cotton. Blue and red asterisk (*) represent over-represented TFs in wild and domesticated cottons relative to their counterparts at both developmental time points, respectively (proportion test; P,0.05).
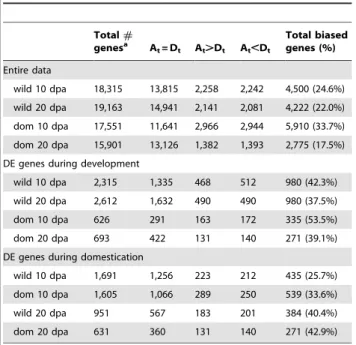
phenomenon termed homoeolog expression bias [54,55], the relative contribution of homoeologs to total gene expression was investigated. An average of 17,800 genes had homoeolog-specific reads, of which 17.5 to 53.5% showed unequal (biased) expression in any one case (Table 4). Notably, by far the highest percentage of genes showing biased homoeolog contributions to the transcrip-tome was at 10 dpa for domesticated cottons, a rate nearly twice that observed at 20 dpa. In addition, more genes at 10 dpa than at 20 dpa exhibit homoeolog bias in all comparisons (Table 4). Considering the entire data sets, which include all genes having a minimum number of homoeolog-specific reads (RPKM§1), there is no global bias in homoeolog expression in either wild or domesticated cottons; that is, despite appreciable gene-level bias, the number of genes that exhibit either At or Dt bias (where the lower case t designates homoeolog in the allopolyploid) are approximately equal (balanced homoeolog bias, sensu Grover et al. [54]). This same result also characterizes most other comparisons.
To assess how homoeolog usage is affected during development and by domestication, we compared thesamehomoeolog from two different developmental stages or from the two pools of wild vs. domestication cottons. During cotton fiber development from 10 dpa to 20 dpa, we observed more homoeolog expression change in wild cottons than in domesticated cottons (4,358 of 22,012 (19.8%) in wild vs. 2,110 of 19,974 (10.6%) in domesti-cated; Table 5) although there is no difference in DE genes between wild and domesticated cottons (Table 5). There were more homoeolog changes at 10 dpa than at 20 dpa (3,350 of 20,994 (16.0%) at 10 dpa vs. 2,433 of 21,230 (11.5%) at 20 dpa; Table 5) as a result of domestication. However, we observed balance in most comparisons; for example, there are similar numbers of At and Dt down- or up-regulation during fiber development in wild cottons (down-regulation of Atvs. Dt= 290
RNA-Seq, we determined that at least one-third and likely about half of the genes (depending on the RPKM threshold) in the cotton genome are expressed in developing fibers. This number is consistent with previous estimates of the fiber transcriptome diversity generated for G. hirsutum cv. TM1 and G. arboreum, notwithstanding the technical differences among studies [20,21]. It is striking that the genic diversity in the transcriptome of fibers, which are single cells, is comparable to that of entire young leaves ofG. hirsutum(Table 2) [55], which are far more complex organs comprising multiple different cell types and with varying cellular specializations and diverse metabolic roles. This comparison justifies the perspective that the cotton fiber transcriptome is extraordinarily rich and that it is subject to complex transcrip-tional regulation during fiber development.
One of the justifications for the experimental design used in the present study was to attempt to account for expression variation that might occurwithin wild andwithin domesticated G. hirsutum and hence account for this variation to strengthen inferences about the differences between these groups. Accordingly, we selected multiple accessions within each pool. For the two developmental stages studied here, 10 and 20 dpa, we estimate that, respectively, 3.1% (1,144) and 9.3% (3,487) of the duplicate gene pairs in the tetraploid cotton genome were differentially expressed between 10 and 20 dpa in domesticated and wild cottons, respectively. Importantly, when we reanalyze our RNA-Seq data, restricting our attention to the same two accessions as used in Rapp et al. [13], TM1 (domesticated) and TX2094 (wild), we observe about a 40% increase in the number of differentially expressed genes (6,908 vs. 4,946) (Table S2). These data indicate that inclusion of multiple accessions narrowed the differences between the two pools ‘‘wild’’ and ‘‘domesticated’’, boosting confidence in infer-ences regarding the effects of human selection, and in the process identifying expression variation arising from other causes.
In addition to bolstering the notion that the fiber transcriptome is highly diverse and dynamic, the results presented here include deep and rich data sets that can be mined for clues regarding processes of cellular development and those that have been most strongly affected by human-mediated directional selection under domestication. The data also provide new information on homoeolog usage and biases in a polyploid cell type. Each of these topics is discussed in more detail in the following.
Domestication prolonged fiber elongation during development
A body of work has established that cotton fiber development consists of stages that are well-defined temporally, i.e., fiber initiation (0–3 dpa), primary cell wall synthesis and elongation (3– 15 dpa), transition to secondary cell wall growth (15–20 dpa), secondary wall biosynthesis (20–40 dpa), and maturation (40– 50 dpa) [18]. Our observation of relatively little differentiation
dom 10 dpa 626 291 163 172 335 (53.5%)
dom 20 dpa 693 422 131 140 271 (39.1%)
DE genes during domestication
wild 10 dpa 1,691 1,256 223 212 435 (25.7%)
dom 10 dpa 1,605 1,066 289 250 539 (33.6%)
wild 20 dpa 951 567 183 201 384 (40.4%)
dom 20 dpa 631 360 131 140 271 (42.9%)
At= A-homoeolog; Dt= D-homoeolog; At= Dt, equal expression of homoeologs; At.Dt, biased expression of the Athomoeolog; At,Dt, biased expression of the Dthomoeolog; DE = differential expression from the contrasts of development (10 vs. 20 dpa) or domestication (wild vs. dom).
aincludes genes having at least RPKM§1 in either A or D-homoeolog specific reads across all biological replicates.
Comparison
Homoeolog changes from 10 dpa to
20 dpa Gene pairs in entire data Gene pairs in DE genes
wild cotton % dom. cotton % wild cotton % dom. cotton %
Development No changes 17,654 80.2 17,864 89.4 306 9.5 86 9.1
Total changed 4,358 19.8 2,110 10.6 2,929 90.5 861 90.9
both down-regulated 766 3.5 246 1.2 692 21.4 142 15.0
Atdown-regulated 615 2.8 302 1.5 290 9.0 76 8.0
Dtdown-regulated 603 2.7 283 1.4 321 9.9 79 8.3
both up-regulated 1,045 4.7 389 1.9 966 29.9 273 28.8
Atup-regulated 694 3.2 478* 2.4 320 9.9 150 15.8
Dtup-regulated 622 2.8 411 2.1 336 10.4 141 14.9
Atup, Dtdown 7 0.0 0 0.0 4 0.1 0 0.0
Atdown, Dtup 6 0.0 1 0.0 0 0.0 0 0.0
Homoeolog changes from wild to dom Gene pairs in entire data Gene pairs in DE genes
10 dpa % 20 dpa % 10 dpa % 20 dpa %
Domestication No changes 17,644 84.0 18,797 88.5 1,037 31.9 178 15.8
Total changed 3,350 16.0 2,433 11.5 2,215 68.1 948 84.2
both down-regulated 480 2.3 337 1.6 464 14.3 250 22.2
Atdown-regulated 620 3.0 456 2.1 290 8.9 118 10.5
Dtdown-regulated 637 3.0 494 2.3 355* 10.9 152 13.5
both up-regulated 449 2.1 275 1.3 409 12.6 158 14.0
Atup-regulated 585 2.8 440 2.1 348 10.7 145 12.9
Dtup-regulated 554 2.6 416 2.0 341 10.5 124 11.0
Atup, Dtdown 16 0.1 8 0.0 6 0.2 0 0.0
Atdown, Dtup 9 0.0 7 0.0 2 0.1 1 0.1
*indicates that the number of genes belonging to ‘‘Atup-regulated’’ and ‘‘Dtdown-regulated’’ is statistically different from ‘‘Dtup-regulated’’ and ‘‘Atdown-regulated’’, respectively (P,0.05).
doi:10.1371/journal.pgen.1004073.t005
Cotton
Fiber
Evolution
Genetics
|
www.plosgen
etics.org
12
January
2014
|
Volume
10
|
Issue
1
|
developmental program. Based on fiber growth curve analyses, fiber elongation appears modest until 15 dpa in wild cottons, yet is almost complete by 20 dpa [56]. Thus, 10 dpa from wild cottons represents an early stage of fiber elongation in wild, relative to domesticated,G. hirsutum, while by 20 dpa fibers from wild cotton likely have completed primary cell wall synthesis and have entered the transition to secondary wall synthesis. This inference is also supported by expression patterns of genes previously reported from gene-by-gene surveys; wild cottons showed more up-regulations of genes related to fiber initiation and secondary wall biosynthesis at 10 and 20 dpa, respectively, compared to domesticated cottons (Table S4). This difference in developmental timing might account for the three-fold increase in the number of differential expressed genes between the two developmental stages of wild cottons relative to domesticated cottons (Figure 1).
Previous studies support this interpretation of a period of prolonged fiber elongation under domestication, and in parallel in different domesticated cotton species. Notably, similar conclusions have been reached for diploid domesticated cotton, G. arboreum [58], and in a second domesticated allopolyploid cotton, G. barbadense[59]. In addition, Hu et al. showed, in a recent, high-throughput iTRAQ proteomic analysis, that the proteome of domesticated cotton during early fiber elongation (5–10 dpa) was similar to that of later developmental stage of wild cottons (10– 20 dpa) [59]. Thus, it seems that human domestication may have induced parallel prolongations and developmental shifts on the fiber elongation period in both diploid and allopolyploid species, as evidenced by growth curve analysis [56], and both transcrip-tomic and proteomic analyses [58,59]. These studies, as well as light microscopy observations [13] which demonstrate that wild and domesticatedG. hirsutumshare similar timing and morphology of early wall thickening, point to the need to develop a deeper understanding of the underlying developmental programs and architecture of fiber growth and evolution. In a recent metabolic profiling study [12] of a lintless mutant and its wild type (WT)G. hirsutum relative, 487 metabolites identified from nine develop-mental time points clearly differentiated the metabolomic profiles of the lintless mutant from that of WT cotton during elongation, but there was no clear differentiation between the two forms during fiber initiation (23 to 3 dpa). This suggests that the short period of fiber elongation in the lintless mutant, where fiber cells become arrested at about 6 mm of linear growth, resembles, to a certain extent, the wild representatives of the domesticated species. Considering the evolutionary, morphological transformation of fiber from lintless in wild to linted in domesticated cottons [4], prolonged fiber elongation was a key innovation for longer fiber, which is apparent at the transcript, protein, and metabolite levels. Additional insight into the nature of this developmental shift will probably arise from further integrated studies of various ‘‘omics’’, combined with a denser sampling of developmental time points.
the highest level in 10 dpa fibers [51], up-regulation of this pathway indicates active fiber elongation at 10 dpa compared to 20 dpa in wild cottons. For example,GAST1 PROTEIN HOMO-LOG 4(GASA4) was known to promote GA response and regulate redox status in Arabidopsis [60], and two cotton homologues (Gorai.006G017000, Gorai.012G054200) were highly expressed and up-regulated at 10 dpa compared to 20 dpa in wild cottons. On the other hand, ‘‘response to stress’’ pathways were enriched in 20 dpa wild cottons, thus, genes related to stress were up-regulated, including those in the dehydrin family protein (EARLY RESPONSIVE TO DEHYDRATION 10; Gorai.002G119600), senescence-associated genes (Gorai.012G124700), late embryo-genesis abundant like 5 (Gorai.002G119600), and cold-regulated 47 (Gorai.009G189500). These genes are known to be expressed in response to abiotic stress, such as high salinity, drought, and cold inArabidopsis[61–63], implying that wild cottons are utilizing stress-response pathways at 20 dpa. This inference was also supported by up-regulation of many ROS genes (see below), suggesting that up-regulation of stress-related gene expression in wild cottons could have resulted in halting fiber elongation and promoting the transition to secondary wall biosynthesis.
Many genes related to phenylpropanoid biosynthesis were up-regulated during fiber development in wild cottons (Figure 4A) with expression levels that were significantly higher at 10 than at 20 dpa (Figure 4B), in agreement with previous studies [64,65]. The same differential regulation characterized wild vs. domesti-cated cottons at both developmental time points (discussed further below).
Wild and domesticated cottons exhibited no differences in homoeolog utilization at both expression (Table 4) and change (Table 5). This is consistent with Yoo et al. [55] and Rambani et al. [66] which showed an overall equal usage of both homoeologs in young leaf and petal tissues of both TX2094 and Maxxa, respectively. These results suggest that domestication has not affected the utilization of homoeologs from the two co-resident genomes of allopolyploid cotton. However, further study is required to evaluate whether this equal usage of homoeologs was derived from vertical inheritance of progenitor A and D genome conditions, of if instead trans-acting regulatory factors overwhelmed pre-existing, evolvedcis- andtrans- differences that accumulated during evolutionary divergence of the two progenitor diploids
Domestication may have reallocated resources from stress-response pathways to fiber growth
some of the molecular underpinnings of this remarkable morpho-logical modification [12,13,20–22,58,59,67]. Here we tried to build on this initial insight into the effects of the domestication and plant improvement process by generating transcriptomes from multiple accessions, thus permitting gene expression changes resulting from domestication to be isolated from those arising from other causes. The wild and domesticated cottons selected exhibit the typical fiber characteristics of their respective pools in fiber color and fiber length (Figure 1), and they also were highly differentiated with respect to their transcriptomes (Figure S1). One key result is the observation of greater gene expression differen-tiation between wild and domesticated cottons at 10 than 20 dpa (Figure 1), consistent with previous studies [11,13]. These were partitioned almost equally toward either wild or domesticated cottons (Figure 1; dom vs. wild = 1,839 vs. 1,736). However, if we consider only the more highly expressed genes, i.e., those with a RPKM§5, twice as many genes were up-regulated in domesti-cated cottons compared to wild cottons at 10 dpa (dom vs. wild = 1,476 vs. 733), implicating a ramping up of cellular machinery involved in primary wall synthesis and perhaps down regulation of other pathways (see below). A corollary implication is that the majority of up-regulated genes in the wild cottons compared to domesticated cottons at 10 dpa were expressed at a lower level (RPKM,5). Similar trends were observed in the 20 dpa comparison, but with less imbalance and smaller absolute numbers (dom vs. wild = 349 vs. 302 with RPKM§5).
Gene enrichment analyses indicate that specific biological processes were enriched as a consequence of domestication. In particular, the combined significance of functional suggestions become apparent when one considers carbohydrate and fatty acid metabolism with respect to glycolysis, cell wall component biosynthesis, the pentose phosphate pathway, and phenylpropa-noid biosynthesis [68–70]. In domesticated cottons, carbon resources appear to be more heavily invested in cell wall component biosynthesis, such as cellulose and matrix polysaccha-rides, as well as energy production through glycolysis (Figure 6). In addition, acetyl-CoA, a product of glycolysis, is linked to synthesis of VLCFAs that are precursors for phospholipids and sphingolip-ids, essential components of plasma membranes [70]. VLCFAs accumulate preferentially in elongating fibers andKCSs, the rate-limiting enzyme in biosynthesis of VCLFAs [71], are also up-regulated during fiber elongation [29–31]. In this study, we also observed severalKCSs that were highly expressed in domesticated cottons at 10 dpa (Figure S5). Notably, five of nine KCSs differentially expressed exhibited A-homoeolog expression bias (Table S5), implying that domestication process could have selected maternal parental copy only. Further study on the genome scale is required to elucidate whether this phenomenon is stochastic or linked to specific pathway(s). Other genes related to this pathway were also up-regulated in domesticated cotton compared to wild cottons, including beta-ketoacyl reductase (KCR), fatty acid hydroxylase (CER3/WAX2), fatty acid reductase (CER4/FAR3), lipid transport protein (LTP), and ATP-binding cassette transporter (WBC1) (Figure 6). Noteworthy,CesA,CslCand CslDgenes were up-regulated in domesticated cottons at 10 dpa only, whileCesAgenes were up-regulated in wild cottons at 20 dpa (Figure 2). This indicates thatCslCandCslDgenes have become up-regulated by domestication early in fiber development. Other fiber elongation-related genes, e.g., profilin and its partners, were also up-regulated in domesticated cottons at 10 dpa (Figure 3, Figure S7), including members of one sub-clade ofACT7(Figure 3). In Arabidopsis, ACT7 is a vegetative actin, along withACT2 and ACT8, (the latter two have no obvious homologs in cotton), and are involved in root growth and epidermal cell specification [39].
Here, we observe two sub-clades of ACT7 in cotton, one up-regulated in wild cottons, while the other is up-up-regulated in domesticated cottons (Figure 3). Thus, the domestication process may have recruited enhanced utilization of one sub-clade ofACT7 for greater fiber elongation.
In wild cottons, nucleotide biosynthesis and phenylpropanoid biosynthesis were enriched, based on differential expression. In particular, many genes related to phenylpropanoid biosynthesis were up-regulated during fiber development and domestication in wild cottons (Figure 4A), and their expression levels were much higher at 10 than 20 dpa (Figure 4B), in agreement with previous studies [64,65]. Notably, phenylpropanoids, particularly flavo-noids, are known to inhibit fiber elongation [64], but protect cells from abiotic and biotic stresses [72]. The involvement of flavonoids in fiber processes has been shown in many studies at the transcript, protein, and metabolic levels [12,13,20,64,73]. Tan et al. [64], in particular, showed that the flavonoid naringenin negatively regulates fiber development and that higher levels of naringenin accumulate in short, brown fibers.
This up-regulation of genes related to phenylpropanoid biosynthesis as well as nucleotide biosynthesis is illustrated in the model suggested in Figure 6, presented within the conceptual framework of carbon/nitrogen balance. For optimal growth and development, carbon and nitrogen metabolism need to be tightly coordinated [74]. Based on the presumed function of the differentially expressed genes, more C compound related pathways are enriched in domesticated cottons relative to wild cottons, as reflected in the greater allocation to cell wall component synthesis (e.g., cellulose, VCLFA), energy generation through glycolysis, and amino acid synthesis (Figure 6). In turn, these biological processes might lower C/N, giving rise to less accumulation of anthocyanin. In contrast, nitrogen related pathways were enriched in wild cottons relative to domesticated cotton, as represented by nucleotide biosynthesis and phenylpropanoid biosynthesis. These two pathways can redirect carbon flow to nitrogen metabolism by diverting glucose-6-phosphate (G6P) into the pentose phosphate pathway or phosphoenolpyruvate (PEP) to the phenylpropanoid pathway (Figure 6). It may be, therefore, that the domestication process reallocated carbon resources toward carbohydrate and fatty acid metabolism. This speculation is also supported by a comparative metabolomics survey [12] of a lintless mutant and its wild type progenitor; the lintless mutant exhibited up-regulation of genes related to nitrogen compound metabolism along with accumulation of nitrogen compounds, compared to its WT. This phenomenon remains to be demonstrated at the metabolic level in wild and domesticated cottons.
several plant hormone responses, including seed germination, lignin biosynthesis, programmed cell death, and osmotic stress, while at high concentrations ROS are known to cause oxidative damage to proteins, lipids, and DNA [81]. It has been suggested that proper regulation of ROS homeostasis is necessary for cotton fiber elongation [28,58]. For example, many ROS genes were up-regulated in parallel in domesticated diploid and polyploid cottons during early fiber elongation (2 dpa) [82], but only a few genes were investigated during fiber elongation, including ascorbate peroxidase (APX) [83], copper/zinc superoxide dismutase (CSD) [17], and peroxidase (POX) [84], which were all up-regulated in domesticated cottons relative to wild cottons at 10 dpa (Table S4). H2O2 accumulated at low levels during early elongation and peaks at 20 dpa in domesticated cottons [83,85], but its levels have not been examined in wild accessions. Interestingly, recent analysis of transcriptomic profiles of a lintless mutant compared to its wild typeG. hirsutumat 8 and 12 dpa showed higher expression levels of genes related to stress-response processes [12]. Up-regulation of
stress-related genes in the lintless mutant and wild accessions ofG. hirsutumrelative to domesticated cottons suggests elevated levels of ROS in mutant and wild cotton fibers. It would be interesting to carefully evaluate the levels of different ROS molecules during development in wild vs. cultivated cotton under controlled conditions.
Concluding remarks
Although the transcriptomic data presented here are extraordi-narily complex, as is usually the case in comparative profiling experiments, the data allow a speculative scenario to emerge from a consideration of the different classes of genes and pathways that are enriched under domestication. Specifically, we raise the suggestion that initial domestication of G. hirsutum, followed by several millennia of improvement and breeding, resulted in a shift or reallocation of resources from stress-related pathways in wild cottons to greater growth in domesticated forms. We envision that the reallocation and accompanying divergence in multiple pathways Figure 6. Carbohydrate and fatty acid metabolisms, focusing on cell wall biosynthesis[68–70].Red text and line indicate up-regulated genes or pathways in domesticated cottons relative to wild cottons at 10 dpa, while blue text and lines show up-regulated genes or pathways in wild cottons compared to domesticated cottons at 10 dpa. Purple text indicates that the genes were up- or down-regulated during domestication. Blue and pink shaded boxes show enriched pathways in wild and domesticated cottons compared to their counterparts, respectively. ADPG, ADP-Glucose (ADPG); BGAL,b-galactosidase; BGLU,b-1,3-glucosidase; BXL,b-xylosidase; CER3/WAX2, fatty acid hydroxylase superfamily; CER4/FAR3, fatty acid reductase 3; DAHP, 3-deoxy-D-arabino-heptulosonate-7-phosphate; DHAP, dihydroxyacetone phosphate; E4P, erythrose-4-phosphate; F6P, Fructose-6-Phosphate; GAE, UDP-D-glucuronate-4-epimerase; G1P, Glucose-1-Phosphate; G3P, Glyceraldehyde-3-phosphate; G6P, Glucose-Fructose-6-Phosphate; KCR, beta-ketoacyl reductase; KCS, 3-ketoacyl-CoA synthase; LTP, lipid transfer protein; PE, pectinesterase; PEP, phosphoenolpyruvate; PG2, polygalacturonase 2; PHS2, alpha-glucan phosphorylase 2; PL, Pectate lyase; R5P, Ribose-5-phosphate; SUS, sucrose synthase; UGD, UDP-glucuronate decarboxylase; UGDH, UDP-glucose-6-dehydrogenase; UGP, UDP-glucose pyrophosphorylase; VLCFA, very long chain fatty acids; WBC1, ATP-binding cassette transporter white-brown complex homolog protein 1; XTH, Xyloglucan endotransglycosylase.
led to a prolonged period of fiber elongation, which at maturity are recognized now as the long, white, and fine fibers of modern cotton commerce. This scenario should become testable using a combi-nation of forward genetic tools combined with advanced segregating populations (e.g., isogenic introgression lines), in conjunction with genomic, transcriptomic, proteomic, and metabolomic profiling. This systems approach holds the promise of improving our understanding of the evolutionary modification of a remarkable single-celled structure, while simultaneously providing clues to advance cotton breeding objectives.
Materials and Methods
Plant materials and library construction
Four wild and five domesticatedG. hirsutumwere selected for fiber transcriptome profiling based on their geographic origins and cotton fiber traits (Table 1; Figure 1). Wild cottons were originally from Yucatan, Mexico [86], while domesticated cottons were from four major cotton cultivation areas, i.e., Plains, Delta, and eastern and western U.S.A. Between three and twenty ovaries were collected for domesticated and wild cottons, respectively, from two developmental stages, 10 and 20 dpa, and were immediately dissected to harvest ovules, which were snap-frozen in liquid nitrogen until extraction. RNA was extracted using either a hot borate/lithium chloride procedure [87] or a CTAB extraction protocol [88], then purified by the RNeasy Plant Mini Kit (Qiagen, Stanford, CA, USA). Purified RNAs were quantified and qualified with Agilent 2100 Bioanalyzer (Agilent, Santa Clara, CA, USA). After mRNA purification using the MicroPoly(A) Purist kit (Ambion, Austin, TX, USA), RNA-Seq libraries were constructed with NEBNext mRNA Sample Prep Master Mix Set 1 following the manufacturer’s suggestion (New England Biolabs, MA, USA). The constructed libraries, indexed with six nucleotide sequences, were pooled together with equimolar amounts and were sequenced on the Illumina HiSeq 2000 sequencer with 100 base reads at the Genomics Core Facility at the University of Oregon. Short read sequences were deposited in the NCBI Sequence Read Archive (SRA) with a study number SRP017061.
Analysis of RNA-seq data: Mapping and differential expression
Raw reads were sorted into the correct accession according to their indexed nucleotides. After trimming the indexed sequences, reads were filtered based on the quality scores (Q = 20) and read length (§17 bp) with a fastx tool kit (http://hannonlab.cshl.edu/ fastx_toolkit/index.html). Fastq formatted reads were mapped to the reference genome (Cotton D V2.0; 37,505 genes) [16] using GSNAP [89]. Reads with SNP information between A and D genome progenitors were parsed into A or D homoeolog-specific bins (At or Dt) using PolyCat (http://bioinfo3.pgml.uga.edu/ polyCat/upload.html) [90].
Before identifying differentially expressed genes in each comparison of domestication (wild vs. domesticated G. hirsutum) and development (10 vs. 20 dpa), we examined the sample relations based on a multidimensional scale (or principal coordinate) using the edgeR package (ver. 2.0.5) in R software (ver. 2.16.0) [91]. If one sample shows a large distance from the others, that sample was removed for computing differential expression. The DESeq package (ver. 2.1.0) was used to detect differentially expressed genes in each contrast of domestication and development [92], and differential expression was defined when a gene showed at least 1.5-fold change with RPKM§1 (RPKM: Reads Per Kilobase of gene model per Million mapped
reads) [19] in all biological replicates of either wild or domesticated G. hirsutum. Also, to evaluate whether specific chromosomes or chromosome regions were selected during domestication and development, we investigated the distribution of differentially expressed genes on the 13 chromosomes in the haploid diploid cotton genome. For homoeolog-specific read counts, expression bias was evaluated using Fisher’s exact test of the edgeR package. The distribution of p-values was controlled for a false discovery rate (FDR) by the BH method [93] at a= 0.05. Homoeolog-specific reads were analyzed as described in Yoo et al. [55], and differential expression was delimited by 1.5-fold expression changes with RPKM§1 in either At or Dt reads across all biological replicates. In addition, we traced homoeolog expression changes during development and by domestication via comparing homoeolog expression patterns in each contrast. For example, At reads at 10 dpa were more down-regulated or highly expressed in domesticated cottons than in wild cottons, this expression change was tabulated as reflecting down- or up-regulation of At, respectively, during domestication.
For several gene families where some members are known to be involved in fiber development, we examined expression patterns of individual paralogs and (homoeologs) based on their phylogenetic relationships. Sequences were annotated by homology search against Arabidopsis thaliana and aligned via Clustal W [94]. Phylogenetic trees were constructed using MEGA 5.05 with a default option of Maximum Parsimony [95], and majority rule consensus trees were constructed.
Functional analysis of differentially expressed genes To explore the nature of the biological pathways that were altered by domestication or that change during development, differentially expressed genes in each contrast were analyzed by SEA tool of agriGO (http://bioinfo.cau.edu.cn/agriGO/index. php) which performs GO term enrichment in one set of genes by comparing it to a reference list using fold changes [96]. For SEA, we used genes identified as differentially expressed (RPKM§5 in either wild or domesticated cottons) in each contrast, with multi-test adjustment of the Benjamini-Yekutieli method (FDR,0.05) [97], and a minimum 5 mapping entries.
Supporting Information
Figure S1 Multidimensional scaling (MDS) plot showing relationships among samples in two dimensions. Because Maxxa at 10 dpa exhibited a large distance from other domesticated cottons and was embedded in wild cottons from 10 dpa, it was removed from further analysis. Red and blue circles indicate domesticated cottons from 10 and 20 dpa, respectively, while red and blue triangles represent wild cottons from 10 and 20 dpa, respectively.
(PPTX)
Figure S2 (A) CesA and Csl gene expression patterns during development. Inside and outside circles show the expression variation in domesticated and wild cottons, respectively. Blue and red circles indicate up-regulation at 10 and 20 dpa, respectively. Grey circles denote lack of differential expression, while white circles indicate lack of expression (zero read count). (B) Expression levels ofCesAgenes. (C) Expression levels ofCslgenes. Bars in the charts show standard errors.
(PPTX)
Figure S3 Expression patterns of XTH genes in developing cotton fibers. Bar in the chart shows standard error.
(PPTX)
Figure S6 Phylogenetic relationship of FLA homologues from Arabidopsis thalianaandGossypium raimondii. SeveralFLAhomologues fromG. hirsutumwere included (e.g.,GhFLA; Huanget al.2013) and group information is based on MacMillanet al.(2010). Blue and red arrows indicate genes up-regulated in wild and domesticated cottons at 10 dpa, respectively.
(PPTX)
Figure S7 The expression patterns of PROFILIN genes and several of its partners in wild and domesticated cottons.
(PPTX)
Figure S8 Expression patterns of MYB transcription factor related to phenylpropanoid biosynthesis.
(PPTX)
Table S1 Number of differentially expressed genes in developing cotton fibers within wild and domesticated cottons using subsets of RNA-Seq data and two different techniques.
(XLSX)
Table S2 Number of differentially expressed genes in developing cotton fibers between wild and domesticated cottons using subsets of RNA-Seq data and two different techniques. Grey shaded data are from the entire data set analysis, and red text indicates the use of biological replicates from the same accession. As for RNA-Seq data, RPKM§1 was considered for differential expression if not specified. (XLSX)
Table S3 Chromosomal distribution of differentially expressed genes on Cotton D genome. The first table is from comparison of development, and the second one is from domestication
were normalized with RPKM. (XLSX)
Table S6 Transcription factors that are the most highly expressed (RPKM§100) in developing fibers and/or which are differentially expressed between wild and domesticated cottons (bold text, P,0.05). Underlined indicates differential expression when one domesticated accession was excluded.
(XLSX)
Table S7 Comparison of results from Single Enrichment Analysis (SEA) of differentially expressed genes across two developmental stages and between wild and domesticated cottons. In ontology, P, M, and C indicate Biological Process, Molecular Function, and Cellular Components, respectively. The yellow-to-red coloyellow-to-red blocks in CM (colorful mode) represent the level of up-regulation of each term; gray blocks indicate that the term is not significant. Numbers under CM correspond to the each compar-ison set, e.g., (1) shows SEA results for up-regulated at 10 dpa compared to 20 dpa in domesticated cottons.
(XLSX)
Acknowledgments
We thank Justin Page and Joshua Udall for providing access to PolyCat prior to its release. We also express our gratitude to Corrinne Grover and Jin Koh for bioinformatics assistance.
Author Contributions
Conceived and designed the experiments: MJY JFW. Performed the experiments: MJY. Analyzed the data: MJY. Contributed reagents/ materials/analysis tools: MJY JFW. Wrote the paper: MJY JFW.
References
1. Olsen KM, Wendel JF (2013) A bountiful harvest: genomic insights into crop domestication phenotypes. Annu Rev Plant Biol 64: 47–70.
2. Olsen KM, Wendel JF (2013) Crop plants as models for understanding plant adaptation and diversification. Front Plant Sci 4: 290.
3. Doebley JF, Gaut BS, Smith BD (2006) The molecular genetics of crop domestication. Cell 127: 1309–1321.
4. Wendel JF, Flagel L, Adams KL (2012) Jeans, genes, and genomes: cotton as a model for studying polyploidy. In: Soltis PS, Soltis DE, editors. Polyploidy and Genome Evolution. Berlin: Springer. pp. 181–207.
5. Wendel JF, Cronn RC (2003) Polyploidy and the evolutionary history of cotton. Adv Agron 78: 139–186.
6. Jiao Y, Wickett NJ, Ayyampalayam S, Chanderbali AS, Landherr L, et al. (2011) Ancestral polyploidy in seed plants and angiosperms. Nature 473: 97–100. 7. Bao Y, Hu G, Flagel LE, Salmon A, Bezanilla M, et al. (2011) Parallel
up-regulation of the profilin gene family following independent domestication of diploid and allopolyploid cotton (Gossypium). Proc Natl Acad Sci U S A 108: 21152–21157.
8. Udall JA, Swanson JM, Haller K, Rapp RA, Sparks ME, et al. (2006) A global assembly of cotton ESTs. Genome Res 16: 441–450.
9. Lacape JM, Claverie M, Vidal RO, Carazzolle MF, Guimaraes Pereira GA, et al. (2012) Deep sequencing reveals differences in the transcriptional
landscapes of fibers from two cultivated species of cotton. PLoS One 7: e48855.
10. Hinchliffe DJ, Turley RB, Naoumkina M, Kim HJ, Tang Y, et al. (2011) A combined functional and structural genomics approach identified an EST-SSR marker with complete linkage to the Ligon lintless-2 genetic locus in cotton (Gossypium hirsutumL.). BMC Genomics 12: 445.
11. Liu K, Sun J, Yao L, Yuan Y (2012) Transcriptome analysis reveals critical genes and key pathways for early cotton fiber elongation in Ligon lintless-1 mutant. Genomics 100: 42–50.
12. Naoumkina M, Hinchliffe DJ, Turley RB, Bland JM, Fang DD (2013) Integrated metabolomics and genomics analysis provides new insights into the fiber elongation process in Ligon lintless-2 mutant cotton (Gossypium hirsutumL.). BMC Genomics 14: 155.
13. Rapp RA, Haigler CH, Flagel L, Hovav RH, Udall JA, et al. (2010) Gene expression in developing fibres of Upland cotton (Gossypium hirsutumL.) was massively altered by domestication. BMC Biol 8: 139.
14. Wu Y, Machado AC, White RG, Llewellyn DJ, Dennis ES (2006) Expression profiling identifies genes expressed early during lint fibre initiation in cotton. Plant Cell Physiol 47: 107–127.