In Vivo Response to Methotrexate Forecasts
Outcome of Acute Lymphoblastic Leukemia
and Has a Distinct Gene Expression Profile
Michael J. Sorich1,2[, Nicolas Pottier1,3[, Deqing Pei4, Wenjian Yang1, Leo Kager1,5, Gabriele Stocco1,6, Cheng Cheng4, John C. Panetta1,7, Ching-Hon Pui7,8, Mary V. Relling1,7,9, Meyling H. Cheok1,7, William E. Evans1,7,9*
1Hematological Malignancies Program and the Department of Pharmaceutical Sciences, St. Jude Children’s Research Hospital, Memphis, Tennessee, United States of America,2Sansom Institute, University of South Australia, Adelaide, Australia,3EA2679, Faculte´ de Me´decine de Lille, Pole Recherche, Lille, France,4Department of Biostatistics, St. Jude Children’s Research Hospital, Memphis, Tennessee, United States of America,5Department of Hematology-Oncology, St. Anna Children’s Hospital, Vienna, Austria,6Instituto di Ricovero e Cura a Carattere Scientifico, Burlo Garofolo and University of Trieste, Trieste, Italy,7University of Tennessee, Memphis, Tennessee, United States of America,8Department of Oncology, St. Jude Children’s Research Hospital, Memphis, Tennessee, United States of America,9Pharmacogenetics of Anticancer Agents Research Group, National Institutes of Health Pharmacogenetics Research Network, Memphis, Tennessee, United States of America, and Chicago, Illinois, United States of America
Funding:This work was supported in part by the following NIH grants; R37 CA36401 (WEE, MVR, CHP), R01 CA78224 (WEE, MVR, CHP), RO1 CA51001 (MVR, CHP), U01 GM61393 (MVR, WEE), Cancer Center Support Grant CA21765, by an FM Kirby Clinical Research Professorship from the American Cancer Society (C-HP), and by the American Lebanese Syrian Associated Charities. MJS was supported by a CJ Martin Fellowship from the National Health and Medical Research Council of Australia. GS was supported by a fellowship from the IRCCS,‘‘Burlo Garofolo’’in Trieste, by a
‘‘Progetto Giovani Ricercatori’’
fellowship from the University of Trieste, and by the Italian Society of Pharmacology. Funding organizations did not have any role in study design, data collection or analysis, decision to publish, or preparation of the manuscript.
Competing Interests:The authors have declared that no competing interests exist.
Academic Editor:Alain Fischer, Hoˆpital Necker-Enfants Malades, France
Citation:Sorich MJ, Pottier N, Pei D, Yang W, Kager L, et al. (2008) In vivo response to methotrexate forecasts outcome of acute lymphoblastic leukemia and has a distinct gene expression profile. PLoS Med 5(4): e83. doi:10.1371/journal.pmed.0050083
Received:October 15, 2007
Accepted:March 3, 2008
Published:April 15, 2008
Copyright:Ó2008 Sorich et al. This is an open-access article distributed under the terms of the Creative Commons Attribution License, which permits unrestricted use, distribution, and reproduction in any medium, provided the original author and source are credited.
Abbreviations:See section at end of manuscript.
* To whom correspondence should be addressed. E-mail: william.evans@ stjude.org
[These authors contributed equally to this work.
A B S T R A C T
Background
Childhood acute lymphoblastic leukemia (ALL) is the most common cancer in children, and can now be cured in approximately 80% of patients. Nevertheless, drug resistance is the major cause of treatment failure in children with ALL. The drug methotrexate (MTX), which is widely used to treat many human cancers, is used in essentially all treatment protocols worldwide for newly diagnosed ALL. Although MTX has been extensively studied for many years, relatively little is known about mechanisms of de novo resistance in primary cancer cells, including leukemia cells. This lack of knowledge is due in part to the fact that existing in vitro methods are not sufficiently reliable to permit assessment of MTX resistance in primary ALL cells. Therefore, we measured the in vivo antileukemic effects of MTX and identified genes whose expression differed significantly in patients with a good versus poor response to MTX.
Methods and Findings
We utilized measures of decreased circulating leukemia cells of 293 newly diagnosed children after initial‘‘up-front’’in vivo MTX treatment (1 g/m2) to elucidate interpatient differences in the antileukemic effects of MTX. To identify genomic determinants of these effects, we performed a genome-wide assessment of gene expression in primary ALL cells from 161 of these newly diagnosed children (1–18 y). We identified 48 genes and two cDNA clones whose expression was significantly related to the reduction of circulating leukemia cells after initial in vivo treatment with MTX. This finding was validated in an independent cohort of children with ALL. Furthermore, this measure of initial MTX in vivo response and the associated gene expression pattern were predictive of long-term disease-free survival (p,0.001,p¼0.02).
Conclusions
Together, these data provide new insights into the genomic basis of MTX resistance and interpatient differences in MTX response, pointing to new strategies to overcome MTX resistance in childhood ALL.
Trial registrations: Total XV, Therapy for Newly Diagnosed Patients With Acute Lymphoblastic Leukemia, http://www.ClinicalTrials.gov (NCT00137111); Total XIIIBH, Phase III Randomized Study of Antimetabolite-Based Induction plus High-Dose MTX Consolidation for Newly Diagnosed Pediatric Acute Lymphocytic Leukemia at Intermediate or High Risk of Treatment Failure (NCI-T93-0101D); Total XIIIBL, Phase III Randomized Study of Antimetabolite-Based Induction plus High-Dose MTX Consolidation for Newly Diagnosed Pediatric Acute Lymphocytic Leukemia at Lower Risk of Treatment Failure (NCI-T93-0103D).
Introduction
Childhood acute lymphoblastic leukemia (ALL), the most common cancer in children, can now be cured in approx-imately 80% of patients [1,2]. Pharmacogenomics aims to elucidate the genomic determinants of treatment response and why treatment fails to cure the remaining 20% of patients, many of whom have favorable prognostic features [3,4]. Prior studies have provided insight into the genomic determinants of resistance to several antileukemic agents [5], but methodological constraints have precluded such genome-wide studies of in vitro methotrexate (MTX) resistance. This research gap is unfortunate because MTX is widely used in the treatment of many human cancers, including essentially all treatment protocols for newly diagnosed ALL [1].
The pharmacokinetics and pharmacodynamics of MTX in ALL cells are well understood, whereas the genomic determinants of the antileukemic effects of MTX remain to be elucidated [6,7]. Cellular uptake of MTX is mediated by the protein reduced folate carrier [8], whereas its efflux is mediated by ATP-binding cassette (ABC), subfamily C 1 (ABCC1) and ABCC4 [9–11]. MTX is a tight-binding inhibitor of its primary target, enzyme dihydrofolate reductase (DHFR), which disrupts cellular folate metabolism [12]. Within leukemic cells, MTX is metabolized into poly(c -glutamate) forms (MTXPGs) by an adenosine triphosphate (ATP)-dependent reaction catalyzed by folylpolyglutamate synthetase [13]. Compared to their monoglutamate form, MTXPGs are retained longer in cells because they are not readily effluxed by ABC transporters [14,15]. MTXPGs are more potent inhibitors of other target enzymes such as thymidylate synthetase, glycinamide ribonucleotide trans-formylase, and aminoimidazole carboxamide transformylase. These enzymes are involved in biosynthetic pathways that are critical for DNA synthesis, DNA repair, and cell replication [14,15]. Furthermore, accumulation of MTXPG has also been shown to differ among major ALL subtypes [16] and to influence treatment response and outcome in childhood ALL [17–19].
A more complete understanding of the mechanisms of MTX resistance in ALL cells is needed if new treatment strategies are to be developed for patients whose leukemia is resistant to this important component of ALL chemotherapy [6]. Prior genomic studies of ALL chemotherapy resistance have not focused on MTX [5,20,21], because the resistance of primary ALL to MTX cannot be accurately measured by in vitro methods such as the MTT assay [22]. For this reason, we used the in vivo response of newly diagnosed patients to initial single-agent MTX treatment, measured as an initial decrease in circulating ALL cells, to quantitate the anti-leukemic effects of MTX. We then aimed to identify genes whose expression in primary ALL cells is significantly related to the in vivo antileukemic effects of MTX.
Methods
Patients and Genetic Characterization of Leukemia Cells
A total of 293 children aged 18 y or younger with newly diagnosed ALL, enrolled on the St. Jude Total Therapy XIII and XV protocols, were included in this study (Figures 1 and S1). The investigation was approved by the Institutional Review Board at St. Jude Children’s Research Hospital, and
signed informed consent was obtained from parents or legal guardians before enrollment. Patient characteristics (race, sex, age, pretreatment white blood cell count [WBCPRE], ALL
subtype) were assigned by investigators at St. Jude Children’s Research Hospital. Race, sex, and age were determined by questionnaire; WBCPRE, ALL subtype were determined
according to the clinical protocol. The diagnosis of ALL was based on morphology, cytochemical staining, and immunophenotyping of blast cells for classification as B cell lineage or T cell lineage, as previously described [23–28]. The only patients excluded were those who did not have a diagnosis of ALL, or were aged,1 y or.18 y, or were given ALL treatment prior to referral to SJCRH.
After stratification for age, WBCPRE, immunophenotype,
and sex, patients were randomized to receive initial intra-venous treatments of high-dose MTX (HDMTX: 1 g/m2) either
as HDMTX4H (HDMTX by infusion over 4 h; n¼ 108), as HDMTX24H (HDMTX by infusion over 24 h;n¼125), or as HDMTX24HþMP (HDMTX by infusion over 24 h plus mercaptopurine [MP] 1 g/m2 by intravenous injection; n ¼ 60). All patients who received allopurinol less than 72 h prior to HDMTX were excluded from the analyses because of potential effects on de novo purine synthesis.
Circulating leukemia cells were measured before therapy (WBCPRE) and at day 3 following start of HDMTX treatment
(WBCDay3), prior to the administration of other antileukemic
agents. Leukocyte counts were determined with a Coulter counter (model F_STKR; Coulter, Hialeah, Florida, United States).
Isolation of ALL Blasts from Bone Marrow Aspirate
ALL blasts were obtained from bone marrow aspirates at diagnosis and 42–44 h following treatment. Samples consisted of 5–10 ml of bone marrow collected in syringes containing 800 units of heparin and kept on ice until processed. Leukemic cells were obtained by density separation over a Ficoll-Hypaque gradient and washed three times with a solution of HEPES, Hanks buffered solution, and heparin, as previously described in detail [18].
RNA Extraction and Gene Expression Profiling of Diagnostic Bone Marrow ALL Cells
Of the 293 patients treated with up-front HDMTX, 161 had sufficient diagnostic ALL cells for gene expression analysis (i.e., had sufficient leukemia cells in their diagnostic bone marrow aspirates to permit RNA isolation from 53106to 13 107 ALL cells). High-quality total RNA was extracted with TriReagent (MRC, Cincinnati, Ohio, United States) from cryopreserved mononuclear cell suspensions from bone marrows at diagnosis. Total RNA was processed and hybridized to the HG-U133A oligonucleotide microarray (Affymetrix, Santa Clara, California, United States). This array contains 22,215 gene probe sets, representing approx-imately 12,357 human genes, plus approxapprox-imately 3,820 expressed sequence tag clones with unknown function [29]. Following removal of probe sets with .95% absent calls, 13,488 probe sets remained. Scaled expression values of all probe sets were logarithmically transformed to stabilize variance.
Determination of MTX Polyglutamylated Metabolites in Bone Marrow ALL Cells 42–44 Hours Post-treatment
Intracellular MTXPGs were extracted from 42- to 44-h post-treatment bone marrow ALL cells kept in a buffered solution (Tris, EDTA, and 2-mercaptoethanol [pH 7.8]) by first boiling (1008C for 10 min), then stored frozen at808C until analysis. The HPLC separation and the radioenzymatic quantitation of MTX and six polyglutamylated metabolites (MTXPG2–7) were performed as previously described [30,31].
These MTXPG measurements were available for 230 patients. All results were expressed as picomoles of MTX or MTXPG per 109cells.
Statistical Analysis and Bioinformatics
MTX responses as measured by WBCDay3, WBCPRE, and
MTXPG values were logarithmically transformed to normal-ize their respective distributions. The Pearson correlation
test was applied in order to determine the association between WBCDay3 and ALL subtype, MTXPG, and WBCPRE.
The difference between WBCPRE and WBCDay3, WBCDDay3
(the WBC residual based on the linear regression of log[WBCPRE] change to log[WBCDay3] ) was determined by
taking the residuals of the linear regression model of WBCDay3versus WBCPRE, which was available for 293 patients.
Specifically, MTX response is defined as:
WBCDDay3¼0:4923logðWBCPREÞ logðWBCDay3Þ þ0:0229
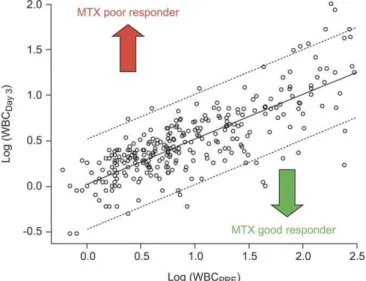
We indicated ‘‘MTX poor response’’ and ‘‘MTX good response’’in Figures 2 and 3 according to the cutoff for good responders (WBCDDay3,0.14) and poor responders (WBCDDay3 .0.14), based on the bottom and top quartile of 293 patients.
Data were available for 161 patients on both WBCDDay3and
gene expression in diagnostic bone marrow leukemia cells (Figure S1). The association between each individual probe
Figure 1.CONSORT Flow Chart Describing Patients Enrolled in Randomized Clinical Trials at St. Jude Children’s Research Hospital, from Which the Current Study Population Was Derived
The flow chart includes study relevant protocol information for the St. Jude Children’s Research Hospital Total Therapy Protocols XIIIA, XIIIB, and XV. Specifically, from the population that received ALL treatment according to one of these three protocols, the current study included only patients who received HDMTX as initial therapy. These protocols included a randomization to determine whether patients received HDMTX or not as initial treatment, the infusion time of HDMTX, and whether MP was given after MTX (LDMTX, low-dose methotrexate). Patients with an insufficient number of ALL cells for gene expression analysis were excluded, as were patients with insufficient data on circulating ALL cells to assess response over 3 d.
set and WBCDDay3 was determined using the Pearson
correlation test. Gene probe sets were rank-ordered by their
p-values. Final gene probe sets were selected based on a false discovery rate (FDR) cutoff of 1.5%.
For each patient, we computed a gene expression profile using the weighted average of the expression signals of top selected genes. The Pearson correlation coefficient between each gene’s expression and WBCDDay3was used as the weight.
This weighted average of expression signals was used as the summary of the top gene expression profile for each patient. Specifically, the gene expression profile was computed
according to the following formula:
Gene Expression Score¼ X
50
j¼1
weightj3gene expressionj
Wherej¼1. . .50 top selected gene probe sets as listed in
Table S3, and weights were determined as the correlation coefficients as listed in the same table.
We compared the top 50 gene profile with the top 100 gene profile; the correlation coefficient was 0.989 (p , 0.001, Pearson correlation test). These tests were performed using standard statistical functions in R software.
We tested 37 GenMAPP pathways and 319 Gene Ontology– biological process (GO–BP) gene groupings for association with WBCDDay3 using the ‘‘globaltest’’ method [32]
imple-mented in the R Bioconductor package [33]. This test was used to infer over-representation of specific biological pathways, and the ‘‘geneplot’’ function was applied to plot the importance of selected genes with default parameters. Multiple testing was adjusted using the Bonferroni method and the FDR according to Storey and Tibshirani [34].
Cell Cycle Distribution
The percentage of ALL cells in S-phase was determined in diagnostic bone marrow aspirates from patients for whom an adequate number of cells were available (n¼154). Propidium iodide–stained DNA content was measured by flow cytometry using the Coulter EPICS V flow cytometer (Coulter Elec-tronics, Hialeah, Florida, United States), and the computer program ModFit (Verity Software House, Verity, Topsham, Maine, United States) was used to calculate the percentages of cells in G0/G1, S, and G2/M phase.
Treatment Outcome Analysis
The duration of disease-free survival (DFS) was defined as the time from diagnosis until the date of leukemia relapse (event), or the last follow-up (censored). Second malignancies and death due to other reasons were censored at the time of
Figure 2.Scatterplot of WBCDay3versus WBCPRE
This plot illustrates the leukemia cell count on day 3 (WBCDay3) after
initial HDMTX treatment versus the pretreatment leukemia cell count (WBCPRE) at diagnosis in 293 patients. The solid line indicates the linear
regression, and the dotted line the 95% confidence interval withp,
0.0001,r¼0.76, Spearman rank correlation, andp,0.0001, r¼0.79, Pearson correlation.
doi:10.1371/journal.pmed.0050083.g002
Figure 3.Hierarchical Clustering of Genes Discriminating MTX Response (WBCDDay3)
Hierarchical clustering using the top 50 most discriminant gene probe sets (Table S3) discriminating MTX response in 161 patients. Each column represents an ALL sample labeled with red circles for MTX poor responders (n¼40, top quartile of WBCDDay3) and with green circles for MTX good
responders (n¼40, bottom quartile of WBCDDay3). Unlabeled patients are intermediate MTX responders. Each row represents a probe set labeled with
occurrence. Treatment outcome was available in 136 patients of the 293 patients treated with HDMTX with WBCPREand
WBCDay3measured. Of note, patients treated on protocol T15
were excluded because of short follow-up. Time was also censored at the last follow-up date if no failure was observed. Single-variable analysis using Cox proportional hazards regression, as modified by Fine and Gray [35] was used to estimate the relative risk of an event. Significant associations from the single variable analyses were further evaluated in a multiple variable analysis, which included risk classification, age, lineage, and ALL subtype in addition to WBCDDay3 and
the top 50 gene expression profile. DFS curves were calculated by reversing the cumulative incidence curve, where MTX poor responders represent the top quartile, intermediate responders the middle two quartiles, and good responders the bottom quartile.
Results
Relation among WBCDay3,WBCPRE, Treatment, ALL
Subtype, and MTX Metabolism
Patient characteristics (race, sex, age, WBCPRE, ALL
subtype) were similar among patients randomly assigned to receive HDMTX4H, HDMTX24H, or HDMTX24HþMP (p. 0.13, Figure S2). Furthermore, there was no difference in WBCDay3 among the three randomized treatment groups
(Table 1). The lack of differences among treatment groups coupled with our previous findings of minimal de novo purine synthesis (DNPS) inhibition and antileukemic effects of a single dose of intravenous MP [36], allowed us to analyze patients treated with HDMTX4H, HDMTX24H, and HDMTX24HþMP as a single group, to enhance the statistical power of our analyses.
WBCDay3was significantly lower than WBCPRE(n¼293,p,
0.0001) and was highly correlated with WBCPRE(p,0.0001,r ¼ 0.79, Figure 2). Therefore, to remove the effect of the pretreatment leukemia burden (WBCPRE) we used the
WBCDDay3 corresponding to the residuals from the linear
regression model of WBCDay3 versus WBCPRE(Figure 2). As
indicated in Figure S3, the histogram of the residuals approximates a normal distribution, in contrast to the skewed distribution of percentage drop in WBC count from diagnosis to day 3 (WBC%drop; p¼ 0.1 versus p , 0.001,
Kolmogorov-Smirnov test). There was a statistically signifi-cant association between WBCDDay3 and polyglutamylated
MTX levels (MTXPG2–7) in ALL cells (n¼230,p¼0.0001,r¼ 0.25, Figure 4), with higher MTXPG2–7 associated with
greater antileukemic effect. There was not a significant relation between WBCDDay3 and ALL subtype (n¼293, p¼
0.07).
Relation among WBCDDay3, Gene Expression, and Pathway
Analysis
Our analyses of antileukemic effects after in vivo MTX treatment and gene expression in pretreatment ALL cells identified the 50 most significant gene probe sets that were associated with antileukemic effect of MTX (WBCDDay3,
Figure 3). The FDR was less than 1.5% for these gene probe sets, and each gene had a Pearson correlation coefficient higher than 0.3 or lower than0.3 and a p-value less than 0.001. Among these genes, the expression patterns for 21 were positively and 29 were negatively related to MTX response. Genes significantly associated with MTX response included those involved in nucleotide metabolism (thymidylate synthetase[TYMS] andCTP synthase[CTPS]), cell proliferation and apoptosis (B-cell CLL/lymphoma 3[BCL3],centromere protein F [CENPF], cell division cycle 20[CDC20], abnormal spindle–like
[ASPM], transforming, acidic coiled-coil containing protein 1
Table 1.Patient Characteristics Were Not Different among the HDMTX Treatment Groups
Category Variable n HDMTX24H HDMTX24HþMP HDMTX4H p-Valuea
Race — — — — — 0.30
Whiteb 205 90 39 76 —
African American 55 19 15 21 —
Other 33 16 6 11 —
Sex — — — — — 0.87
Female 130 56 28 46 —
Male 163 69 32 62 —
Age — — — — — 0.26
,10 y 228 99 42 87 —
.10 y 65 26 18 21 —
WBCPRE — — — — — 0.88
,10/nlb 181 80 35 66 —
10–49/nl 67 24 15 28 —
50–100/nl 21 8 7 6 —
.100/nl 24 13 3 8 —
ALL subtype — — — — — 0.50
B-otherb 103 42 25 36 —
BCR-ABL 6 3 1 2 —
Hyperdiploid 81 38 14 29 —
MLL-AF4 4 0 3 1 —
T-lineage 34 16 6 16 —
TEL-AML1 65 26 11 28 —
a
Chi-square test.
b
Reference group.
[TACC1], and Fas apoptotic inhibitory molecule 3 [FAIM3]), and several genes implicated in DNA replication and repair (DNA polymerase delta, subunit 3[POLD3],replication protein A3[RPA3],
ribonuclease H2, subunit A[RNASEH2A],GINS complex subunit 2
[GINS2],ribonucleotide reductase M1[RRM1],H2A histone family, member X [H2AFX], and flap structure-specific endonuclease 1
[FEN1]).
To gain more insight into the molecular and cellular pathways related to MTX response, the global test analysis was used to determine whether the gene expression profile of different pathways retrieved from the GO–BP or GenMAPP database, were significantly associated with the antileukemic effect of MTX. As listed in Table S1, a significant association was found between WBCDDay3 and various biological
path-ways including those involved in cell cycle regulation, DNA repair and replication, or nucleotide metabolism. To further illustrate the influence of individual genes on the antileuke-mic effects of MTX within the nucleotide biosynthesis pathway, the ‘‘gene plot’’ output was used. As depicted in Figure S4, three (TYMS, DHFR,and CTPS) of the ten genes belonging to the nucleotide biosynthesis pathway were most strongly negatively associated with the MTX antileukemic effect (WBCDDay3).
Cellular Proliferation and MTX In Vivo Response
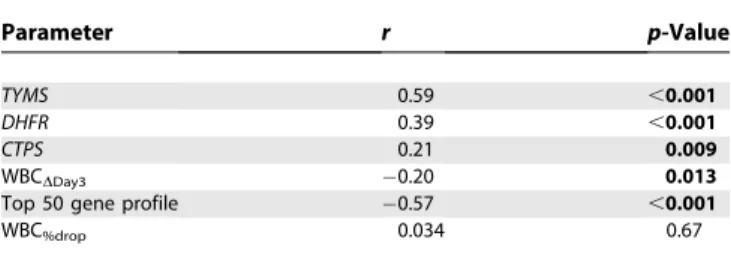
We were able to determine both the percentage of cells in S-phase of the cell cycle and gene expression in 154 patients (these are by ALL subtype: B-lineage hyperdiploid,n¼40; B-lineage other,n¼47;E2A-PBX1,n¼14; T-ALL,n¼21; TEL-AML1,n¼32;BCR-ABL,n¼4;MLL-AF4,n¼2). There were no significant differences in the percentage of cells in S-phase among different ALL subtypes (p¼0.10, Kruskal-Wallis test). The percentage of cells in S-phase of the cell cycle was positively correlated with expression of genes involved in nucleotide biosynthesisTYMS(r¼0.59,p,0.001),DHFR(r¼ 0.39,p,0.001), andCTPS(r¼0.21,p¼0.009) (Figure S5A, Table 2), with expression ofTYMSbeing the best marker of cell proliferation. The percentage of cells in S-phase was significantly correlated with MTX response measured as WBCDDay3, with the higher percentage in S-phase associated
with a better response (WBCDDay3,r¼0.20,p¼0.013; Figure
S5B, Table 2). The association with percentage S-phase was
similar to the top 50 gene expression profile (r¼ 0.57 p, 0.001; Figure S5C, Table 2). In contrast, the percent drop in WBC count was not significantly related to percentage of cells in S-phase (WBC%drop,r¼0.034,p¼0.67; Table 2).
Relation between Disease-Free Survival and Expression of CTPS, TYMS,DHFR,MTX Response (WBC%dropand
WBCDDay3), and Top 50 Gene Expression Profile
The median follow-up of patients for this analysis was 9.1 y from diagnosis, comprising patients enrolled in St. Jude Total Therapy XIII protocol (n¼136). WBCDDay3, and TYMSand
DHFR expression, were related to DFS according to Cox proportional hazards regression analyses that compared patients who remained in continuous complete remission with those who relapsed during the follow-up period. The univariable analysis of variables potentially related to DFS revealed significance for expression of TYMS (hazard ratio [HR]¼0.6;p¼0.008), expression of DHFR (HR¼0.41; p¼ 0.015); MTX response (WBCDDay3, HR¼21.5;p,0.001), and
the top 50 gene expression profile (HR¼1.09;p¼0.02; Table 3), but not for the expression ofCTPSor the WBC%drop.
Patients with the best MTX response (i.e., bottom quartile of the residual WBCDDay3) had significantly better 5-y DFS
compared to patients with the worst response (top quartile) (DFS6SE 96.9%63.1% versus 81.4%67%,p¼0.033 for quartiles compared; Figure 5A). Likewise, patients with a gene expression profile indicative of a good MTX response (bottom quartile of the gene expression profile) had significantly better 5-y DFS compared to patients with a gene expression profile indicative of poor MTX response (top quartile of the gene expression profile) (5-y DFS6variance: 87.5% 6 6.9% versus 72% 6 9.2%, p¼0.019 for quartiles compared; Figure 5B). Patients with higher TYMS orDHFR
expression (i.e., top quartile of the expression level) had significantly better 5-y DFS compared to patients with lower
TYMS or DHFR expression (i.e., bottom quartile of the expression level) (5-y DFS6variance: 87.9%65.8% versus 72.7%67.9%,p¼0.024 forTYMSand 93.5%64.5% versus 69% 6 8.1%, p¼0.041 for DHFR for quartiles compared; Figure 5C).
Furthermore, multivariable Cox regression analysis (Tables 3 and S2) that also included the conventional National Cancer Institute ALL risk criteria (i.e., ALL subtype, age, and WBC at diagnosis) revealed significance for MTX response (WBCDDay3, HR¼22.6; p¼ 0.0046), and the expression of
TYMS(HR¼0.58;p¼0.044) andDHFR(HR¼0.31;p¼0.019). The top 50 gene expression profile did not reach statistical significance in predicting relapse in the overall population when other known risk factors were included, although the trend remained evident (p¼0.08, Tables 3 and S2).
Discrimination of MTX Response Using the Top 50 Gene Expression Profile and Assessment in an Independent Validation Cohort
In an independent test set of 18 additional patients who received initial HDMTX according to the St. Jude Total Therapy XV protocol, we performed gene expression analysis at diagnosis and determined WBC (ALL cell) count at diagnosis and on day 3. The gene expression profile of the top 50 genes was significantly related to the residual WBCDDay3 in this patient cohort (top 50 gene profile, p¼
0.0065, r ¼ 0.62, Pearson correlation; Figure 6A), thus
Figure 4.Scatterplot of WBCDDay3Versus Level of Total MTXPGs
There is a significant correlation of WBCDDay3with the total MTXPG level
in ALL cells from 230 patients (i.e., a higher total MTXPG concentration is associated with a better in vivo MTX response) (p¼0.0001,r¼ 0.25, Pearson correlation).
validating the gene expression profile as predictive of the MTX response in an independent cohort of patients.
Additionally, we predicted the WBCDay3after initial MTX
treatment based on the known WBCPRE in these 18 newly
enrolled patients. For that, we used either the WBCDDay3
linear regression function or the median WBC%drop
devel-oped in the original test cohort of 293 patients. The sum of the differences between the observed and the predicted WBCDay3 squared was 1.042 using the WBCDDay3 linear
regression model and 3.35 using the median WBC%drop. The
observed WBCDay3 values are significantly closer to the
predicted values using WBCDDay3 (Figure 6B) than those
based on WBC%drop (Figure 6C; p¼ 0.0025, paired t-test),
thereby further indicating that WBCDDay3is a more accurate
measure of in vivo MTX response than WBC%drop.
Discussion
The current studies have identified genes that are ex-pressed at a significantly different level in acute lympho-blastic leukemia cells of patients who exhibit a poor in vivo response to HDMTX. High-throughput genomic approaches to assess the expression levels of RNA transcripts in cancer cells are providing new insights into pathogenesis, classifica-tion, diagnosis, stratificaclassifica-tion, and prognosis of many human cancers [23,37–39]. The drug resistance and gene expression profiles of leukemia cells have also been used to identify genes related to the sensitivity of ALL cells to several antileukemic agents and to forecast differences in treatment response [5,20,21]. These findings have also revealed novel targets for the discovery of new agents to reverse drug resistance, such as our prior discovery of MCL1 over-expression in glucocorticoid-resistant ALL [5], and the
subsequent discovery that rapamycin can down-regulate
MCL1 expression and increase sensitivity of leukemia cells to dexamethasone [37,40]. However, prior to the current study, there has not been a comprehensive analysis of genes related to the antileukemic effects of MTX in primary leukemia cells.
We therefore evaluated MTX response in vivo after initial therapy, because this is the only possible time to assess the antileukemic effects of MTX as a single agent in patients and because there are no reliable in vitro methods. Thus, our study focused on treatment-naive ALL, and assessed de novo resistance. This revealed that WBCDDay3is a superior measure
of in vivo MTX response when compared to the percentage drop in leukemia cells (i.e., WBC%drop), and that WBCDDay3
was predictive of long-term DFS. Furthermore, the difference in survival cannot simply be explained by differences in MTX systemic exposure (Figure S6).
To better understand the biological basis underlying MTX response in ALL cells, we used an unbiased genome-wide approach to identify genes whose expression in primary leukemia cells in vivo was significantly related to WBCDDay3.
This process revealed 48 genes and two cDNA clones that are highly related to the in vivo MTX response (WBCDDay3), even
after adjusting for MTXPG accumulation (n¼230) (Table S3). Among those genes significantly associated with MTX response were genes involved in nucleotide metabolism (TYMS and CTPS), cell proliferation and apoptosis (BCL3, CDC20, CENPF,and FAIM3), and DNA replication or repair (POLD3, RPA3, RNASEH2A, RPM1, and H2AFX). The anti-leukemic effects of MTX involve inhibition of purine and pyrimidine synthesis, and the current findings indicate that interindividual differences in nucleotide synthesis influence the in vivo antileukemic effects of MTX. This finding was confirmed by a global test analysis that identified the nucleotide biosynthesis pathway as one of the most discrim-inating biological pathways related to MTX response. Significance of the global test was largely explained by three key genes (TYMS, DHFR, and CTPS) belonging to the nucleotide biosynthesis pathway.
Our analysis also showed that low expression of DHFR, TYMS, and CTPS was significantly correlated with poor in vivo MTX response [6,41,42]. It has been shown thatDHFR, TYMS, and CTPS expression is associated with critical biological processes such as DNA synthesis and cell prolifer-ation [43,44], a finding consistent with low expression of these genes reflecting a decrease in the number of ALL cells in S-phase. As MTX selectively affects cells in the S-phase of the
Table 2.Pearson Correlation of Selected Biological and Response Parameters with Percentage of Cells in S-Phase
Parameter r p-Value
TYMS 0.59 ,0.001
DHFR 0.39 ,0.001
CTPS 0.21 0.009
WBCDDay3 0.20 0.013
Top 50 gene profile 0.57 ,0.001
WBC%drop 0.034 0.67
doi:10.1371/journal.pmed.0050083.t002
Table 3.Univariable Hazard Analysis of the Risk of Relapse with Variables Related to Initial In Vivo MTX Response and Multivariable Cox Proportional Hazard Analyses Each Including Known Prognostic Factors (i.e., ALL Subtype, Age at Diagnosis, Risk Group)
Parameter Univariable Hazard Analysis Multivariable Cox Proportional Hazard Analyses Hazard Ratio p-Value Hazard Ratio p-Value
WBCDDay3 21.5 ,0.001 22.6 0.0046
TYMS 0.60 0.008 0.58 0.044
DHFR 0.41 0.015 0.31 0.019
Top 50 gene profile 1.09 0.02 1.05 0.08
cell cycle [7,44,45], it is likely that low expression of these genes explains the observed association with MTX response. To support this hypothesis, we showed that the percentage of leukemia cells in the S-phase was strongly correlated with
DHFR,TYMS, andCTPSexpression and with the MTX in vivo
response (Figure S5, Table 2). This finding does not preclude the possibility that genetically determined high TYMS
expression in ALL cells is associated with a worse prognosis in ALL, as we have previously reported [46]. High TYMS
expression in the current study was related to higher cell proliferation, whereas higher constitutiveTYMSexpression is due to a genetic polymorphism in theTYMSpromoter region. After remission is achieved, higherTYMS expression due to the promoter polymorphism would connote a worse prog-nosis due to higher levels of the MTX target, thymidylate synthase, independent of cellular proliferation rates.
Our current data showed that low cell proliferation levels, in addition to our measure of in vivo MTX response, is an important ALL cell characteristic related to worse outcome. This result is in agreement with those of a previous study that found treatment-naı¨ve blasts with a low proliferation rate are more resistant to several anticancer drugs in vitro [47]. In the current study, the gene expression profile predicting MTX response was not associated with overall disease outcome after adjusting for other known prognostic variables in the entire study population (p ¼ 0.08), but was significantly related to DFS within high-risk patients (p¼0.014). Leukemia cells of patients with high-risk ALL may intrinsically have a higher potential for poor MTX response (e.g., because of oncogenic gene fusions), in contrast to lower-risk patients whose ALL cells may acquire resistance mechanisms during the 2–3 y of therapy. Further, it is possible that patients with high-risk leukemia may be more prone to acquire resistance during therapy for various reasons (e.g., greater genetic instability in their ALL cells).
Interestingly, other known folate metabolism genes were not among the top genes, suggesting that expression of the known folate metabolism genes in pretreatment ALL cells is less important in causing de novo MTX resistance than previously thought. It may well be that these folate pathway genes are important for the acquired drug resistance that emerges during MTX treatment. It is also plausible that expression or function of these proteins is not reflected by the level of their mRNA expression in ALL cells. These possibilities merit further investigation, which is beyond the scope of the current work.
Defining the genomic determinants of ALL resistance to individual antileukemic agents is essential if the pharmaco-genomics of drug resistance are to be elucidated, because the current and prior studies have shown that genes discriminat-ing drug resistance in ALL are drug specific [5,48]. To assess whether the genes we identified as related to de novo MTX resistance reflect a global resistance phenotype versus a MTX-specific effect, we compared the previously reported gene expression profiles for ALL resistance to PVAD (prednisone, vincristine, asparaginase, and daunorubicin), with the top 50 genes discriminating MTX response in the current study. This comparison revealed no overlap in the genes related to MTX resistance and the 124 genes related to prednisone, vincris-tine, asparaginase or daunorubicin PVAD resistance [5]. This result indicates that genes identified in the current study are not a marker of general drug resistance or a global predictor of survival, rather they are specific to MTX (or perhaps other antifolates, but not all ALL chemotherapy). Furthermore, we applied our MTX gene expression profile to the publicly available German/Dutch dataset [5], and documented that the MTX gene expression profile is not related to prednisolone
Figure 5. Kaplan-Meier Plots of Disease Relapse Categorized by WBCDDay3,TYMS, and Top 50 Gene Profile
(A) MTX response is categorized by WBCDDay3MTX good responders (i.e.,
bottom quartile, n¼ 28), intermediate (n¼ 67), and poor (i.e., top quartile,n¼41) among 293 patients.
(B) Top 50 gene expression profile is categorized by top 25% (gene profile for good responder,n¼20), intermediate (n¼53), and bottom 25% (gene profile for poor responder,n¼19).
(C) Proliferation index is categorized byTYMSexpression top 25% (high proliferation index,n¼27), intermediate (n¼47) and bottom 25% (low proliferation index, n ¼ 18). For TYMS and top 50 gene profile, categorization was done among the 161 patients who had ALL cell gene expression data available.
sensitivity in this independent patient cohort (unpublished data).
Among the 50 genes that were expressed at a significantly different level in leukemia cells of MTX good responders versus poor responders, 29 were overexpressed in the MTX poor- responders. It is plausible that these overexpressed genes would be candidate targets for small molecules or other strategies to down-regulate their function, as a means to modify MTX response. Such a strategy has already proven successful in finding agents to modify the sensitivity of ALL cells to steroids [40], and it is plausible that specific inhibitors of genes overexpressed in leukemia cells resistant to MTX could be viable targets for modulating the antileukemic effects of MTX. Likewise, strategies to invoke the expression of genes that are underexpressed in MTX poor responders could be tested for their ability to modulate MTX sensitivity. The current study is the first, to our knowledge, to identify genes whose expression is related to in vivo MTX response in patients with newly diagnosed ALL. Our data provide new insights into the genomic basis of interpatient differences in MTX response and point to new strategies for overcoming de novo MTX resistance in childhood ALL. In addition, our data indicate that early treatment response to MTX is a significant prognostic indicator for long term DFS in children with ALL.
Supporting Information
Figure S1. Flow Diagram of Data and Methods Used
Gray boxes indicate data used for the analyses, white boxes intermediate data, shaded boxes data analysis method used, andn
the number of patients.
Found at doi:10.1371/journal.pmed.0050083.sg001 (657 KB PDF).
Figure S2. Box Plot of WBCDay3 Versus MTX Treatment Group The three initial treatment groups with HDMTX were not different in their WBCDay3 (HDMTX24H,n¼125; HDMTX24HþMP,n¼60; HDMTX4H,n¼108, Welch two-samplet-test).
Found at doi:10.1371/journal.pmed.0050083.sg002 (16 KB PDF).
Figure S3. Histogram of WBC Change and WBC Residuals Shown are the distributions of 293 patients for (A) WBCLogChangethat is defined as log(WBCPRE) minus log(WBCDay3), p¼ 0.04, i.e., is significantly different from a normal distribution; and (B) WBCDDay3 that is the residuals of the (log[WBCDay3] with log[WBCPRE]) linear regression,p¼0.10, i.e., is not significantly different from a normal distribution.
Found at doi:10.1371/journal.pmed.0050083.sg003 (653 KB PDF).
Figure S4. Gene Plot of the Gene Ontology Nucleotide Biosynthesis Pathway
The gene plot gives a bar and a reference line for each gene probe set categorized for this pathway. The bar indicates the influence of each probe set on the correlation with MTX response (WBCDDay3). If the height of the bar exceeds the reference line the probe set is significantly related to MTX response. Marks indicate the standard deviations by which the bar exceeds the reference line. Red indicates gene probe sets with a positive correlation and green indicates gene probe sets with a negative correlation with MTX response.
Found at doi:10.1371/journal.pmed.0050083.sg004 (340 KB PDF).
Figure S5. Scatterplot of TYMSandDHFRExpression, WBC%drop, WBCDDay3, and Top 50 Gene Profile Versus Percentage of Leukemia Cells in S-Phase
Shown are the scatterplots for 154 patients correlating percentage of leukemia cells in S-phase with (A) the expression ofTYMSandDHFR
(respectively, r ¼ 0.59; p , 0.001; r ¼ 0.39, p , 0.001, Pearson correlation); and (B) for WBC%dropand the residual WBCDDay3of the WBC change (respectively,r¼0.034, p¼0.67;r¼ 0.20,p¼0.013, Pearson correlation); and (C) the top 50 gene expression profile (r¼
0.57,p,0.001, Pearson correlation).
Found at doi:10.1371/journal.pmed.0050083.sg005 (163 KB PDF).
Figure S6. MTX Systemic Exposure Was Not Different among Responder Groups
There was no difference (p¼0.82) in MTXAUC(methotrexate area under the curve, representing MTX systemic exposure) in the groups (MTX good responder [GR] versus MTX intermediate [IR] versus MTX poor responder [PR]). We used the same cutoff for MTX response (WBCDDay3) as in Figure 3. Therefore, the difference in survival cannot be explained by the difference in MTXAUC. Found at doi:10.1371/journal.pmed.0050083.sg006 (59 KB PDF).
Table S1. The Top Ten GenMAPP (of 37) (A) and GO–BP (of 319) (B) Pathways Associated with WBCDDay3
The column titled‘‘probe-set correlations with WBCDDay3’’indicates whether most probe sets in the pathway have a positive correlation, a negative correlation or a mixture of positive and negative correla-tions with WBCDDay3.
Found at doi:10.1371/journal.pmed.0050083.st001 (56 KB DOC).
Table S2. Multivariable Cox Proportional Hazard Analysis of the Risk of Relapse
Individual factors related to MTX response are highlighted in gray (i.e., WBCDDay3, TYMS, DHFR, top 50 gene profile), each including known prognostic factors (i.e., ALL subtype, age at diagnosis, risk group).
Found at doi:10.1371/journal.pmed.0050083.st002 (57 KB DOC).
Table S3. The Top 50 Probe Sets Associated with WBCDDay3 Found at doi:10.1371/journal.pmed.0050083.st003 (105 KB DOC).
Text S1. CONSORT Checklist
Found at doi:10.1371/journal.pmed.0050083.sd001 (64 KB DOC).
Figure 6.Model Performance in an Independent Test Set of Patients
Relation between the in vivo MTX response (WBCDDay3) and top 50 gene expression profile (p¼0.0065, r¼0.62, Pearson correlation) for the
independent validation cohort (n¼18). Relation between (B) the predicted log(WBCDay3) using either the linear model function or (C) the median
percentage drop determined in 293 patients (mean difference¼0.1812946.p¼0.0025, pairedt-test). The regression lines in graphs (B) and (C) are based on intercept equal to zero and slope equal to one.
Accession Numbers
MIAME-compliant primary microarray data are available through the Gene Expression Omnibus (NCBI) at http://www.ncbi.nlm.nih.gov/geo/ under GSE10255 and GSM258912–GSM259072.
Acknowledgments
We thank the patients and their parents for their participation in this study; our clinical staff for facilitating protocol-based patient care; and our research nurses, Sheri Ring, Lisa Walters, Terri Kuehner, Margaret Edwards, Vickey Simmons, and Paula Condy. We also thank Yaqin Chu, May Chung, Emily Melton, and Siamac Salehy for outstanding technical assistance; and Nancy Kornegay and Mark Wilkinson for computer and database expertise.
Author contributions. MJS, C-HP, MHC, and WEE designed the experiments and the study. MJS, DP, WY, GS, CC, JCP, MVR, WEE, and MHC analyzed the data. C-HP enrolled and treated patients. NP wrote the first draft of the paper. MJS, WY, LK, GS, CC, C-HP, MVR, MHC, and WEE contributed to writing the paper. MHC collected gene expression and patient data for this study.
Abbreviations.ABC, ATP-binding cassette; ALL, childhood acute lymphoblastic leukemia; DFS, disease-free survival; FDR, false discovery rate; GO–BP, Gene Ontology–biological process; HDMTX, high-dose methotrexate; HR, hazard ratio; MTX, methotrexate; MTXPG, methotrexate polyglutamate; WBC%drop, percent WBC change; WBC, white blood cell count; WBCDDay3, MTX response as defined by the WBC residual based on the linear regression of log(WBCPRE) change to log(WBCDay3); WBCDay3, peripheral WBC count on day 3 following start of HDMTX treatment; WBCPRE, peripheral WBC count pretreatment
References
1. Pui CH, Evans WE (2006) Treatment of acute lymphoblastic leukemia. N Engl J Med 354: 166–178.
2. Pui CH, Relling MV, Downing JR (2004) Acute lymphoblastic leukemia. N Engl J Med 350: 1535–1548.
3. Evans WE, Relling MV (2004) Moving towards individualized medicine with pharmacogenomics. Nature 429: 464–468.
4. Cheok MH, Evans WE (2006) Acute lymphoblastic leukaemia: a model for the pharmacogenomics of cancer therapy. Nat Rev Cancer 6: 117–129. 5. Holleman A, Cheok MH, den Boer ML, Yang W, Veerman AJ, et al. (2004)
Gene-expression patterns in drug-resistant acute lymphoblastic leukemia cells and response to treatment. N Engl J Med 351: 533–542.
6. Gorlick R, Goker E, Trippett T, Waltham M, Banerjee D, et al. (1996) Intrinsic and acquired resistance to methotrexate in acute leukemia. N Engl J Med 335: 1041–1048.
7. Longo-Sorbello GS, Bertino JR (2001) Current understanding of metho-trexate pharmacology and efficacy in acute leukemias. Use of newer antifolates in clinical trials. Haematologica 86: 121–127.
8. Matherly LH, Goldman DI (2003) Membrane transport of folates. Vitam Horm 66: 403–456.
9. Chen ZS, Lee K, Walther S, Raftogianis RB, Kuwano M, et al. (2002) Analysis of methotrexate and folate transport by multidrug resistance protein 4 (ABCC4): MRP4 is a component of the methotrexate efflux system. Cancer Res 62: 3144–3150.
10. Hooijberg JH, Broxterman HJ, Kool M, Assaraf YG, Peters GJ, et al. (1999) Antifolate resistance mediated by the multidrug resistance proteins MRP1 and MRP2. Cancer Res 59: 2532–2535.
11. Zeng H, Chen ZS, Belinsky MG, Rea PA, Kruh GD (2001) Transport of methotrexate (MTX) and folates by multidrug resistance protein (MRP) 3 and MRP1: effect of polyglutamylation on MTX transport. Cancer Res 61: 7225–7232.
12. Uga H, Kuramori C, Ohta A, Tsuboi Y, Tanaka H, et al. (2006) A new mechanism of methotrexate action revealed by target screening with affinity beads. Mol Pharmacol 70: 1832–1839.
13. McGuire JJ, Hsieh P, Coward JK, Bertino JR (1980) Enzymatic synthesis of folylpolyglutamates. Characterization of the reaction and its products. J Biol Chem 255: 5776–5788.
14. Banerjee D, Mayer-Kuckuk P, Capiaux G, Budak-Alpdogan T, Gorlick R, et al. (2002) Novel aspects of resistance to drugs targeted to dihydrofolate reductase and thymidylate synthase. Biochim Biophys Acta 1587: 164– 173.
15. Chabner BA, Allegra CJ, Curt GA, Clendeninn NJ, Baram J, et al. (1985) Polyglutamation of methotrexate. Is methotrexate a prodrug? J Clin Invest 76: 907–912.
16. Kager L, Cheok M, Yang W, Zaza G, Cheng Q, et al. (2005) Folate pathway gene expression differs in subtypes of acute lymphoblastic leukemia and influences methotrexate pharmacodynamics. J Clin Invest 115: 110–117.
17. Barredo JC, Synold TW, Laver J, Relling MV, Pui CH, et al. (1994) Differences in constitutive and post-methotrexate folylpolyglutamate
synthetase activity in B-lineage and T-lineage leukemia. Blood 84: 564– 569.
18. Masson E, Relling MV, Synold TW, Liu Q, Schuetz JD, et al. (1996) Accumulation of methotrexate polyglutamates in lymphoblasts is a determinant of antileukemic effects in vivo. A rationale for high-dose methotrexate. J Clin Invest 97: 73–80.
19. Whitehead VM, Rosenblatt DS, Vuchich MJ, Shuster JJ, Witte A, et al. (1990) Accumulation of methotrexate and methotrexate polyglutamates in lymphoblasts at diagnosis of childhood acute lymphoblastic leukemia: a pilot prognostic factor analysis. Blood 76: 44–49.
20. Cario G, Stanulla M, Fine BM, Teuffel O, Neuhoff NV, et al. (2005) Distinct gene expression profiles determine molecular treatment response in childhood acute lymphoblastic leukemia. Blood 105: 821–826.
21. Lugthart S, Cheok MH, den Boer ML, Yang W, Holleman A, et al. (2005) Identification of genes associated with chemotherapy crossresistance and treatment response in childhood acute lymphoblastic leukemia. Cancer Cell 7: 375–386.
22. Rots MG, Pieters R, Kaspers GJ, van Zantwijk CH, Noordhuis P, et al. (1999) Differential methotrexate resistance in childhood T- versus common/preB-acute lymphoblastic leukemia can be measured by an in situ thymidylate synthase inhibition assay, but not by the MTT assay. Blood 93: 1067–1074.
23. Yeoh EJ, Ross ME, Shurtleff SA, Williams WK, Patel D, et al. (2002) Classification, subtype discovery, and prediction of outcome in pediatric acute lymphoblastic leukemia by gene expression profiling. Cancer Cell 1: 133–143.
24. Pui CH, Crist WM, Look AT (1990) Biology and clinical significance of cytogenetic abnormalities in childhood acute lymphoblastic leukemia. Blood 76: 1449–1463.
25. Pui CH, Boyett JM, Rivera GK, Hancock ML, Sandlund JT, et al. (2000) Long-term results of Total Therapy studies 11, 12 and 13A for childhood acute lymphoblastic leukemia at St Jude Children’s Research Hospital. Leukemia 14: 2286–2294.
26. Pui CH, Cheng C, Leung W, Rai SN, Rivera GK, et al. (2003) Extended follow-up of long-term survivors of childhood acute lymphoblastic leukemia. N Engl J Med 349: 640–649.
27. Pui CH, Sandlund JT, Pei D, Rivera GK, Howard SC, et al. (2003) Results of therapy for acute lymphoblastic leukemia in black and white children. JAMA 290: 2001–2007.
28. Pui CH, Relling MV, Sandlund JT, Downing JR, Campana D, et al. (2004) Rationale and design of Total Therapy Study XV for newly diagnosed childhood acute lymphoblastic leukemia. Ann Hematol 83: S124–S126. 29. Lipshutz RJ, Fodor SP, Gingeras TR, Lockhart DJ (1999) High density
synthetic oligonucleotide arrays. Nat Genet 21: 20–24.
30. Panetta JC, Wall A, Pui CH, Relling MV, Evans WE (2002) Methotrexate intracellular disposition in acute lymphoblastic leukemia: a mathematical model of gamma-glutamyl hydrolase activity. Clin Cancer Res 8: 2423– 2429.
31. Synold TW, Relling MV, Boyett JM, Rivera GK, Sandlund JT, et al. (1994) Blast cell methotrexate-polyglutamate accumulation in vivo differs by lineage, ploidy, and methotrexate dose in acute lymphoblastic leukemia. J Clin Invest 94: 1996–2001.
32. Goeman JJ, van de Geer SA, de Kort F, van Houwelingen HC (2004) A global test for groups of genes: testing association with a clinical outcome. Bioinformatics 20: 93–99.
33. Gentleman RC, Carey VJ, Bates DM, Bolstad B, Dettling M, et al. (2004) Bioconductor: open software development for computational biology and bioinformatics. Genome Biol 5: R80.
34. Storey JD, Tibshirani R (2003) Statistical significance for genomewide studies. Proc Natl Acad Sci U S A 100: 9440–9445.
35. Fine JP, Gray RJ (1999) A proportional hazards model for the subdis-tribution of a competing risk. J Am Stat Assoc 94: 496–509.
36. Dervieux T, Brenner TL, Hon YY, Zhou Y, Hancock ML, et al. (2002) De novo purine synthesis inhibition and antileukemic effects of mercapto-purine alone or in combination with methotrexate in vivo. Blood 100: 1240–1247.
37. Golub TR, Slonim DK, Tamayo P, Huard C, Gaasenbeek M, et al. (1999) Molecular classification of cancer: class discovery and class prediction by gene expression monitoring. Science 286: 531–537.
38. Ramaswamy S, Tamayo P, Rifkin R, Mukherjee S, Yeang CH, et al. (2001) Multiclass cancer diagnosis using tumor gene expression signatures. Proc Natl Acad Sci U S A 98: 15149–15154.
39. DeRisi J, Penland L, Brown PO, Bittner ML, Meltzer PS, et al. (1996) Use of a cDNA microarray to analyse gene expression patterns in human cancer. Nat Genet 14: 457–460.
40. Wei G, Twomey D, Lamb J, Schlis K, Agarwal J, et al. (2006) Gene expression-based chemical genomics identifies rapamycin as a modulator of MCL1 and glucocorticoid resistance. Cancer Cell 10: 331–342. 41. Flotho C, Coustan-Smith E, Pei D, Cheng C, Song G, et al. (2007) A set of
genes that regulate cell proliferation predict treatment outcome in childhood acute lymphoblastic leukemia. Blood
43. Hatse S, de Clercq E, Balzarini J (1999) Role of antimetabolites of purine and pyrimidine nucleotide metabolism in tumor cell differentiation. Biochem Pharmacol 58: 539–555.
44. Kohn KW (1996) Regulatory genes and drug sensitivity. J Natl Cancer Inst 88: 1255–1256.
45. Fernandes DJ, Sur P, Kute TE, Capizzi RL (1988) Proliferation-dependent cytotoxicity of methotrexate in murine L5178Y leukemia. Cancer Res 48: 5638–5644.
46. Rocha JC, Cheng C, Liu W, Kishi S, Das S, et al. (2005) Pharmacogenetics of outcome in children with acute lymphoblastic leukemia. Blood 105: 4752–4758. 47. Kaaijk P, Kaspers GJ, Van Wering ER, Broekema GJ, Loonen AH, et al. (2003) Cell proliferation is related to in vitro drug resistance in childhood acute leukaemia. Br J Cancer 88: 775–781.
48. Cheok MH, Yang W, Pui CH, Downing JR, Cheng C, et al. (2003) Treatment-specific changes in gene expression discriminate in vivo drug response in human leukemia cells. Nat Genet 34: 85–90.
Editors’ Summary
Background.Every year about 10,000 children develop cancer in the US. Acute lymphoblastic leukemia (ALL), a rapidly progressing blood cancer, accounts for a quarter of these childhood cancers. Normally, cells in the bone marrow (the spongy material inside bones) develop into lymphocytes (white blood cells that fight infections), red blood cells (which carry oxygen round the body), platelets (which prevent excessive bleeding), and granulocytes (another type of white blood cell). However, in ALL, genetic changes in immature lymphocytes (lymphoblasts) mean that these cells divide uncontrollably and fail to mature. Eventually, the bone marrow fills up with these abnormal cells and can no longer make healthy blood cells. As a result, children with ALL cannot fight infections. They also bruise and bleed easily and, because they do not have enough red blood cells, they often complain of tiredness and weakness. With modern chemotherapy protocols (combinations of drugs that kill the fast-dividing cancer cells but leave the normal, nondividing cells in the body largely unscathed), more than 80% of children with ALL live for at least 5 years.
Why Was This Study Done?Although this survival rate is good, some patients still die because their cancer cells are resistant to one or more chemotherapy drugs. For some drugs, the genetic characteristics of the ALL cells that make them resistant are known. Unfortunately, little is known about why some ALL cells are resistant to methotrexate, a component of most treatment protocols for newly diagnosed ALL. Methotrexate kills dividing cells by interfering with DNA synthesis and repair. Cancer cells can be resistant to methotrexate for many reasons— they may have acquired genetic changes that stop the drug from entering them, for example. These resistance mechanisms need to be understood better before new strategies can be developed for the treatment of methotrexate-resistant ALL. In this study, the researchers have determined the response of newly diagnosed patients to methotrexate and have investigated the gene expression patterns in ALL cells that correlate with good and bad responses to methotrexate.
What Did the Researchers Do and Find?The researchers measured the reduction in circulating leukemia cells that followed the first treatment with methotrexate of nearly 300 patients with newly diagnosed ALL. They also used‘‘microarray’’analysis to investigate the gene expression patterns in lymphoblast samples taken from the bone marrow of 161 patients before treatment. They found that the expression of 50 genes was significantly related to the reduction in circulating leukemia cells after methotrexate treatment (a result confirmed in an independent
group of patients). Of these genes, the expression of 29 was higher in patients who responded poorly to methotrexate than in patients who responded well. A ‘‘global analysis test,’’ which examined the gene expression profile of different cellular pathways in relation to the methotrexate response, found a significant association between the nucleotide biosynthesis pathway (which is needed for DNA synthesis and cellular proliferation) and the methotrexate response. Finally, patients with the best methotrexate response and the 50-gene expression profile indicative of a good response were more likely to be alive after 5 years than patients with the worst methotrexate response and the poor-response gene expression profile.
What Do These Findings Mean?These findings provide important new insights into the genetic basis of methotrexate resistance in newly diagnosed childhood ALL and begin to explain why some patients fail to respond to this drug. They also show that the reduction in circulating leukemic cells shortly after the first methotrexate dose and a specific gene expression profile both predict the long-term survival of patients. These findings also suggest new ways to modulate sensitivity to methotrexate. Down-regulation of the expression of the genes that are expressed more highly in poor responders than in good responders might improve patient responses to methotrexate. Alternatively, it might be possible to find ways to increase the expression of the genes that are underexpressed in methotrexate poor responders and so improve the outlook for at least some of the children with ALL who fail to respond to current chemotherapy protocols.
Additional Information.Please access these Web sites via the online version of this summary at http://dx.doi.org/10.1371/journal.pmed. 0050083.
The US National Cancer Institute provides a fact sheet for patients and caregivers about ALL in children and information about its treatment(in English and Spanish)
The UK charity Cancerbackup provides information for patients and caregivers on ALL in children and on methotrexate
The US Leukemia and Lymphoma Society also provides information for patients and caregivers about ALL
The Children’s Cancer and Leukaemia Group (a UK charity) provides information for children with cancer and their families