Advances in Mechanical Engineering 2015, Vol. 7(10) 1–11
ÓThe Author(s) 2015 DOI: 10.1177/1687814015610492 aime.sagepub.com
Customer requirement modeling and
mapping of numerical control machine
Zhongqi Sheng, Yazi Wang, Junyou Song and Hualong Xie
Abstract
In order to better obtain information about customer requirement and develop products meeting customer require-ment, it is necessary to systematically analyze and handle the customer requirement. This article uses the product ser-vice system of numerical control machine as research objective and studies the customer requirement modeling and mapping oriented toward configuration design. It introduces the conception of requirement unit, expounds the cus-tomer requirement decomposition rules, and establishes cuscus-tomer requirement model; it builds the house of quality using quality function deployment and confirms the weight of technical feature of product and service; it explores the relevance rules between data using rough set theory, establishes rule database, and solves the target value of technical feature of product. Using economical turning center series numerical control machine as an example, it verifies the rationality of proposed customer requirement model.
Keywords
Numerical control machine, customer requirement, requirement unit, requirement modeling, requirement mapping
Date received: 14 May 2015; accepted: 8 September 2015
Academic Editor: Tian Han
Introduction
With the globalization of world economy development, manufacturing industry is facing huge challenges. Only the supply of products cannot adapt to the increasingly fierce market competition now, so the manufacturing enterprises have been forced to put its focus on provid-ing overall solution of ‘‘product + service’’ instead of product development, and the product service system is the new-type manufacturing paradigm that rightly adapts to this strategic transition. As the key stage of development of product service system, configuration design is to configure the integrated solution of product service system that meets the customer requirement (CR), and the key point is to accurately understand the CR and develop products satisfying the customers.
CR refers to the requirement description of the cus-tomers about the product and service based on the function, performance, price, and others of product and service. When acquiring the CR, the customer does
not know the function of product or service completely, and customers have different preferences. Therefore, the requirements about product and service are unclear, and it is needed to use scientific analytical methods to figure out the CR. In the meantime, this process is the premise and basis of configuration.
This article studies the CR modeling and mapping of numerical control machine. It introduces the concep-tion of requirement unit (RU), discomposes the CR layer by layer, discomposes the unclear CR into specific RU, and finally establishes the parse tree model of RU, which can clearly describe the hierarchy and relevance
College of Mechanical Engineering & Automation, Northeastern University, Shenyang, P.R. China
Corresponding author:
Zhongqi Sheng, College of Mechanical Engineering & Automation, Northeastern University, Shenyang 110819, P.R. China.
Email: [email protected]
between each RU. It also maps the CR using quality function deployment (QFD) to obtain the requirement weight in the configuration design of product and ser-vice. This article excavates rules of solution data in database using rough set theory so as to obtain the tar-get value of the corresponding design requiremen and realize requirement mapping.
Literature review
Requirement modeling
Before the CR modeling, the CR should be analyzed first and then according to analysis results, the appro-priate methods are used to build CR model. Junwu et al.1put forward that CR can be derived from the prod-uct design. Shan and Chen2 analyzed CR by the gray system theory and obtained the design structure matrix. Violante and Vezzetti3 developed the integrated prod-uct life cycle management (PLM) requirement manage-ment tool based on the user strategy and by the Kano method to manage the CR. Hauksdo´ttir et al.4 pro-posed reusable CR rules. Li et al.5proposed the theory of CR rating and determined the ultimate priority by the minimum deviation method. Wang and Tseng6,7led the requirement of customers which used the probabil-ity analysis, including potential CR and subjective pre-ference requirement. They used a probabilistic approach to elicit customers’ latent and subjective pre-ferences requirement and incorporated them into prod-uct design. Cao et al.8put forward that the preference of CR is different and the customer preference model is constructed to analyze CR. Li et al.9used three types of least squares modeling to obtain CR satisfaction and diverse customer preference requirement. Liu et al.10 proposed a scenario-based systematic approach for requirements management in engineering design. Violante et al.11incorporated user-centered design prin-ciples into the customization process of requirement management tool.
Requirement mapping
After the customer RUs are proposed, designers need to map the customer RUs and obtain the technical fea-tures of products and services from technical perspec-tive. In the mapping process, the requirement weight is obtained by the corresponding method, and finally, the target value of technical characteristics is obtained. Jin et al.12 mapped CR by the QFD method. Liu et al.13 developed the fuzzy nonlinear regression model to embed the CR compensation degree to quality function configuration and realized CR mapping. Wang and Chin14 proposed linear goal programming method to evaluate the relative importance weights of CR. Chougule et al.15determined the importance of CR by
the fuzzy logic algorithm. Wang16determined the stan-dard weight in the fuzzy multi-criteria decision, com-bined with the fuzzy quality function deployment (FQFD) and relative preference relation. Zaim et al.17 sorted the product technical characteristics which used hybrid analytic network process (ANP) and fuzzy logic. Li et al.18 put forward modeling method based on rough set theory and determined some technical char-acteristic target of QFD. Fung et al.19 determined the target value of some technical characteristics by the multi-objective genetic rule mining algorithm.
Modeling of CR
The method proposed in this article includes two main processes: CR modeling and CR mapping. For the CR modeling process, first the definition and description of RU are given so as to use in configuration design, then the CR decomposition is carried out according to four rules, and finally, the CR model with four layers is obtained in this article.
Definition of RU
CR has features such as uncertainty, dynamic nature, priority, and diversity. It is needed to confirm and refine the CR and map it as information of configura-tion design into the detailed technical parameters so as to apply it in design, manufacturing, service, and so on. In order to establish CR model, this article introduces the conception of ‘‘Requirement Unit.’’
Definition 1. RUrefers to the minimum unit that cannot be further subdivided during the decomposing of CR in the requirement model. To identify and invoke the information of RU in the configuration design system, the RU needs to be formalistically described as
RU =fId,Type1,Type2,Signalment,Significanceg
whereIdis the identification code of RU, consisting of numbers;Type 1is the type of RU. For numerical con-trol machine, product-related varieties are 0 and service-related varieties are 1; Type 2 is the type of requirement of RU. For numerical control machine, RU mainly includes five types, namely, work environ-ment, function requirement, safety requirement, requirement of technologies, and service and others.
Significance describes the importance of RU in the form of number, including four categories, namely, ‘‘must meet,’’ ‘‘important,’’ ‘‘relatively important,’’ and ‘‘not so important,’’ as 1, 2, 3, and 4, respectively.
CR decomposition
CR contains different RUs, and generally, there are unclear, abstract, and incomplete RUs, so we must analyze and handle the initial CR and decompose and transmit the vague and abstract initial CR into a series of explicit and detailed customer RUs. Decomposition of CR can be indicated as follows
CR =fRU1, RU2,. . ., RUng
where CR refers to customer requirement, which results in RU1, RU2,.RUnthrough decomposition.
Figure 1 shows the decomposition process of CR. To ensure the information integrity of CR, RU should fully express the original CR. The rules of decomposi-tion are set by the designer, used for guiding the decom-position of CR. The rules of decomdecom-position of CR are as follows:
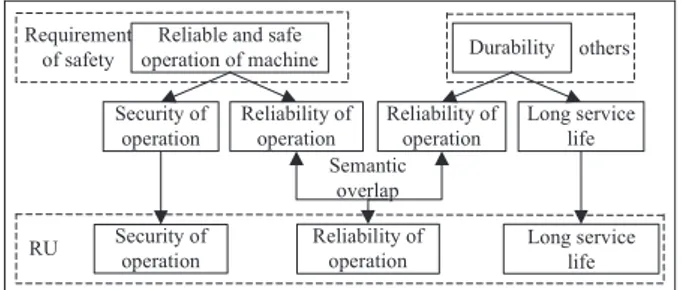
1. Rule of semantic decomposition. The expression of CRs is generally descriptive words and con-tains the expectations of customer. Rule of semantic decomposition refers to decomposing these descriptive words into semantics so as to obtain minimum, complete, and independent information of CR. This rule is based on the fact that the descriptive words which express semantics can be decomposed. Applying this rule can fully exploit complete information of requirement. As an example shown in Figure 2, the requirement of safety of customer, that is, safe and reliable operation of the machine, can be decomposed into ‘‘safe operation’’ and ‘‘reli-able operation,’’ two complete and independent RUs.
2. Rule of merging same requirements. After decomposing CR, there may be semantic over-laps of RU, and we need to merge them. The rule of merging same RUs refers to merging same requirement. As an example shown in Figure 2, the same RUs, ‘‘reliable operation,’’ are merged.
3. Rule of semantic consistency. Rule of semantic consistency refers to that the decomposed RUs should be consistent with the original CR in semantics and may not change the semantics of CR during decomposition.
4. Rule of semantic correspondence. Rule of seman-tic correspondence refers to that the decom-posed RUs should correspond to the original CR and avoid information loss.
Decomposing the CR based on the above four rules will make the RUs fully express CR and also ensure the avoidance of information overlap of requirement so as to decompose the vague and abstract CRs into clear and specific information of RUs.
Modeling of CRs
CRs consist of RUs, which have relevance and hierar-chy. And we should consider these features during the modeling of CRs. CRs contain both the requirement description of product and that of service, based on which the CRs will be classified as ‘‘product-related varieties’’ and ‘‘service-related varieties.’’ Decompose CRs according to rules of decomposition of CRs until no further subdivision can be proceeded, and finally, a series of detailed RUs are obtained, as shown in Figure 3. The more the layers of the requirement model, the more complicated the model. To make the model simple, this article adopts the model with four layers.
First layer. It is about the original requirements, rep-resenting the initial CRs. CRs have dynamic nature and different types of products corresponding to dif-ferent CRs, such as ‘‘Economical Turning Center (ETC) numerical control machine’’ and ‘‘Horizontal Turning Center (HTC) numerical control machine.’’ Second layer. It initially classifies CRs. According to the integrity thought of product service system, decompose CRs from the view of product and ser-vice to confirm the CRs about product and serser-vice. Figure 1. Decomposition process of CR.
Third layer. It refers to the type of RUs. It is used for the classification of each RU, numbering the type of requirement with number, and disposing numbers of all subrequirements in this layer.
Fourth layer. It indicates the final layer of RUs through decomposition. Merge the RUs according to the rule of merging same requirements and num-ber the RUs.
Mapping of CRs based on rules
For the CR mapping process, which is the second pro-cess of the method proposed in this article, first the house of quality of CR mapping is given using QFD, then the weights of RUs and technical features are cal-culated, and finally, the target values of technical fea-tures are determined by rule mining algorithm based on rough set theory.
Mapping house of quality of CRs for configuration
design
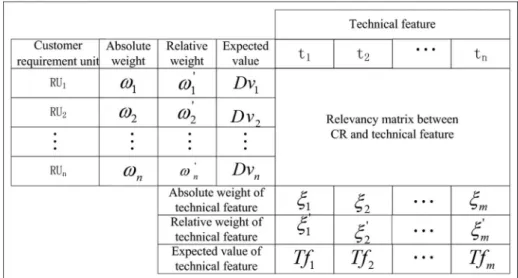
The customer RU is the target that the configuration design of product service system should finally reach, and it is the requirement about product and service that customers propose, but it cannot really guide the pro-cess of configuration of product and service. During configuration, the designer should map these RUs into technical features of product and service. This article obtains information needed during the configuration design of product or service using QFD, and the struc-ture is shown in Figure 4. The main conception of the house of quality is presented as follows:
Input end. It includes the customer RU and its abso-lute weight and relative weight, and it also adds the
expectation value of CR to represent the CR about product or service. The expectation value corre-sponds to each RU and has mapping relation with the target value of technical features.
Technical feature. It refers to the item of technical feature that the designer sets in configuration design according to CR. It not only includes quantitative descriptions but also contains qualitative descrip-tion. For example, in the sentence ‘‘the speed of main shaft is 4500 r/min,’’ ‘‘the speed of main shaft’’ is technical feature, while ‘‘4500 r/min’’ is quantita-tive description; in the sentence ‘‘installation services is optional,’’ ‘‘installation services’’ is technical fea-ture, while ‘‘optional’’ is qualitative description. Relevancy matrix. It indicates the relevance between customer RU and technical feature, including ‘‘strong relevancy,’’ ‘‘medium relevancy,’’ ‘‘weak relevancy,’’ and ‘‘no relevancy.’’ It is used for con-firming the weight of technical feature, and the eva-luation of relevancy is shown in Table 1.
Weight of technical feature and target value. The weight of technical feature is used to describe the degree of importance of technical feature, and it is obtained from the relevancy matrix and weight of RUs. The target value of technical feature indicates the expectation value of technical feature, corre-sponding with the technical feature.
from CRs to technical feature. This process is indicated in Figure 5.
Establishment of standard weight matrix. This article adopts the standard weight matrix to confirm the weight of RU, and the main process is as follows:
1. Decomposition of CRs. Analyze and decompose the initial CRs and establish the CR model to obtain a series of RUs, each of which includes all information of CR. Finally, the vector quan-tity of expectation of RU is obtained
RUs=fSl1,Sl2,. . .,Slng
where RUs indicates the set of expectation value of RUs, andSlipresents the expectation value
correspond-ing to theicustomer RU,i= 1, 2,.,n.
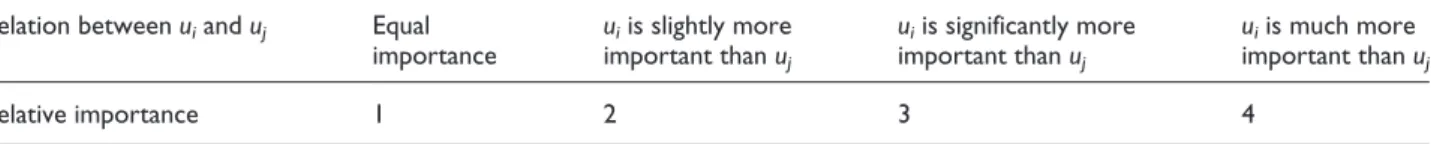
2.Establishment of weight matrix. Conduct pairwise comparison on the RUs and establish weight matrix. Indicate the degree of relative importance between ith RU andjth RU with uij, including four degrees,
namely, ‘‘equal importance,’’ ‘‘slight importance,’’ ‘‘significant importance,’’ and ‘‘much more impor-tance.’’ Table 2 shows the evaluation of the relative importance between the RUs.
Represent the vector quantity of RU with set U= {U1,U2,.,Un}, and the weight matrix of
require-ment,Uj, is Figure 4. House of quality of CR mapping for configuration design.
Figure 5. Mapping process from CR to technical feature.
Table 1. Evaluation form of relevancy between customer requirement unit and technical feature.
Description of relevancy No relevancy Weak relevancy Medium relevancy Strong relevancy
Uj=UU 1
=
U1U1 U1U2 U1Un
U2U1 U2U2 U2Un
. . . . . . . . .
UnU1 UnU2 UnUn 2 6 6 6 4 3 7 7 7 5
ð1Þ
whereUjis the symmetric matrix. For the convenience of calculation, only the upper triangular matrix is adopted, that is
Uj==
U1U1 U1U2 U1Un
U2U2 U2Un
.
. .
UnUn 2 6 6 6 4 3 7 7 7 5
ð2Þ
3.Establishment of standard weight matrix. Simplify formula (2) according to the rules below:
(a) Since diagonal line is the comparison of itself, the degree of importance is the same, indicated by ‘‘1.’’
(b) If Ui and Uj have the same degree of impor-tance, it may be indicated by ‘‘UiUj.’’ (b) Others may be indicated by ‘‘Ukl.’’Ukrefers
to Ui or Uj, whichever has a higher degree of relative importance;lshould correspond to the values in Table 2; andi, j= 1, 2,.,n.
Through adjustment of the weight matrix based on the above rules, the standard weight matrix can be obtained.
Calculation of weight of RU. Solve the standard weight matrix according to formula (3) and confirm the abso-lute weight ofUi
vi=Row Uji
+Column Uji
ð3Þ
whereviis the absolute weight of theith RU,Row(Uji) is the sum of weight of row vector of Ui, and
Column(Uji) is the sum of weight of column vector of
Ui.
Confirm the relative weight of Ui according to for-mula (4)
v9i=10 vi vimax
ð4Þ
wherevimax is the maximum value ofvi. For the con-venience of comparison, the maximum relative weight is set as 10.
Confirmation of weight of technical feature. CR and techni-cal feature are mapped through the relevancy matrix, and the premise is that there is correspondence between them. The absolute weight of any technical feature, jj, can be confirmed through formula (5)
jj=X n
i=1
viRij, j=1,2,. . .,m ð5Þ
where Rij refers to the relevancy between the ith RU and thejth technical feature, and the value of it is con-firmed based on Table 1, i=1,2,
. . .,n and j=1,2,
. . .,m. Similarly, the relative weight of
techni-cal feature can be obtained.
Rule mining algorithm based on rough set theory
When using QFD, the confirmation of target value of technical feature is a key step. The target values of some technical features can be directly obtained from the expectation value of CR, while some cannot, and the information of requirement is vague. This article adopts rough set theory to confirm the target value of technical feature that cannot be directly mapped.The rough set theory is carried out by operating the data in the existing database and exploits the rules of relevancy for guiding the new design. Reduction is a key content of rough set theory, which does not need any a priori knowledge and will measure the degree of uncertainty of knowledge using the relation of equiva-lence of dataset, which can avoid the error brought by the subjective assessment of knowledge.
Definition 2. Decision table S= (U,C[D,V,f). U is the domain of discourse, andU=fx1,x2,. . .,xng.Cis the condition attributes, D is the decision attributes, and C[D=a1,a2,. . .,am. V=Ua2C[DVa, Va is the value range of attribute a, and f is the information function between domain of discourse and range. For anyxp 2U,rpindicates decision rule.
Table 2. Evaluation of relative importance between the RUs.
Relation betweenuianduj Equal
importance
uiis slightly more
important thanuj
uiis significantly more
important thanuj
uiis much more
important thanuj
Relative importance 1 2 3 4
Definition 3. For any decision rulerp(rowpof the deci-sion table,p2 f1,2,
. . .,ng), the discernibility matrix, M(rp), is
M rp=Cijn3m
Cij=
1, f xp,aj=f xi,aj
0, others
(
ð6Þ
wheref(xi,aj) is the attribute value of the individual ele-mentxiinUon attributeaj.
The detailed description of the algorithm is as follows:
Step 1. Conduct attribute reduction on the decision tableSto eliminate the obvious attributes and obtain the new decision tableS9= (U,C9[D9,V9,f). After reduction, there will be m1 condition attributes and m2 decision attributes.
Step 2. Calculate the discernibility matrix of each rulerpof decision tableS9according to formula (6). Step 3. Check the firstm1columns of the
discernibil-ity matrix column by column and replace all in the column j of M(rp) with 1 to obtain M9(rp). Then, check it row by row. If i making
Ci1^Ci2^ ^Cim1:(Ci(m1+1)+Ci(m1+m2)) =1
exists, conflict appears andaj can be concluded as the core-value attribute.
Step 4. Select the attribute with the least importance in the non-core-value attributes and make its posi-tion in the discernibility matrix to be 1 to obtain the new matrix. Then, check it row by row. If noimaking
Ci1^Ci2^ ^Cim1:(Ci(m1+1)+Ci(m1+m2)) =1
exists, eliminate this attribute and repeat this process until all attributes are checked.
Step 5. The decision rule after reduction is obtained. Step 6. Merge the same rules and obtain the final decision rules.
Instance analysis
Take the ETC numerical control machine as an exam-ple to explain the modeling and mapping of CRs.
Modeling of CRs
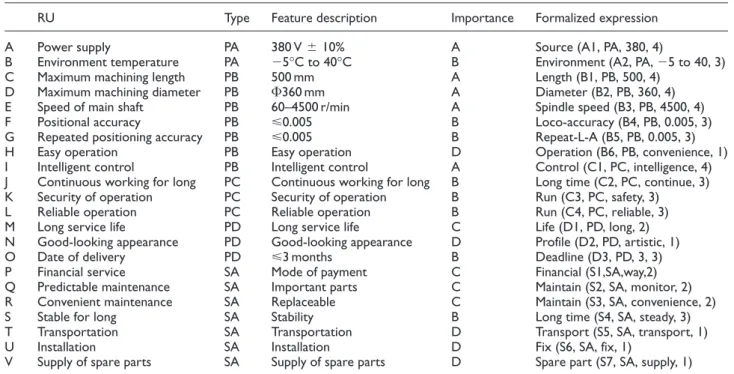
The customized requirement is ‘‘ETC numerical control machine.’’ Decompose it layer by layer. First, decom-pose the CR from the view of product and service to obtain subrequirement and then continue decomposing these subrequirements to obtain RUs. Using the rule of merging same requirements, the CR model of ETC numerical control machine is established as shown in Figure 6. The formalized expression of RU is shown in Table 3.
Solution of weight of RU
Table 3 shows the importance of each RU. Compare the degree of importance of each RU and confirm the weight of each RU of the numerical control machine by standard weight matrix. The results are shown in Table 4.
Confirmation of technical feature
Through analysis, the technical features that meet the CRs include the maximum machining diameter, maxi-mum machining length, positional accuracy, repeated positioning accuracy, torque of main shaft, maximum speed of revolution of main shaft, power of main motor, rapid traverse speed, operating stroke ofX-axis, through-hole of main shaft, numerical control system, locking of tail platform, nominal voltage, service life, automatic chip cleaner, intelligent control service, numerical control programming service, logistics ser-vice, installation services, fundamental maintenance service, service beyond warranty period, recycling ser-vice, and service of spare parts.
Confirmation of target value of technical feature
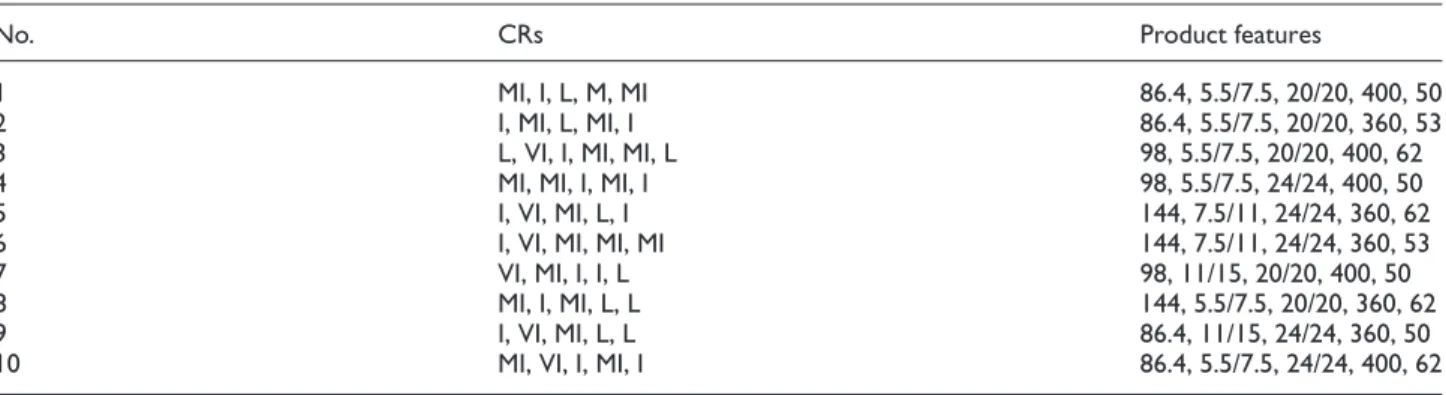
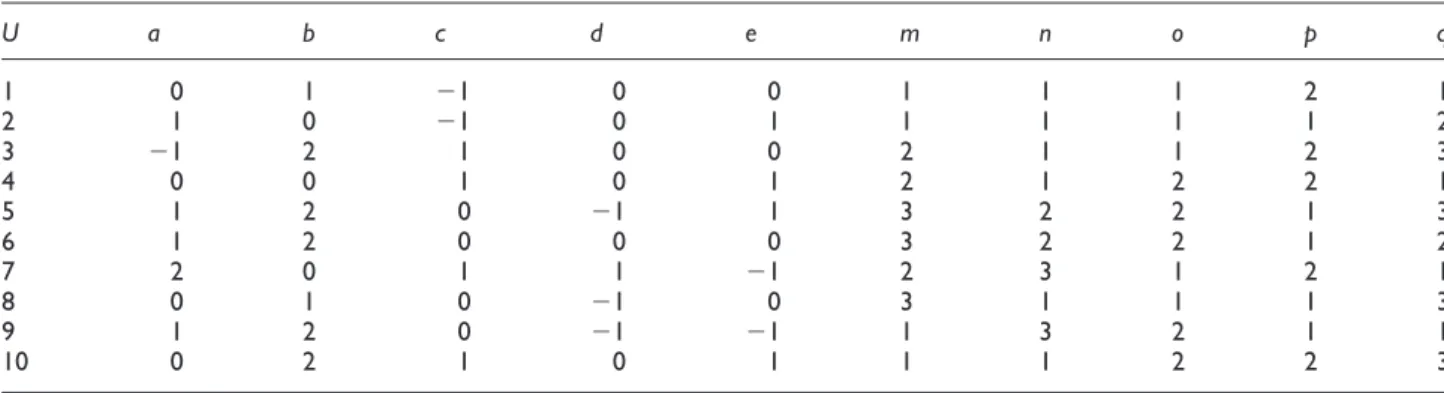
The CR attributes can be described by fuzzy variables ‘‘VI (very important),’’ ‘‘I (important),’’ ‘‘MI (medium important),’’ and ‘‘L (low).’’ Conduct attribute reduc-tion on the CRs as shown in Table 3 to obtain the undecipherable CRs, easy operation (G), intelligent control (I), continuous working for long (J), security of operation (K), and good-looking appearance (N). According to the degree of importance in Table 4, I.K.G = J.N. The technical features of service are represented in this article as qualitative features, which will be measured based on ‘‘optional outfit,’’ and no parameterization is needed. So, the technical fea-tures requiring confirmation are those related to prod-ucts. Table 5 shows the historical records of CR and product features.For the convenience of calculation, assignment needs to be done on the degree of importance of CRs, and the values are shown in Table 6. Number the set of target value of technical features of products as shown in Table 7. Finally establish a decision table as shown in Table 8, in whicha, b, c, d, and e indicate condition attributes, corresponding to customer RU;m, n, o, p, andqare decision attributes, corresponding to techni-cal features.
Take the fourth rule as an example. For the fourth rule, r4, calculate the discernibility matrix M(r4)
according to formula (6) and check it column by col-umn. Set all in the second column as 1 to obtain
M9(r4). Then, it is found that C1^C2 ^C5:C6=1
Figure 6. Requirement model of ETC numerical control machine.
Table 3. Formalized expression of RU of ETC numerical control machine.
RU Type Feature description Importance Formalized expression
A Power supply PA 380 V610% A Source (A1, PA, 380, 4)
B Environment temperature PA 25°C to 40°C B Environment (A2, PA,25 to 40, 3)
C Maximum machining length PB 500 mm A Length (B1, PB, 500, 4)
D Maximum machining diameter PB F360 mm A Diameter (B2, PB, 360, 4)
E Speed of main shaft PB 60–4500 r/min A Spindle speed (B3, PB, 4500, 4)
F Positional accuracy PB <0.005 B Loco-accuracy (B4, PB, 0.005, 3)
G Repeated positioning accuracy PB <0.005 B Repeat-L-A (B5, PB, 0.005, 3)
H Easy operation PB Easy operation D Operation (B6, PB, convenience, 1)
I Intelligent control PB Intelligent control A Control (C1, PC, intelligence, 4) J Continuous working for long PC Continuous working for long B Long time (C2, PC, continue, 3) K Security of operation PC Security of operation B Run (C3, PC, safety, 3) L Reliable operation PC Reliable operation B Run (C4, PC, reliable, 3) M Long service life PD Long service life C Life (D1, PD, long, 2) N Good-looking appearance PD Good-looking appearance D Profile (D2, PD, artistic, 1)
O Date of delivery PD <3 months B Deadline (D3, PD, 3, 3)
P Financial service SA Mode of payment C Financial (S1,SA,way,2)
Q Predictable maintenance SA Important parts C Maintain (S2, SA, monitor, 2) R Convenient maintenance SA Replaceable C Maintain (S3, SA, convenience, 2)
S Stable for long SA Stability B Long time (S4, SA, steady, 3)
T Transportation SA Transportation D Transport (S5, SA, transport, 1)
U Installation SA Installation D Fix (S6, SA, fix, 1)
V Supply of spare parts SA Supply of spare parts D Spare part (S7, SA, supply, 1)
Table 4. Solution of weight of RU.
No. A B C D E F G H . Q R S T U V
A 1 A-2 A-C A-D A-E A-2 A-2 A-4 . A-3 A-3 A-2 A-4 A-4 A-4
B 1 C-2 D-2 E-2 B-F B-G B-2 . B-2 B-2 B-S T-2 U-2 V-2
C 1 C-D C-E C-2 C-2 C-4 . C-3 C-3 C-2 C-4 C-4 C-4
D 1 D-E D-2 D-2 D-4 . D-3 D-3 D-2 D-4 D-4 D-4
E 1 E-2 E-2 E-4 . E-3 E-3 E-2 E-4 E-4 E-4
F 1 F-G F-3 . F-2 F-2 F-S F-3 F-3 F-3
G 1 G-3 . G-2 G-2 G-S G-3 G-3 G-3
H 1 . Q-2 R-2 S-3 H-T H-U H-V
I . I-3 I-3 I-2 I-4 I-4 I-4
J . J-2 J-2 J-S J-3 J-3 J-3
K . K-2 K-2 K-S K-3 K-3 K-3
L . L-2 L-2 L-S L-3 L-3 L-3
M . M-Q M-R S-2 M-2 M-2 M-2
N . Q-2 R-2 S-3 N-T N-U N-V
O . O-2 O-2 O-S O-3 O-3 O-3
P . P-Q P-R S-2 P-2 P-2 P-2
Q . 1 Q-R S-2 Q-2 Q-2 Q-2
R . 1 S-2 R-T R-U R-V
S . 1 S-3 S-3 S-3
T . 1 T-U T-V
U . 1 U-V
V . 1
Absolute 53 21 53 54 48 31 30 5 . 16 10 30 12 10 6
Relative 9.8 3.9 9.8 10 8.9 5.7 5.5 0.9 . 3.0 1.8 5.5 2.2 1.8 1.1
RU: requirement unit.
Table 5. Historical records of CRs and product features.
No. CRs Product features
1 MI, I, L, M, MI 86.4, 5.5/7.5, 20/20, 400, 50
2 I, MI, L, MI, I 86.4, 5.5/7.5, 20/20, 360, 53
3 L, VI, I, MI, MI, L 98, 5.5/7.5, 20/20, 400, 62
4 MI, MI, I, MI, I 98, 5.5/7.5, 24/24, 400, 50
5 I, VI, MI, L, I 144, 7.5/11, 24/24, 360, 62
6 I, VI, MI, MI, MI 144, 7.5/11, 24/24, 360, 53
7 VI, MI, I, I, L 98, 11/15, 20/20, 400, 50
8 MI, I, MI, L, L 144, 5.5/7.5, 20/20, 360, 62
9 I, VI, MI, L, L 86.4, 11/15, 24/24, 360, 50
10 MI, VI, I, MI, I 86.4, 5.5/7.5, 24/24, 400, 62
CR: customer requirement.
Table 6. Values of degree of importance of CR.
Importance degree L MI I VI
Value 21 0 1 2
CR: customer requirement.
Table 7. Product feature and values.
No. Product feature Value Decision table
1 Rated torque of main shaft {86.4, 98, 144 N m} {1, 2, 3}
2 Power of main motor {5.5/7.5, 7.5/11, 11/15 kW} {1, 2, 3}
3 Rapid traverse speed {20/20, 24/24 mm/min} {1, 2}
4 Operating stroke ofX-axis {360, 400 mm} {1, 2}
second column is core-value attribute. Conduct the same operation on other columns, and no column meeting C1^C2 ^C5:C6=1 is found, so b is the
only core-value attribute, andcore(r4) =fbg
M rð Þ4 =
1 0 0 1 0 0 1 0 1 1 0 1 0 1 1 0 1 0 0 0 0 0 1 1 0 1 1 0 1 0 1 1 1 1 1 1 1 1 1 1 0 0 0 0 1 0 0 1 0 0 0 0 0 1 0 0 0 1 0 0 0 1 1 0 0 1 0 0 1 1 1 0 0 0 0 0 1 0 0 0 0 0 0 0 0 0 0 1 0 1 1 0 1 1 1 0 1 1 1 0 2 6 6 6 6 6 6 6 6 6 6 6 6 6 6 6 6 6 6 4 3 7 7 7 7 7 7 7 7 7 7 7 7 7 7 7 7 7 7 5
M9ð Þr4 =
1 1 0 1 0 0 1 0 1 1 0 1 0 1 1 0 1 0 0 0 0 1 1 1 0 1 1 0 1 0 1 1 1 1 1 1 1 1 1 1 0 1 0 0 1 0 0 1 0 0 0 1 0 1 0 0 0 1 0 0 0 1 1 0 0 1 0 0 1 1 1 1 0 0 0 0 1 0 0 0 0 1 0 0 0 0 0 1 0 1 1 1 1 1 1 0 1 1 1 0 2 6 6 6 6 6 6 6 6 6 6 6 6 6 6 6 6 6 6 4 3 7 7 7 7 7 7 7 7 7 7 7 7 7 7 7 7 7 7 5
According to the degree of importance of CR in Table 4, I.K.G = J.N, and the character is b.d.a=c.e.
Select the attribute with the lowest importance degree in the non-core-value attributes as N and set this attribute as 1. Check whetherC1^C2 ^C5:C6=1.
If not existing, delete this column in the matrix. Check other attributes in turns, and finally, the ruler4is
að Þ4 =0^bð Þ4 =0^dð Þ4 =0)mð Þ4 =2
Repeat the steps above for each rule, and we can obtain the set of rules. Merge and organize the set of rules. The final rule database is shown in Table 9.
Assume the CR is {CR(a) = 1, CR(b) = 2, CR(c) = 1, CR(d) = 0, CR(e) =21}. According to the rules in the rule database, the attribute values of some rules can be deduced. Through deduction, it is con-cluded that {m= 1&n= 3&o= 2&p= 1&q= 1}. The final result is {rated torque of main shaft = 86.4 N m, power of main motor = 11 kW, rapid traverse speed = 24/24 mm/min, operating stroke of X-axis = 360 mm, diameter of through-hole of main shaft = 50 mm}.
Conclusion
In order to better understand CR and develop satisfied product, it is necessary to systematically analyze and Table 8. Decision table of RUs.
U a b c d e m n o p q
1 0 1 21 0 0 1 1 1 2 1
2 1 0 21 0 1 1 1 1 1 2
3 21 2 1 0 0 2 1 1 2 3
4 0 0 1 0 1 2 1 2 2 1
5 1 2 0 21 1 3 2 2 1 3
6 1 2 0 0 0 3 2 2 1 2
7 2 0 1 1 21 2 3 1 2 1
8 0 1 0 21 0 3 1 1 1 3
9 1 2 0 21 21 1 3 2 1 1
10 0 2 1 0 1 1 1 2 2 3
RU: requirement unit.
Table 9. Rules after merging.
No. CRs Inference result
1 b= 0 o= 1&p= 2&n= 1
2 b= 1 n= 1&o= 1
3 b= 2 p= 1
4 b= 1Ld= 0 m= 1&p= 2&q= 1 5 a= 0Lb= 0Ld= 0 m= 2&q= 1 6 a= 0Lb= 2Lc= 1Ld= 0 m= 1&o= 2 7 a=21Lb= 2Lc=21Ld= 0 m= 2&o= 1 8 b= 0Ld= 0 m= 1&n= 1&o= 1
&p= 1&q= 2 9 b= 0Ld= 1 m= 2&n= 3&o= 1
&p= 2&q= 1 10 b= 0Ld=21 m= 3&p= 1&q= 2 11 b= 2Ld=21 o= 2&p= 1 12 b= 2Lc= 1Ld= 0 n= 1&p= 2&q= 3 13 b= 2Ld=21Le= 1 n= 2&p= 3
14 b= 2Le= 1 m= 3
15 b= 2Le=21 m= 1
16 e=21 n= 3&q= 1
handle CR. This article introduced the conception of RU and established the model of CR by analyzing CR and based on the rules of decomposition of CR, which can clearly describe the hierarchy and relevancy between RUs. This article built the house of quality of mapping requirement and realized the mapping from CR to technical weight and target value, which pro-vided conditions for the following configuration design. Finally, this article took the ETC series numerical con-trol machine as an example to accomplish modeling and mapping of CR and verified the validity and prac-ticability of the proposed CR model.
Declaration of conflicting interests
The author(s) declared no potential conflicts of interest with respect to the research, authorship, and/or publication of this article.
Funding
This work is supported by the Fundamental Research Funds for the Central Universities (N140305001), the Natural Science Fund of Liaoning Province (2013020052), and the Research Funds of State ‘‘Twelve Five’’ Support Program (2012BAF12B08).
References
1. Junwu D, Dongtao Y and Zhengqian B. Research on capturing of customer requirements based on innovation theory.Phys Procedia2012; 24: 1868–1880.
2. Shan Q and Chen Y. Product module identification based on assured customer requirements. Procedia Eng 2011; 15: 5313–5317.
3. Violante MG and Vezzetti E. A methodology for sup-porting requirement management tools (RMt) design in the PLM scenario: an user-based strategy. Comput Ind 2014; 66: 1065–1075.
4. Hauksdo´ttir D, Mortensen NH and Nielsen PE. Identifi-cation of a reusable requirements structure for embedded products in a dynamic market environment.Comput Ind 2013; 64: 351–362.
5. Li Y-L, Chin K-S and Luo X-G. Determining the final priority ratings of customer requirements in product planning by MDBM and BSC. Expert Syst Appl 2012; 39: 1243–1255.
6. Wang Y and Tseng MM. Integrating comprehensive cus-tomer requirements into product design. CIRP Ann: Manuf Techn2011; 60: 175–178.
7. Wang Y and Tseng MM. Incorporating tolerances of customers’ requirements for customized products.CIRP Ann: Manuf Techn2014; 63: 129–132.
8. Cao D, Li Z and Ramani K. Ontology-based customer preference modeling for concept generation. Adv Eng Informat2011; 25: 162–176.
9. Li Y-L, Tang J-F, Chin K-S, et al. On integrating multi-ple type preferences into competitive analyses of cus-tomer requirements in product planning.Int J Prod Econ 2012; 139: 168–179.
10. Liu Z-L, Zhang Z and Chen Y. A scenario-based approach for requirements management in engineering design.Concurrent Eng: Res A2012; 20: 99–109.
11. Violante MG, Vezzetti E and Alemanni M. An integrated approach to support the Requirement Management (RM) tool customization for a collaborative scenario.Int J Interact Des Manuf. Epub ahead of print 5 March 2015. DOI: 10.1007/s12008-015-0266-3.
12. Jin J, Ji P, Liu Y, et al. Translation online customer opi-nions into engineering characteristics in QFD: a prob-abilistic language analysis approach.Eng Appl Artif Intel 2015; 41: 115–127.
13. Liu Y, Zhou J and Chen Y. Using fuzzy non-linear regression to identify the degree of compensation among customer requirements in QFD. Neurocomputing 2014; 142: 115–124.
14. Wang Y-M and Chin K-S. A linear goal programming approach to determining the relative importance weights of customer requirements in quality function deployment. Inform Sci2011; 181: 5523–5533.
15. Chougule R, Khare VR and Pattada K. A fuzzy logic based approach for modeling quality and reliability related customer satisfaction in the automotive domain. Expert Syst Appl2013; 40: 800–810.
16. Wang Y-J. A criteria weighting approach by combining fuzzy quality function deployment with relative prefer-ence relation.Appl Soft Comput2014; 14: 419–430. 17. Zaim S, Sevkli M, Camgo¨z-Akdag˘ H, et al. Use of ANP
weighted crisp and fuzzy QFD for product development. Expert Syst Appl2014; 41: 4464–4474.
18. Li Y-L, Tang J-F, Chin K-S, et al. Rough set-based approach for modeling relationship measures in product planning.Inform Sci2012; 193: 199–217.