ACPD
11, 3627–3661, 2011CO source contribution analysis
for California during ARCTAS-CARB
G. G. Pfister et al.
Title Page
Abstract Introduction
Conclusions References
Tables Figures
◭ ◮
◭ ◮
Back Close
Full Screen / Esc
Printer-friendly Version Interactive Discussion
Discussion
P
a
per
|
Dis
cussion
P
a
per
|
Discussion
P
a
per
|
Discussio
n
P
a
per
|
Atmos. Chem. Phys. Discuss., 11, 3627–3661, 2011 www.atmos-chem-phys-discuss.net/11/3627/2011/ doi:10.5194/acpd-11-3627-2011
© Author(s) 2011. CC Attribution 3.0 License.
Atmospheric Chemistry and Physics Discussions
This discussion paper is/has been under review for the journal Atmospheric Chemistry and Physics (ACP). Please refer to the corresponding final paper in ACP if available.
CO source contribution analysis for
California during ARCTAS-CARB
G. G. Pfister1, J. Avise2, C. Wiedinmyer1, D. P. Edwards1, L. K. Emmons1, G. D. Diskin3, J. Podolske4, and A. Wisthaler5
1
Atmospheric Chemistry Division, National Center for Atmospheric Research, Boulder, CO, USA
2
California Air Resources Board, Sacramento, CA, USA 3
Chemistry and Dynamics Branch, NASA Langley Research Center, Hampton, VA, USA 4
NASA Ames Research Center, Moffett Field, CA, USA 5
Institute for Ion Physics & Applied Physics, University of Innsbruck, Innsbruck, Austria
Received: 17 November 2010 – Accepted: 27 January 2011 – Published: 1 February 2011
Correspondence to: G. Pfister (pfister@ucar.edu)
ACPD
11, 3627–3661, 2011CO source contribution analysis
for California during ARCTAS-CARB
G. G. Pfister et al.
Title Page
Abstract Introduction
Conclusions References
Tables Figures
◭ ◮
◭ ◮
Back Close
Full Screen / Esc
Printer-friendly Version Interactive Discussion
Discussion
P
a
per
|
Dis
cussion
P
a
per
|
Discussion
P
a
per
|
Discussio
n
P
a
per
|
Abstract
Air pollution is of concern in many parts of California and is impacted by both local emis-sions and also by pollution inflow from the Pacific. In this study, we use the regional chemical transport model WRF-Chem V3.2 to examine the CO budget over California. We include model CO tracers for different emission sources in the model, which allow
5
estimating the relative importance of local sources versus pollution inflow on the dis-tribution of CO at the surface and in the free troposphere. The focus of our study is on the 15 June–15 July 2008 time period, which coincides with the aircraft deployment of the NASA Arctic Research of the Composition of the Troposphere from Aircraft and Satellites (ARCTAS) mission over California. Model simulations are evaluated using
10
these aircraft observations as well as satellite retrievals and surface observations of CO. Evaluation results show that the model overall predicts the observed CO fields well, but points towards an underestimate of CO from the fires in Northern California, which had a strong influence during the study period, and towards a slight overestimate of CO from pollution inflow and local anthropogenic sources. The analysis of the CO
15
budget over California reveals that inflow of CO explains on average 53±21% of
sur-face CO during the study period, compared to 22±18% for local anthropogenic sources
and 18±22% for fires. In the free troposphere, the average CO contributions are esti-mated as 78±16% for CO inflow, 6±4% for CO from local anthropogenic sources and 11±13% for CO from fires.
20
1 Introduction
Carbon monoxide (CO) is the third most abundant carbon-based trace gas in the at-mosphere, after carbon dioxide and methane and plays a key role in the production of tropospheric ozone and the budget of the hydroxyl radical. It has a lifetime on the or-der of weeks to months in the troposphere, which means that the global distribution of
25
ACPD
11, 3627–3661, 2011CO source contribution analysis
for California during ARCTAS-CARB
G. G. Pfister et al.
Title Page
Abstract Introduction
Conclusions References
Tables Figures
◭ ◮
◭ ◮
Back Close
Full Screen / Esc
Printer-friendly Version Interactive Discussion
Discussion
P
a
per
|
Dis
cussion
P
a
per
|
Discussion
P
a
per
|
Discussio
n
P
a
per
|
relatively long lifetime permits the study of long-range transport in the free troposphere and makes it a useful tracer of other pollutants (Staudt et al., 2001; Liang et al., 2004; Yashiro et al., 2009).
The main sources of CO in the atmosphere include biomass burning and fossil fuel use, followed by oxidation of hydrocarbons and oxidation of methane. More than half
5
of all CO emissions are considered to be man-made (Granier et al., 2000; Bey et al., 2001; Horowitz et al., 2003). The major global sink for tropospheric CO is reaction with the hydroxyl radical (Warneck, 2000). Average CO concentrations in the atmosphere are about 50–150 ppbV in remote regions, 100–300 ppbV in more rural regions and may reach up to several ppmV in urban areas where CO causes a hazard to human
10
health.
Previous studies have applied the concept of “CO tracers” to keep track of the CO from different source terms in the analysis of the CO budget (e.g. Granier et al., 1999; Pfister et al., 2004; Duncan et al., 2007; Pfister et al., 2010a) and for improving emis-sion estimates through inverse modeling techniques (e.g. Palmer et al., 2003; Petron
15
et al., 2004; Heald et al., 2004; Arellano et al., 2004; Pfister et al., 2005; Arellano et al., 2006; Kopazc et al., 2010). In this study we use the regional Weather and Research Forecasting Model with Chemistry (WRF-Chem V3.2) to examine CO contributions over California (CA) and assess the CO budget by tracking CO emitted from individual emission sources. To our knowledge this is the first time that the concept of CO tracers,
20
which is commonly used in global models, is applied in a regional model.
The focus time period of our study is on the NASA Arctic Research of the Compo-sition of the Troposphere from Aircraft and Satellites (ARCTAS) mission. As part of ARCTAS, the California Air Resources Board (CARB) sponsored flights over CA and the eastern North Pacific during the second half of June 2008. The objectives were to
25
ACPD
11, 3627–3661, 2011CO source contribution analysis
for California during ARCTAS-CARB
G. G. Pfister et al.
Title Page
Abstract Introduction
Conclusions References
Tables Figures
◭ ◮
◭ ◮
Back Close
Full Screen / Esc
Printer-friendly Version Interactive Discussion
Discussion
P
a
per
|
Dis
cussion
P
a
per
|
Discussion
P
a
per
|
Discussio
n
P
a
per
|
CO distribution and variability over CA. The CO budget over CA is then estimated from the analysis of CO tracer fields in the regional model simulations in combination with global model results.
The outline of the manuscript is as follows. After an introduction of the modeling configuration in Sect. 2, we describe the set of observations used in the model
eval-5
uation and present results from the model evaluation in Sect. 3. Sect. 4 discusses the source contribution for surface CO as well as for CO loadings integrated over the extent of the boundary layer and the free troposphere. In Sect. 5 we present a set of sensitivity simulations with altered anthropogenic and fire emissions. The study results are summarized in Sect. 6.
10
2 Model simulations
The regional chemical transport simulations were performed using the Weather Re-search and Forecasting model with chemistry (WRF-Chem Version 3.2) (Grell et al., 2005). The chemistry component of WRF-Chem is fully consistent with the meteo-rological component (WRF); both use the same transport scheme (mass and scalar
15
preserving), the same grid (horizontal and vertical), and the same physics schemes for subgrid-scale transport. WRF-Chem includes online biogenic emissions and dry depo-sition and a photolysis scheme that is coupled with hydrometeors as well as aerosols. Our simulation uses the Bougeault-Lacarrere boundary layer scheme (Bougeault and Lacarrere, 1989) and the Noah land surface model (Ek et al., 2003).
20
The domain for our regional simulation is centered over CA with 159×149 grid cells and a spatial resolution of 12×12 km2. We use 27 vertical levels between the
sur-face and 50 hPa. Meteorological initial and boundary conditions are taken from the NCEP Eta North American Mesoscale (NAM) Analysis with analysis nudging for wind, temperature and humidity applied. Spatially and temporally (3-hourly) varying
chemi-25
ACPD
11, 3627–3661, 2011CO source contribution analysis
for California during ARCTAS-CARB
G. G. Pfister et al.
Title Page
Abstract Introduction
Conclusions References
Tables Figures
◭ ◮
◭ ◮
Back Close
Full Screen / Esc
Printer-friendly Version Interactive Discussion
Discussion
P
a
per
|
Dis
cussion
P
a
per
|
Discussion
P
a
per
|
Discussio
n
P
a
per
|
model was run at a spatial resolution of∼0.7◦ by 0.7◦ (T170) and the meteorological fields for driving MOZART were taken from NCEP (National Centers for Environmental Prediction) – Global Forecasting System (GFS) Analysis. WRF-Chem and MOZART both employ the MOZART-4 gas-phase chemical scheme fully described in Emmons et al. (2010). The aerosols in the global MOZART model include 12 bulk aerosol
com-5
pounds. In WRF-Chem the MOZART gas phase chemistry is linked to the bulk aerosol scheme GOCART (Goddard Chemistry Aerosol Radiation and Transport model; Chin et al., 2002). This configuration has recently been released in WRF-Chem V3.2.
Global and regional models are based on the same emission inventories where ap-plicable. Anthropogenic emissions are based upon the US EPA’s 2005 National
Emis-10
sions Inventory (NEI) (version 3) (S. McKeen, personal communication) and over CA are replaced by an emission inventory provided by CARB (J. Avise, personal communi-cation, 2010). NEI and CARB emissions are provided with hourly resolution separately for weekday, Saturday and Sunday and are mapped from the provided 4×4 km2 reso-lution on to the WRF-Chem domain.
15
The fire emissions inventory has been estimated using the FIre INventory from NCAR (FINN V1) (Wiedinmyer et al., 2006, 2010). FINN provides emissions on a per fire basis based on fire count information from the MODIS (Moderate Resolution Imaging Spectrometer) instrument. We apply a diurnal profile to the fire emissions fol-lowing recommendations by the Western Regional Air Partnership (WRAP; Report to
20
Project No. 178-6, July 2005), which peaks in the local afternoon and emits very little during nighttime. Fire emissions in MOZART are released at the lowest model level, while in WRF-Chem the online plume rise module (Freitas et al., 2007) is applied to distribute the fire emissions vertically. Biogenic emissions are calculated online fol-lowing the Model of Emissions of Gases and Aerosols from Nature (MEGAN)
(Guen-25
ACPD
11, 3627–3661, 2011CO source contribution analysis
for California during ARCTAS-CARB
G. G. Pfister et al.
Title Page
Abstract Introduction
Conclusions References
Tables Figures
◭ ◮
◭ ◮
Back Close
Full Screen / Esc
Printer-friendly Version Interactive Discussion
Discussion
P
a
per
|
Dis
cussion
P
a
per
|
Discussion
P
a
per
|
Discussio
n
P
a
per
|
The CO fire emissions over the regional domain for the time period 15 June–15 July amount to a total of 415 Gg C. The majority of the fires started after 20 June and oc-curred in the northern part of CA. The WRF-Chem plumerise module releases about half of the emissions within the planetary boundary layer and injects about half of them above. For comparison, anthropogenic emissions for the same time period are
esti-5
mated as 328 Gg C. The latter are released at the lowest model level, except for point sources where the stack height information is used to place them in the corresponding model level.
A number of synthetic CO tracers are included in the global and regional simulations. In the global model these include CO tracers for two different source types, fossil fuel
10
and biofuel sources (FF) and biomass burning sources (BB), for each of the follow-ing six regions: contiguous US, Alaska and Canada, Asia, Europe and North Africa, and Central America. In the regional model we include the following three CO do-main specific tracers: CO emitted from anthropogenic sources (COanthro), and wild-fires (COfire) within the regional domain, and CO produced photochemically within
15
the regional domain (COchem). In addition we use the global model CO and CO tracers to follow the transport of five CO tracers at the lateral boundaries CO: to-tal CO inflow (CObc), CO inflow from direct emissions from Asia (CObc asia), the US (CObc US), Central America (CObc cam) and Europe and Africa (CObc euraf).
The WRF-Chem simulations are started on 14 June, 00:00 UT. After about 5 days the
20
sum of the CO tracers (COanthro+COfire+CObc+COchem), which are set to cover all the CO sources, agrees to within 3% of the total CO at the surface. After 7 days the tracers are well spun up and the difference between the tracer sum and the total CO approaches zero. To avoid effects due to spin-up, all analysis that involves CO tracers is restricted to the time period from 20 June to 15 July.
ACPD
11, 3627–3661, 2011CO source contribution analysis
for California during ARCTAS-CARB
G. G. Pfister et al.
Title Page
Abstract Introduction
Conclusions References
Tables Figures
◭ ◮
◭ ◮
Back Close
Full Screen / Esc
Printer-friendly Version Interactive Discussion
Discussion
P
a
per
|
Dis
cussion
P
a
per
|
Discussion
P
a
per
|
Discussio
n
P
a
per
|
3 Model evaluation
We evaluate the model simulations by comparison to three different data sets. The first includes 1-minute measurements of CO onboard the DC-8 (version R8) and onboard the P-3 (version R2). During ARCTAS-CARB four science flights were conducted with the DC-8 on the following days: 18, 20, 22 and 24 June. During the 22 June flight
5
one segment was conducted off the coast of CA to measure pollution inflow across the Pacific entering the US West Coast (“Boundary Conditions Flight”). All other flights took place over CA. For model evaluation, we also include the segments over CA of the DC-8 transit flight on 26 June. The four P-3 flights took place over CA and were conducted on 22, 24, 26 and 28 June.
10
CO measurements on the DC-8 are derived from a diode laser spectrometer (Diskin et al., 2002; Sachse et al., 1987) and on the P-3 were conducted with the Carbon monOxide By Attenuated Laser Transmission (COBALT) instrument (Provencal et al., 2005). Intercomparison results for CO between the DC-8 and the P-3 during ARCTAS (report available from the Tropospheric Airborne Measurements Evaluation Panel
(TAb-15
MEP) at http://www.epa.gov/ttn/airs/airsaqs/detaildata/) recommends an uncertainty of 2% for DC-8 measurements and of 6% for the P-3 measurements.
The second observational data set used for the evaluation is the CO Total Column retrieval product from the Measurements of Pollution in the Troposphere (MOPITT) instrument aboard the NASA EOS/Terra satellite. The recently released MOPITT V4
20
retrievals (Deeter et al., 2010) are used for comparison of the regional and global model simulations. MOPITT V4 has been evaluated against CO in situ measurements acquired from aircraft from 2000 to 2007. The biases are estimated as less than 1% at the surface, 700 hPa, and 100 hPa, and a bias of about−6% at 400 hPa (Deeter et al., 2010).
25
ACPD
11, 3627–3661, 2011CO source contribution analysis
for California during ARCTAS-CARB
G. G. Pfister et al.
Title Page
Abstract Introduction
Conclusions References
Tables Figures
◭ ◮
◭ ◮
Back Close
Full Screen / Esc
Printer-friendly Version Interactive Discussion
Discussion
P
a
per
|
Dis
cussion
P
a
per
|
Discussion
P
a
per
|
Discussio
n
P
a
per
|
National Air Monitoring Stations (NAMS) networks. For the 15 June to 15 July time period there were 74 CO monitors in operation providing hourly CO measurements. All monitoring was conducted using US EPA reference or equivalent methods for mea-suring CO (see www.epa.gov/ttn/amtic) for details on these methods), and CO was reported in multiples of 100 ppbV, except for two monitors, which reported in multiples
5
of 10 ppbV. The surface monitoring data used in this study is available for download from the US EPA’s Air Quality System database (http://www.epa.gov/ttn/airs/airsaqs/ detaildata/).
3.1 Comparison to ARCTAS-CARB aircraft data
For comparison to the aircraft observations, we interpolate the modeled CO fields to
10
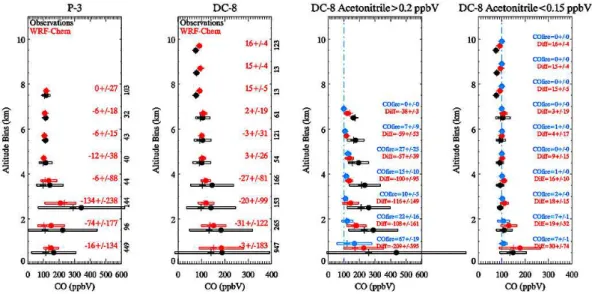
the time and location of the aircraft and average the observed and modeled CO fields over 1-km wide altitude bins. Evaluation results for WRF-Chem fields are listed in Table 1 and displayed in Fig. 1. We show average CO profiles for the P-3 and DC-8 for all collected data, and for the DC-8 also separate the data sets by fire influence using measurements of acetonitrile to determine observations that were significantly
15
influenced by fire emissions (acetonitrile>0.2 ppbV) and those with minor influence
from fires (0 ppbV<acetonitrile<0.15 ppbV) (Warneke et al., 2006).
The model gives a fairly good representation of the free tropospheric CO with mean biases generally less than∼20 ppbV. Towards the lower altitudes where local emissions and local transport gain importance, the absolute model bias increases and the model
20
generally under-predicts the observations. The variability in the observed CO strongly increases towards the lower altitudes reflecting the influence of local sources. The model captures the vertical gradient in the variability but generally underestimates the observed variability range.
Separating data by fire influence suggests that the model specifically underestimates
25
the CO emissions and concentrations from the CA wildfires. The model has a large negative bias for the fire influenced data set (−142±268 ppbV or−30±30%), while it
ACPD
11, 3627–3661, 2011CO source contribution analysis
for California during ARCTAS-CARB
G. G. Pfister et al.
Title Page
Abstract Introduction
Conclusions References
Tables Figures
◭ ◮
◭ ◮
Back Close
Full Screen / Esc
Printer-friendly Version Interactive Discussion
Discussion
P
a
per
|
Dis
cussion
P
a
per
|
Discussion
P
a
per
|
Discussio
n
P
a
per
|
or 21±39%). Part of the discrepancies might be related to the model missing fire
plumes in the first and/or incorrectly placing them in the latter data set. The overall increased concentrations of COfire in the fire-influenced data set compared to the very small concentrations of COfire in the no-fire data set, however, strongly suggest that the model mostly captures the timing and location of fire plumes well, and that the
5
model has an actual low bias in the CO concentrations related to fire plumes.
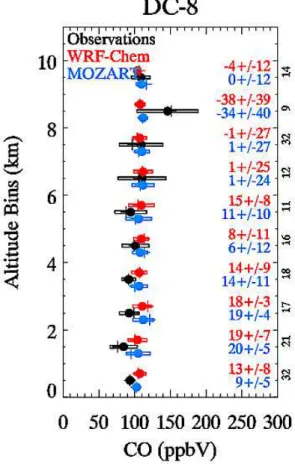
For evaluation of the global model boundary conditions and the CO inflow, we com-pare MOZART output of CO over the Pacific to the ARCTAS-CARB boundary condi-tions flight leg that was conducted with the DC-8 on 22 June. Results for MOZART and also WRF-Chem fields are shown in Fig. 2. This flight leg was not influenced by
10
fire plumes from CA. In agreement with the WRF-Chem evaluation of flight data not influenced by fires, we see in both MOZART and WRF-Chem a generally high bias compared to the aircraft data. Global and regional results are fairly similar as can be expected over a region that is strongly influenced by pollution inflow and little by re-gional and local sources. The model bias for the boundary conditions flight (Fig. 2)
15
and the flight measurements in the free troposphere over CA (Fig. 1) exhibit a bias of about 10–20 ppbV. This suggests that a sizeable part of the bias at the lowest al-titude level of 30 ppbV for non-fire impacted observations over CA (Fig. 1) is related to the background being overestimated. The plume measured at∼9 km is related to long-range transport from Asia (Pfister et al., 2010b) but is not captured in the model.
20
Further evaluation of the chemical boundary conditions for ARCTAS-CARB provided by the MOZART simulation is given in Pfister et al. (2010b).
3.2 Comparison to MOPITT column CO
To properly compare the CO retrievals from MOPITT to the model fields, the averaging kernel and a priori profile associated with each MOPITT retrieval has been applied to
25
ACPD
11, 3627–3661, 2011CO source contribution analysis
for California during ARCTAS-CARB
G. G. Pfister et al.
Title Page
Abstract Introduction
Conclusions References
Tables Figures
◭ ◮
◭ ◮
Back Close
Full Screen / Esc
Printer-friendly Version Interactive Discussion
Discussion
P
a
per
|
Dis
cussion
P
a
per
|
Discussion
P
a
per
|
Discussio
n
P
a
per
|
Only MOPITT retrievals for daytime are used, as they generally provide a higher infor-mational content compared to nighttime data (Deeter at al., 2010).
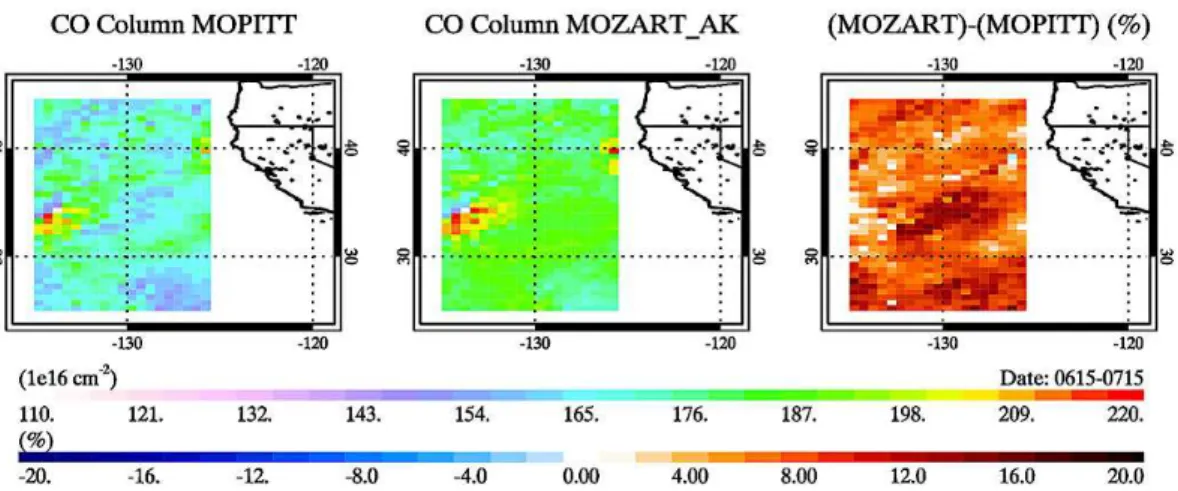
We evaluate the models over the entire time period 15 June–15 July 2008 since the total CO is not influenced by the spin-up time of the tracers. The conclusions remain the same as for the limited time period. Figure 3 shows the average spatial
distribu-5
tion of the MOPITT and WRF-Chem simulated CO columns and their differences. The CO columns are mostly representative of free tropospheric CO, which is where the sensitivity of the MOPITT retrievals is highest. Both MOPITT and WRF-Chem show a similar spatial pattern, with clearly enhanced CO columns over the region of the fires. In agreement with the conclusions derived from the comparison to aircraft data, we find
10
a high model bias over the ocean, but a low bias over land, where the underestimate in COfire likely contributes to the low bias. In comparing MOPITT retrievals over ocean and land it has to be considered that the retrieval sensitivity depends on the surface thermal contrast, which differs between ocean and land. Analysis of the MOPITT aver-aging kernels (not shown here) reveals that the comparison to MOPITT CO retrievals
15
mostly provides an evaluation of the modeled CO in the lower and middle troposphere over land, and of the modeled CO in the upper troposphere over the ocean.
Averaged over the domain shown here, which corresponds to the WRF-Chem domain with a 1.5 degrees intent on each border, the mean difference between WRF-Chem and MOPITT is (−5±14)×1016molec cm−2 (−2±7%) with a
correla-20
tion of 85%. Selecting only retrievals over the state of CA, the mean difference is (−19±17)×1016molec cm−2(−8±7%) and the correlation is 85%.
For the evaluation of the global model simulations, i.e. the chemical boundary con-ditions, we put the emphasis on the oceanic region to the West of the WRF-Chem do-main, which is the dominant inflow region for air entering the US West Coast (Fig. 4).
25
ACPD
11, 3627–3661, 2011CO source contribution analysis
for California during ARCTAS-CARB
G. G. Pfister et al.
Title Page
Abstract Introduction
Conclusions References
Tables Figures
◭ ◮
◭ ◮
Back Close
Full Screen / Esc
Printer-friendly Version Interactive Discussion
Discussion
P
a
per
|
Dis
cussion
P
a
per
|
Discussion
P
a
per
|
Discussio
n
P
a
per
|
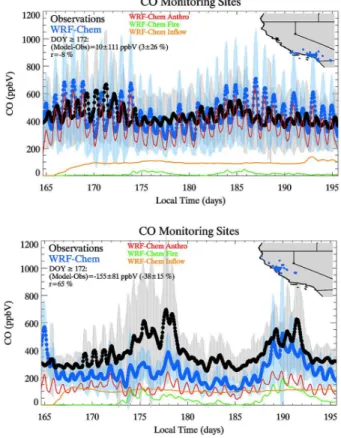
3.3 Comparison to monitoring data
The evaluation of WRF-Chem surface CO with observations at EPA monitoring sites is shown in Fig. 5. The majority of the sites (>90%) are stated as being located in either
urban or suburban environments. The model results are interpolated to the time and location of the observations and the model precision of the total CO concentrations
5
(not the CO tracers) is reduced to the lower resolution of the CO observations (mul-tiples of 100 ppbV). Evaluation of the model is impacted by the low resolution of the observations, but it nevertheless provides valuable information on surface CO. Since the temporal coverage of the observations is variable, especially between daytime and nighttime, we apply an 8-h running mean to derive average time series. We further
10
separate sites into monitoring sites located north and south of 36.5 N. Most fires oc-curred in the northern part of the state and this separation helps to distinguish between locations primarily influenced by anthropogenic sources and locations that are more strongly influenced by fires, respectively.
At the Southern CA locations the surface CO concentrations are about 400–
15
500 ppbV and the model represents the average CO concentrations well with an over-all high bias of 10±111 ppbV (3±26%). CO tracer contributions show a dominant
influence of anthropogenic sources and a small influence from fires. While uncertain-ties in emission estimates and model representativeness of local effects account for a main part of the differences, the overestimate of the CO background concentrations
20
(Sect. 3.1) likely explains some part of it as well.
For sites in Northern CA, the average observed CO concentrations before the fires started are<400 ppbV, but reach about 600 ppbV during intense fire episodes. The model replicates the timing of enhanced CO concentrations, but overall underestimates the CO concentrations with a low bias of −155±81 ppbV (−38±15%). CO tracer
25
ACPD
11, 3627–3661, 2011CO source contribution analysis
for California during ARCTAS-CARB
G. G. Pfister et al.
Title Page
Abstract Introduction
Conclusions References
Tables Figures
◭ ◮
◭ ◮
Back Close
Full Screen / Esc
Printer-friendly Version Interactive Discussion
Discussion
P
a
per
|
Dis
cussion
P
a
per
|
Discussion
P
a
per
|
Discussio
n
P
a
per
|
4 Source contribution analysis
Keeping model limitations in mind, we use the model CO tracers to analyze the source contributions of inflow and local emissions to surface CO as well as bound-ary layer (PBL) and free tropospheric (FT) CO loadings over CA. Uncertainties in the model simulations will be addressed in Sect. 5 through analysis of a set of sensitivity
5
simulations.
4.1 Average source contributions for surface CO over California
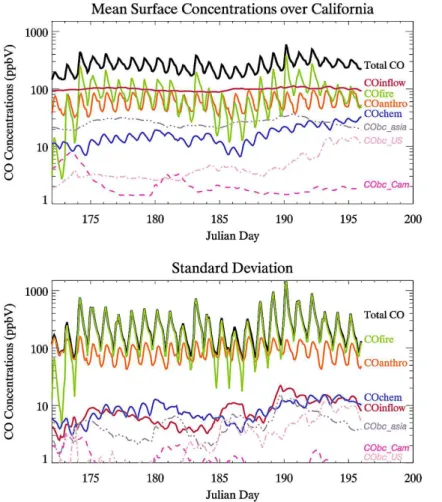
Figure 6 displays time series of surface concentrations of total CO and CO tracers av-eraged over the region of CA. Even though our analysis focuses on the time period after model spinup, we show here the results for the entire time period of the
WRF-10
Chem simulation to illustrate the buildup of the CO tracer with time. The average CO surface concentrations over CA are on the order of 200–300 ppbV and reach up to 500 ppbV after the fires begin. The concentrations show a strong diurnal cycle, which is also seen in the time series of COanthro and COfire reflecting diurnal variations in emissions, boundary layer dynamics and photochemistry. COanthro average
concen-15
trations contribute about 50–100 ppbV to surface CO with little day-to-day variability, and a spatial variability (expressed by the standard deviation) of around 100 ppbV. In comparison, the temporal and spatial variability in COfire is clearly higher. Average concentrations increase from near zero up to∼200 ppbV when the fires start and reach
nearly 400 ppbV during the most intense fire period reflecting the localized nature of
20
this source term. The spatial variability is about a factor of 2–3 higher than the average concentrations. COchem is a relatively small contribution to the total CO, but shows pronounced changes over time. The increase in COchem over the simulation period follows the temporal evolution of the fires suggesting that the increases over the time period are to some extent related to photochemical CO production from fire-emitted
25
ACPD
11, 3627–3661, 2011CO source contribution analysis
for California during ARCTAS-CARB
G. G. Pfister et al.
Title Page
Abstract Introduction
Conclusions References
Tables Figures
◭ ◮
◭ ◮
Back Close
Full Screen / Esc
Printer-friendly Version Interactive Discussion
Discussion
P
a
per
|
Dis
cussion
P
a
per
|
Discussion
P
a
per
|
Discussio
n
P
a
per
|
In contrast to the local sources, the inflow of CO (CObc) does not show a strong diurnal cycle, relatively less spatial variability and adds in the order of 100 ppbV to the surface CO. The temporal evolution shows events of elevated and reduced inflow varying over a range of about 20 ppbV. CObc mostly reflects a “CO background” where about half can be attributed to photochemically produced CO and half to CO from direct
5
emissions (Granier et al., 1999; Horowitz et al., 2003; Pfister et al., 2004). CObc asia is the major contributor to the CO inflow from direct emissions with up to∼35 ppbV and
correlates well with the temporal patterns of CObc. CObc cam and CObc US account for a smaller part of the CO inflow. Towards the end of the time period the CObc US tracer shows a clear increase. Analysis of the MOZART CO tracer transport (not shown
10
here) indicates that some of the pollution from within the domain is transported towards the West over the ocean and then circles back into the domain; this is particularly evident in the transport of US fire plume. CO from sources in Europe and Africa (not shown here) has a rather small influence and variability (on average 4±1 ppbV).
The contributions from the most relevant source terms are summarized in Table 2
15
and in Fig. 7. Frequency distributions are calculated for individual grid cells over the en-tire region of CA for the 2-hour model output over the time period 20 June–15 July 2008. The absolute and relative contributions are displayed. The largest single average contribution comes from CObc with a mean absolute concentration of 99±11 ppbV;
26±7 ppbV of this can be attributed to direct emissions from Asia. COanthro
concen-20
trations are 61±95 ppbV on average, which is smaller than the average contributions from COfire (84±294 ppbV). The domain specific sources show a much larger standard deviation compared to the inflow with COfire being the by far most variable term. This is expected because the inflow contributes more strongly to the overall background, while the local source strengths are much more dependent on their specific location.
25
ACPD
11, 3627–3661, 2011CO source contribution analysis
for California during ARCTAS-CARB
G. G. Pfister et al.
Title Page
Abstract Introduction
Conclusions References
Tables Figures
◭ ◮
◭ ◮
Back Close
Full Screen / Esc
Printer-friendly Version Interactive Discussion
Discussion
P
a
per
|
Dis
cussion
P
a
per
|
Discussion
P
a
per
|
Discussio
n
P
a
per
|
for the absolute contributions spanned by the 10–90th percentiles are 88–113 ppbV for CObc compared to 8–131 ppbV for COanthro, 1–172 ppbV for COfire and 5–32 ppbV for COchem.
Looking at the percentage contributions, the picture changes and the range for CO inflow becomes comparable to that for the regional tracers. On average, 53±21% of
5
total surface CO is related to pollution inflow and in some areas inflow accounts for over 80% of the total CO (the 90th percentile for CObc contributions is 81%) while in others it contributes less than 20% (the 10th percentile is 23%). Average contributions of local anthropogenic and fire emissions are 22±18% and 18±22%, respectively. According 10th and 90th percentile ranges are 4–50% and 1–52%. COchem is estimated to add
10
8±4% to the surface CO and only 1% of the data have a relative contribution of larger
than 19%. Average relative contributions for the individual inflow sources are estimated as 14±6% for CObc asia, 2±3% for CObc US (not shown), 2±1% for CObc euraf (not shown) and 1±2% for CObc cam (not shown).
4.2 Spatial distribution of surface source contributions 15
The surface spatial average concentrations over 20 June–15 July of total CO and CO tracers are displayed in Fig. 8. Note that the color scales are on a logarithmic scale and change between the graphs. Our analysis focuses mostly on CA, but the entire modeling domain is shown. To support interpretation of the results we also include a map of the domain topography.
20
The total surface CO distribution demonstrates high concentrations over large parts of CA with hotspots around Los Angeles and south of San Francisco as well as in the northern part of the state. The anthropogenic tracer shows that high concentrations around Los Angeles are related to local emissions from fossil fuel and biofuel sources with elevated concentrations also seen around the Bay area and throughout the
Cen-25
ACPD
11, 3627–3661, 2011CO source contribution analysis
for California during ARCTAS-CARB
G. G. Pfister et al.
Title Page
Abstract Introduction
Conclusions References
Tables Figures
◭ ◮
◭ ◮
Back Close
Full Screen / Esc
Printer-friendly Version Interactive Discussion
Discussion
P
a
per
|
Dis
cussion
P
a
per
|
Discussion
P
a
per
|
Discussio
n
P
a
per
|
plumes towards the east and south-east. High values for COchem are found around re-gions with high local emissions. CO precursors are transported during the time it takes to chemically produce CO, which causes the spatial patterns to be more widespread around the emission sources.
Boundary conditions have an impact over large parts of CA, with a major contribution
5
from COasia. High CObc US values near the southern border of the domain have to be interpreted with caution. The regions for the MOZART CO tracers were chosen by applying rectangular shaped area selections and the separation between the US and Central America domains was set at 30 N meaning that emissions from Northern Mexico are assigned to CObc US. The topography over CA causes complex horizontal
10
and vertical transport patterns that mix air from higher altitudes to the surface. CObc has largest values in the Northern part of the state and around and inland of the Bay Area and into the Central Valley. Areas of high CObc concentrations are not necessarily correlated with regions of high elevations even though the latter are typically considered as representative for inflow. Rather we find that the high elevations of the Sierra Nevada
15
act as a barrier diverting inflow from the West more strongly towards the north and north-east.
4.3 CO average contributions for the boundary layer and the free troposphere
In addition to the previous analysis of surface CO, we also examine the CO tracer bur-dens integrated over the PBL (surface to top of the modeled PBL height) and integrated
20
over the FT (top of the modeled PBL height to 6 km). We choose here an upper limit of 6 km, but the general conclusions remain the same if we instead move the upper bound to 8 km or 10 km.
The daily average burden over CA for the time period 20 June–15 July is 0.020 Tg CO for the PBL and 0.19 Tg CO for the FT. Of this, the inflow of CO makes up for 52% of
25
ACPD
11, 3627–3661, 2011CO source contribution analysis
for California during ARCTAS-CARB
G. G. Pfister et al.
Title Page
Abstract Introduction
Conclusions References
Tables Figures
◭ ◮
◭ ◮
Back Close
Full Screen / Esc
Printer-friendly Version Interactive Discussion
Discussion
P
a
per
|
Dis
cussion
P
a
per
|
Discussion
P
a
per
|
Discussio
n
P
a
per
|
FT, anthropogenic emissions explain 17% in the PBL compared to 6% in the FT and COchem contributes 8% in the PBL versus 6% in the FT.
The burden amounts can have significant day-to-day variability. The total CO burden for individual days varies between about 0.015–0.025 Tg CO in the PBL and between 0.16–0.25 Tg CO in the FT with COfire being a major driver of this variability (COfire
5
burdens range from 0.0003–0.009 Tg CO in the PBL and from 0.001–0.07 Tg CO in the FT). COanthro contributions for the PBL are between 12–21% and between 3–10% for FT. COfire can be as low as 1–2% in the PBL and FT and as high as 36% in the PBL and as high as 28% in the FT. The range spanned by COchem is about 5–13% in the PBL and 2–12% in the FT. The contributions due to inflow are in the range of 40–74% in
10
the PBL and 55–92% in the FT. Contributions associated with COasia range between 9–17% for the PBL and between 13–24% in the FT.
The calculated burden amounts are influenced by the actual CO loadings but also by varying heights of the PBL. To account for the latter and allow a more direct comparison to the surface mixing ratio, we further provide statistics for the average mixing ratios
15
(column of CO divided by the air column). The average mixing ratios in the PBL over CA are of similar order as the values estimated for surface CO (Table 2): 53±80 ppbV for
COanthro, 70±208 ppbV for COfire, 16±11 ppbV for COchem, 99±11 ppbV for CObc. In comparison, COanthro in the FT is reduced to 8±9 ppbV, COfire to 18±31 ppbV, and COchem to 8±7 ppb. The CObc average mixing ratios of 96±7 ppbV in the FT is
20
similar to the PBL value. The total CO mixing ratio, however, is significantly lower in the FT (130±37 ppbV) than in the PBL (237±223 ppbV) explaining the higher relative influence of CObc in the FT.
5 Sensitivity simulations
Uncertainties in the CO emissions, as well as the transport, will affect the distribution of
25
ACPD
11, 3627–3661, 2011CO source contribution analysis
for California during ARCTAS-CARB
G. G. Pfister et al.
Title Page
Abstract Introduction
Conclusions References
Tables Figures
◭ ◮
◭ ◮
Back Close
Full Screen / Esc
Printer-friendly Version Interactive Discussion
Discussion
P
a
per
|
Dis
cussion
P
a
per
|
Discussion
P
a
per
|
Discussio
n
P
a
per
|
schemes. While a comprehensive analysis of all possible sources of uncertainty is be-yond the scope of this work, we look into changes in the CO distribution for two likely modeling scenarios. These additional simulations are targeted towards examining the sensitivity of tracer contributions to changes in fire and to changes in anthropogenic emissions, respectively.
5
In the first simulation (SENS fire), we changed the treatment of fire emissions from having them distributed vertically through the online plumerise module to emitting them at the lowest model level only. In a second simulation (SENS anthro) we modified the anthropogenic emissions from using the CARB emission inventory over CA to using the EPA NEI-2005 inventory for the entire modeling domain. Total anthropogenic
emis-10
sions in the latter simulation increase from 328 Gg CO to 391 Gg C. The higher total emissions in the NEI inventory are to some part explained by the fact that it is targeted for the year 2005, while the CARB inventory has been projected to the year 2008 re-flecting reductions in emissions over these years.
The evaluation results for the sensitivity simulations are compared to the reference
15
run in Table 1. When compared to the DC-8 aircraft measurements, the average bias for the no-fire data selection for SENS fire is similar to the reference simulation, as expected, but increases to 39±79 ppbV for SENS anthro indicating a high bias in the NEI EPA emissions inventory. This demonstrates the importance of considering year-specific emission inventories also for anthropogenic sources.
20
For the fire impacted data set, both SENS fire and SENS anthro show a reduced mean bias of−114±247 ppbV and−120±281 ppbV, respectively. This however does not conclude a better performance in either of the sensitivity simulations over the ref-erence simulation. Considering the likely low bias in fire emissions, the improved bias in SENS fire is assumed to be due to a combination of an increase in model CO at
25
ACPD
11, 3627–3661, 2011CO source contribution analysis
for California during ARCTAS-CARB
G. G. Pfister et al.
Title Page
Abstract Introduction
Conclusions References
Tables Figures
◭ ◮
◭ ◮
Back Close
Full Screen / Esc
Printer-friendly Version Interactive Discussion
Discussion
P
a
per
|
Dis
cussion
P
a
per
|
Discussion
P
a
per
|
Discussio
n
P
a
per
|
These assumptions are also supported by comparison to the surface observations. Compared to the reference simulation, SENS fire shows a small increase in the com-parison to sites in Southern CA (20±113 ppbV), but a clearly improved bias for North-ern CA sites (−103±97 ppbV). SENS anthro, in contrast, clearly overestimates the
CO concentrations in Southern CA (224±120 ppbV) while at the same time showing
5
a reduced bias in Northern CA (−64±90 ppbV). The comparison to MOPITT over CA yields overall similar results for the three simulations: a bias of (−19±17)×1016cm−2
(−8±7%) for the reference run and of (−17±18)×1016cm−2(−7±7%) and (−16±17)×
1016cm−2(−7±7%) for SENS fire and SENS anthro, respectively.
Table 2 compares the total CO and CO tracer average mixing ratios between the
10
reference and the sensitivity simulations. Releasing the fire emissions at the surface increases COfire mixing ratios (and owing to the first-order linearity in CO chemistry also total CO mixing ratios) on average by 82 ppbV at the surface and by 67 ppbV throughout the PBL. The mean relative contributions for COfire increase from 18±22%
to 24±26% at the surface and from 17±21% to 23±26% in the PBL. We also
es-15
timate a small increase in the FT (+7 ppbV or a change in the relative contribution from 11±13% to 12±16%). The main part of this FT increase might be explained by
an increased residence time of CO in the domain in SENS fire. When emissions are directly placed at higher altitudes, where the winds are more efficient in transporting them over large distances, they will move outside of the modeling domain faster
com-20
pared to when they are released at the surface, where they first have to be lofted to higher altitudes before being transported by large-scale winds.
Changing the anthropogenic emissions (SENS anthro) increases the average CO mixing ratio by 26 ppbV at the surface, by 23 ppbV in the PBL and by 3 ppbV in the FT. The average relative contribution of COanthro increases by about 4% at the surface
25
and the PBL and by about 2% in the FT. The tail of the COanthro distribution shows a clear increase with 10% of the surface data>200 ppbV in SENS anthro compared to
ACPD
11, 3627–3661, 2011CO source contribution analysis
for California during ARCTAS-CARB
G. G. Pfister et al.
Title Page
Abstract Introduction
Conclusions References
Tables Figures
◭ ◮
◭ ◮
Back Close
Full Screen / Esc
Printer-friendly Version Interactive Discussion
Discussion
P
a
per
|
Dis
cussion
P
a
per
|
Discussion
P
a
per
|
Discussio
n
P
a
per
|
6 Summary
We use the regional Weather Research and Forecasting Model with Chemistry (WRF-Chem V3.2) to examine CO contributions over California (CA) during the ARCTAS-CARB mission. We introduce model tracers into WRF-Chem for tagging CO concen-trations originating from individual sources. To our knowledge this is the first time that
5
the concept of CO tracers, which is commonly used in global models, has been applied in a regional model.
The CO budget over CA for the time period 20 June–15 July 2008 is estimated from the analysis of CO tracer fields in the regional model simulations in combination with global model results, the latter providing the lateral boundary conditions to WRF-Chem.
10
CO tracers in the regional model include tracers for anthropogenic and fire emissions and photochemical CO production from within the regional domain, as well as CO transported into the regional domain from the lateral boundaries. CO tracers from the global model are used to further split the CO inflow tracer into CO originating from direct emissions in Asia, the contiguous US, Central America, and Europe and Africa.
15
We use aircraft measurements conducted during the ARCTAS-CARB mission, satel-lite retrievals from MOPITT and ground-based observations at monitoring stations to evaluate the model’s ability to capture the actual CO distribution and variability. By combining these different types of data sets in the evaluation and including informa-tion from the model tracers in the interpretainforma-tion of the results, we conclude that the
20
model overall predicts the observed CO fields well, but points towards an underesti-mate of CO from the fires in Northern California, which had a strong influence during the study period, and towards a smaller overestimate of CO from pollution inflow and local anthropogenic sources.
The largest single source term to surface CO over CA is due to pollution
in-25
ACPD
11, 3627–3661, 2011CO source contribution analysis
for California during ARCTAS-CARB
G. G. Pfister et al.
Title Page
Abstract Introduction
Conclusions References
Tables Figures
◭ ◮
◭ ◮
Back Close
Full Screen / Esc
Printer-friendly Version Interactive Discussion
Discussion
P
a
per
|
Dis
cussion
P
a
per
|
Discussion
P
a
per
|
Discussio
n
P
a
per
|
(84±294 ppbV) reflecting the large effect of the intense fire season in CA in early
sum-mer 2008 on the atmospheric composition. In relative terms, CO inflow accounts for 53±21% of the surface CO and about 10% of the time more than 80% of the surface CO over CA is due to inflow. The average relative contributions of local anthropogenic and fire emissions are 22±18% and 18±22%, respectively, and there is a 10%
occur-5
rence that at least half of the surface CO over CA is due to either of these sources. Photochemical CO production within the domain accounts for 8±4% of the surface
CO. In contrast, in the free troposphere (from the top of the boundary layer to 6 km), the relative contributions for CO from inflow increases to 78±16%, while the contribu-tion of sources within the domain decreases: 6±5% for CO from local anthropogenic
10
sources, 11±13% for CO from fires and 6±4% from photochemical production within
the domain.
A sensitivity simulation, where the fire emissions area released at the lowest model level rather than being treated in a plume rise module increases the average surface concentrations of the CO fire tracer over CA from 84±294 ppbV to 168±601 ppbV.
15
A second sensitivity simulation in which the anthropogenic emissions over CA are changed from the year specific inventory developed by CARB to the US EPA NEI in-ventory for 2005 increases the average surface concentrations of the anthropogenic CO tracer from 61±95 ppbV to 87±149 ppbV.
The results of this study demonstrate a strong contribution of many different types of
20
emission sources on surface air quality over CA and the large variability on temporal and spatial scales associated with each of the source terms. We further demonstrate the importance of considering pollution from within the region as well as pollution com-ing from outside sources in analyzcom-ing California’s air quality. The fires in early sum-mer 2008 had an extreme influence over large parts of CA and neighboring states and
25
ACPD
11, 3627–3661, 2011CO source contribution analysis
for California during ARCTAS-CARB
G. G. Pfister et al.
Title Page
Abstract Introduction
Conclusions References
Tables Figures
◭ ◮
◭ ◮
Back Close
Full Screen / Esc
Printer-friendly Version Interactive Discussion
Discussion
P
a
per
|
Dis
cussion
P
a
per
|
Discussion
P
a
per
|
Discussio
n
P
a
per
|
Acknowledgements. The authors like to acknowledge Stu McKeen (NOAA ESRL) for support in using the EPA-NEI emissions inventory. We further acknowledge Simone Tilmes and Merritt Deeter for providing valuable input to the manuscript. Acetonitrile measurements were sup-ported by the Austrian Research Promotion Agency (FFG-ALR) and the Tiroler Zukunftstiftung and carried out with the help/support of T. Mikoviny, M. Graus, A. Hansel and T. D. Maerk. The 5
research was supported by NASA grants NNX10AH45G, NNX08AD22G and NNX07AL57G. NCAR is operated by the University Corporation of Atmospheric Research under sponsorship of the National Science Foundation.
References
Arellano, A. F., Kasibhatla, P. S., Giglio L., van der Werf, G. R., and Randerson, J. T.: Top-10
down estimates of global CO sources using MOPITT measurements, Geophys. Res. Lett., 31, L01104, doi:10.1029/2003GL018609, 2004.
Arellano, A. F., Kasibhatla, P. S., Giglio, L., van der Werf, G. R., Randerson, J. T., and Collatz, G. J.: Time-dependent inversion estimates of global biomass-burning CO emissions using Measurement of Pollution in the Troposphere (MOPITT) measurements, J. Geophys. Res., 15
111, D09303, doi:10.1029/2005JD006613, 2006.
Bey, I., Jacob, D. J. , Yantosca, R. M., Logan, J. A., Field, B. D. , Fiore, A. M., Li, Q., Liu, H. Y., Mickley, L. J., and Schultz, M. G.: Global modeling of tropospheric chemistry with assimilated meteorology: Model description and evaluation, J. Geophys. Res., 106, 23073– 23095, 2001.
20
Bougeault, P. and Lacarrere, P.: Parameterisation of Orography-Induced Turbulence in a Mesobeta-Scale Model, Mon. Wea. Rev., 117, 1872–1890, 1989.
Chin, M., Ginoux, P., Kinne, S., Torres, O., Holben, B. N., Duncan, B. N., Martin, R. V., Logan, J. A., Higurashi, and J. Nakajima, T.: Tropospheric aerosol optical thickness from the GOCART model and comparisons with satellite and sunphotometer measurements, J. Atmos. Sci., 59, 25
461–483, 2002.
ACPD
11, 3627–3661, 2011CO source contribution analysis
for California during ARCTAS-CARB
G. G. Pfister et al.
Title Page
Abstract Introduction
Conclusions References
Tables Figures
◭ ◮
◭ ◮
Back Close
Full Screen / Esc
Printer-friendly Version Interactive Discussion
Discussion
P
a
per
|
Dis
cussion
P
a
per
|
Discussion
P
a
per
|
Discussio
n
P
a
per
|
product: Algorithm enhancements, validation, and long-term stability, J. Geophys. Res., 115, D07306, doi:10.1029/2009JD013005, 2010.
Diskin, G. S., Podolske, J. R., Sachse, G. W., and Slate, T. A.: Open-Path Airborne Tunable 15 Diode Laser Hygrometer, in: Diode Lasers and Applications in Atmospheric Sensing, edited by: Fried, A., SPIE Proceedings, 4817, 196–204, 2002.
5
Duncan, B. N., Logan, J. A., Bey, I., Megretskaia, I. A., Yantosca, R. M., Novelli, P. C., Jones, N. B., and Rinsland, C. P.: Global budget of CO, 1988–1997: Source estimates and validation with a global model, J. Geophys. Res., 112, D22301, doi:10.1029/2007JD008459, 2007. Ek, M. B., Mitchell, K. E., Lin, Y., Rogers, E., Grunmann, P., Koren, V., Gayno, G., and Tarpley,
J. D.: Implementation of Noah land surface model advances in the National Centers for 10
Environmental Prediction operational mesoscale Eta model, J. Geophys. Res., 108(D22), 8851, doi:10.1029/2002JD003296, 2003.
Emmons, L. K., Walters, S., Hess, P. G., Lamarque, J.-F., Pfister, G. G., Fillmore, D., Granier, C., Guenther, A., Kinnison, D., Laepple, T., Orlando, J., Tie, X., Tyndall, G., Wiedinmyer, C., Baughcum, S. L., and Kloster, S.: Description and evaluation of the Model for Ozone 15
and Related chemical Tracers, version 4 (MOZART-4), Geosci. Model Dev., 3, 43–67, doi:10.5194/gmd-3-43-2010, 2010.
Fisher, J. A., Jacob, D. J., Purdy, M. T., Kopacz, M., Le Sager, P., Carouge, C., Holmes, C. D., Yantosca, R. M., Batchelor, R. L., Strong, K., Diskin, G. S., Fuelberg, H. E., Holloway, J. S., Hyer, E. J., McMillan, W. W., Warner, J., Streets, D. G., Zhang, Q., Wang, Y., and Wu, 20
S.: Source attribution and interannual variability of Arctic pollution in spring constrained by aircraft (ARCTAS, ARCPAC) and satellite (AIRS) observations of carbon monoxide, Atmos. Chem. Phys., 10, 977–996, doi:10.5194/acp-10-977-2010, 2010.
Freitas, S. R., Longo, K. M., Chatfield, R., Latham, D., Silva Dias, M. A. F., Andreae, M. O., Prins, E., Santos, J. C., Gielow, R., and Carvalho Jr., J. A.: Including the sub-grid scale 25
plume rise of vegetation fires in low resolution atmospheric transport models, Atmos. Chem. Phys., 7, 3385–3398, doi:10.5194/acp-7-3385-2007, 2007.
Granier, C., Petron, G., Muller, J.-F., and Brasseur, G.: The impact of natural and anthropogenic hydrocarbons on the tropospheric budget of carbon monoxide, Atmos. Environ., 34, 5255– 5270, doi:10.1016/S1352-2310(00)00299-5, 2000.
30
Granier, C., Mueller, J. F., Petron, G., and Brasseur, G.: A three dimensional study of the global CO budget, Global Change Science, 1, 255–261, 1999.
ACPD
11, 3627–3661, 2011CO source contribution analysis
for California during ARCTAS-CARB
G. G. Pfister et al.
Title Page
Abstract Introduction
Conclusions References
Tables Figures
◭ ◮
◭ ◮
Back Close
Full Screen / Esc
Printer-friendly Version Interactive Discussion
Discussion
P
a
per
|
Dis
cussion
P
a
per
|
Discussion
P
a
per
|
Discussio
n
P
a
per
|
Eder, B.: Fully coupled online chemistry within the WRF model, Atmos. Environ., 39, 6957– 6975, 2005.
Guenther, A., Karl, T., Harley, P., Wiedinmyer, C., Palmer, P. I., and Geron, C.: Estimates of global terrestrial isoprene emissions using MEGAN (Model of Emissions of Gases and Aerosols from Nature), Atmos. Chem. Phys., 6, 3181–3210, doi:10.5194/acp-6-3181-2006, 5
2006.
Heald, C. L., Jacob, D. J, Jones, D. B. A., Palmer, P. I., Logan, J. A., Streets, D. G., Sachse, G. W., Gille, J. C., Hoffman, R. N., and Nehrkorn, T.: Comparative inverse analysis of satellite (MOPITT) and aircraft (TRACE-P) observations to estimate Asian sources of carbon monox-ide, J. Geophys. Res., 109, D15S04, doi:10.1029/2004JD005185, 2004.
10
Horowitz, L. W., Walters, S., Mauzarall, D. L., Emmons, L. K., Rasch, P. J., Granier, C., Tie, X., Lamarque, J.-F., Schultz, M. G., Tyndall, G. S., Orlando, J. J., and Brasseur, G. P.: A global simulation of tropospheric ozone and related tracers: Description and evaluation of MOZART, version 2, J. Geophys. Res., 108(D24), 4784, doi:10.1029/2002JD002853, 2003. Jacob, D. J., Crawford, J. H., Maring, H., Clarke, A. D., Dibb, J. E., Emmons, L. K., Ferrare, R. 15
A., Hostetler, C. A., Russell, P. B., Singh, H. B., Thompson, A. M., Shaw, G. E., McCauley, E., Pederson, J. R., and Fisher, J. A.: The Arctic Research of the Composition of the Tropo-sphere from Aircraft and Satellites (ARCTAS) mission: design, execution, and first results, Atmos. Chem. Phys., 10, 5191–5212, doi:10.5194/acp-10-5191-2010, 2010.
Kopacz, M., Jacob, D. J., Fisher, J. A., Logan, J. A., Zhang, L., Megretskaia, I. A., Yantosca, 20
R. M., Singh, K., Henze, D. K., Burrows, J. P., Buchwitz, M., Khlystova, I., McMillan, W. W., Gille, J. C., Edwards, D. P., Eldering, A., Thouret, V., and Nedelec, P.: Global esti-mates of CO sources with high resolution by adjoint inversion of multiple satellite datasets (MOPITT, AIRS, SCIAMACHY, TES), Atmos. Chem. Phys., 10, 855–876, doi:10.5194/acp-10-855-2010, 2010.
25
Liang, Q., Jaegle, L., Jaffe, D. A., Weiss-Penzias, P., Heckman, A., and Snow, J. A.: Long-range transport of Asian pollutionto the northeast Pacific: Seasonal variations and transport pathways of carbon monoxide, J. Geophys. Res., 109, D23S07, doi:10.1029/2003JD004402, 2004.
Palmer, P. I., Jacob, D. J., Jones, D. B. A., Heald, C. L., Yantosca, R. M., Logan, J. A., 30
ACPD
11, 3627–3661, 2011CO source contribution analysis
for California during ARCTAS-CARB
G. G. Pfister et al.
Title Page
Abstract Introduction
Conclusions References
Tables Figures
◭ ◮
◭ ◮
Back Close
Full Screen / Esc
Printer-friendly Version Interactive Discussion
Discussion
P
a
per
|
Dis
cussion
P
a
per
|
Discussion
P
a
per
|
Discussio
n
P
a
per
|
P ´etron, G., Granier, C., Khattatov, B., Yudin, V., Lamarque, J.-F., Emmons, L., Gille, J., and Edwards, D. P.: Monthly CO surface sources inventory based on the 2000–2001 MOPITT satellite data, Geophys. Res. Lett., 31, L21107, doi:10.1029/2004GL020560, 2004.
Pfister, G., Petron, G., Emmons, L. K., Gille, J. C., Edwards, D. P., Lamarque, J.-F., Attie, J.-L., Granier, C., and Novelli, P. C.: Evaluation of CO simulations and the analysis of the CO 5
budget for Europe, J. Geophys. Res., 109, D19304, doi:10.1029/2004JD004691, 2004. Pfister, G., Hess, P. G., Emmons, L. K., Lamarque, J.-F., Wiedinmyer, C., Edwards, D. P.,
Petron, G., Gille, J. C., Sachse, G. W.: Constraints on Emissions for the Alaskan Wildfires 2004 using Data Assimilation and Inverse Modeling of MOPITT CO, Geophys. Res. Lett., 32(11), L11809, doi:10.1029/2005GL022995, 2005.
10
Pfister, G. G., Emmons, L. K., Edwards, D. P., Arellano, A., G Sachse, and Campos, T.: Vari-ability of springtime transpacific pollution transport during 2000–2006: the INTEX-B mission in the context of previous years, Atmos. Chem. Phys., 10, 1345–1359, doi:10.5194/acp-10-1345-2010, 2010a.
Pfister, G. G., Parrish, D., Worden, H., Emmons, L. K., Edwards, D. P., Wiedinmyer, C., Diskin, 15
G. S., Huey, G., Oltmans, S. J., Thouret, V., Weinheimer, A., and Wisthaler, A.: Characteriz-ing summertime chemical boundary conditions for airmasses enterCharacteriz-ing the US West Coast, Atmos. Chem. Phys. Discuss., 10, 28909–28962, doi:10.5194/acpd-10-28909-2010, 2010b. Provencal, R., Gupta, M., Owano, T. G, Baer, D. S., Ricci, K. N., O’Keefe, A., and Podolske, J.
R.: Cavity-enhanced quantum-cascade laser-based instrument for carbon monoxide mea-20
surements, Appl. Opt. 44, 6712–6717, 2005.
Sachse, G. W., Hill, G. F., Wade, L. O., and Perry, M. G.: Fast response, high precision carbon monoxide sensor using a tunable diode laser absorption technique, J. Geophys. Res., 92, 2071–2081, 1987.
Staudt, A. C., Jacob, D. J., Logan, J. A., Bachiochi, D., Krishnamurti, T. N., and Sachse, G. 25
W.: Continental sources, transoceanic transport, and interhemispheric exchange of carbon monoxide over the Pacific, J. Geophys. Res., 106(D23), 32571–32590, 2001.
Warneck, P.: Chemistry of the Natural Atmosphere, Academic, San Diego, CA, 927 pp., 2000. Warneke, C., de Gouw, J. A., Stohl, A., Cooper, O. R., Goldan, P. D., Kuster, W. C., Holloway,
J. S., Williams, E. J., Lerner, B. M., McKeen, S. A., Trainer, M., Fehsenfeld, F. C., Atlas, E. 30
ACPD
11, 3627–3661, 2011CO source contribution analysis
for California during ARCTAS-CARB
G. G. Pfister et al.
Title Page
Abstract Introduction
Conclusions References
Tables Figures
◭ ◮
◭ ◮
Back Close
Full Screen / Esc
Printer-friendly Version Interactive Discussion
Discussion
P
a
per
|
Dis
cussion
P
a
per
|
Discussion
P
a
per
|
Discussio
n
P
a
per
|
Wiedinmyer, C., Quayle, B., Geron, C., Belote, A., McKenzie, D., Zhang, X., O’Neill, and S., Wynne, K. K..: Estimating emissions from fires in North America for air quality monitoring, Atmos. Environ., 40, 3419–3432, 2006.
Wiedinmyer, C., Akagi, S. K., Yokelson, R. J., Emmons, L. K., Al-Saadi, J. A., Orlando, J. J., and Soja, A. J.: The Fire INventory from NCAR (FINN) – a high resolution global model 5
to estimate the emissions from open burning, Geosci. Model Dev. Discuss., 3, 2439–2476, doi:10.5194/gmdd-3-2439-2010, 2010.
Yashiro, H., Sugawara, S., Sudo, K., Aoki, S., and Nakazawa, T.: Temporal and spatial varia-tions of carbon monoxide over the western part of the Pacific Ocean, J. Geophys. Res., 114, D08305, doi:10.1029/2008jd010876, 2009.
ACPD
11, 3627–3661, 2011CO source contribution analysis
for California during ARCTAS-CARB
G. G. Pfister et al.
Title Page Abstract Introduction Conclusions References Tables Figures ◭ ◮ ◭ ◮ Back Close
Full Screen / Esc
Printer-friendly Version Interactive Discussion Discussion P a per | Dis cussion P a per | Discussion P a per | Discussio n P a per |
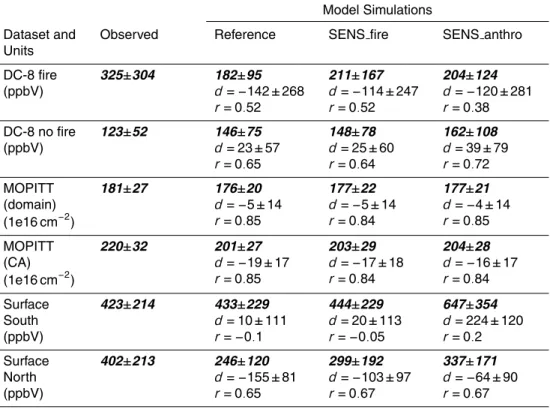
Table 1. Evaluation statistics for the three different WRF-Chem simulations. Listed are mean observed and modeled concentrations (italic bold), mean bias (d) and correlation coefficient (r).
Model Simulations
Dataset and Units
Observed Reference SENS fire SENS anthro
DC-8 fire (ppbV)
325±304 182±95
d=−142±268 r=0.52
211±167
d=−114±247 r=0.52
204±124
d=−120±281 r=0.38
DC-8 no fire (ppbV)
123±52 146±75
d=23±57 r=0.65
148±78
d=25±60 r=0.64
162±108
d=39±79 r=0.72
MOPITT (domain) (1e16 cm−2
)
181±27 176±20
d=−5±14 r=0.85
177±22
d=−5±14 r=0.84
177±21
d=−4±14 r=0.85
MOPITT (CA) (1e16 cm−2)
220±32 201±27
d=−19±17 r=0.85
203±29
d=−17±18 r=0.84
204±28
d=−16±17 r=0.84
Surface South (ppbV)
423±214 433±229
d=10±111 r=−0.1
444±229
d=20±113 r=−0.05
647±354
d=224±120 r=0.2
Surface North (ppbV)
402±213 246±120
d=−155±81 r=0.65
299±192
d=−103±97 r=0.67
337±171
ACPD
11, 3627–3661, 2011CO source contribution analysis
for California during ARCTAS-CARB
G. G. Pfister et al.
Title Page
Abstract Introduction
Conclusions References
Tables Figures
◭ ◮
◭ ◮
Back Close
Full Screen / Esc
Printer-friendly Version Interactive Discussion
Discussion
P
a
per
|
Dis
cussion
P
a
per
|
Discussion
P
a
per
|
Discussio
n
P
a
per
|
Table 2.Source contribution statistics for the three different WRF-Chem simulations.
Model Simulation
Reference SENS fire SENS anthro Average Mixing Ratios in (ppbV)
Surface Mixing Ratio Total CO 260±308 343±608 286±324 COanthro 61±95 61±95 87±149 COfire 84±294 168±601 84±294 COchem 16±11 17±12 15±10 CObc 99±11 99±11 99±11 COasia 26±7 26±7 26±7 PBL Mixing Ratio Total CO 237±223 305±431 260±239 COanthro 53±80 53±80 76±125 COfire 70±208 137±424 70±208 COchem 16±11 17±12 15±10 CObc 99±11 99±11 99±11 COasia 26±7 26±7 26±7 FT Mixing Ratio Total CO 130±37 137±56 133±38 COanthro 8±9 8±9 11±13 COfire 18±31 25±50 18±31 COchem 8±7 8±7 8±6 CObc 96±7 96±7 96±7 COasia 25±5 25±5 25±5 Average Mixing Ratio Contributions (%)
ACPD
11, 3627–3661, 2011CO source contribution analysis
for California during ARCTAS-CARB
G. G. Pfister et al.
Title Page
Abstract Introduction
Conclusions References
Tables Figures
◭ ◮
◭ ◮
Back Close
Full Screen / Esc
Printer-friendly Version Interactive Discussion
Discussion
P
a
per
|
Dis
cussion
P
a
per
|
Discussion
P
a
per
|
Discussio
n
P
a
per
|