Markers in Sweet Orange (
Citrus sinensis
)
Manosh Kumar Biswas1, Qiang Xu1, Christoph Mayer2, Xiuxin Deng1*
1Key Laboratory of Horticultural Plant Biology of Ministry of Education (MOE), Huazhong Agricultural University, Wuhan, Hubei, P.R. China,2Forschungsmuseum Alexander Koenig, Bonn, Germany
Abstract
Sweet orange (Citrus sinensis) is one of the major cultivated and most-consumed citrus species. With the goal of enhancing
the genomic resources in citrus, we surveyed, developed and characterized microsatellite markers in the <347 Mb sequence assembly of the sweet orange genome. A total of 50,846 SSRs were identified with a frequency of 146.4 SSRs/ Mbp. Dinucleotide repeats are the most frequent repeat class and the highest density of SSRs was found in chromosome 4. SSRs are non-randomly distributed in the genome and most of the SSRs (62.02%) are located in the intergenic regions. We found that AT-rich SSRs are more frequent than GC-rich SSRs. A total number of 21,248 SSR primers were successfully developed, which represents 89 SSR markers per Mb of the genome. A subset of 950 developed SSR primer pairs were synthesized and tested by wet lab experiments on a set of 16 citrus accessions. In total we identified 534 (56.21%) polymorphic SSR markers that will be useful in citrus improvement. The number of amplified alleles ranges from 2 to 12 with an average of 4 alleles per marker and an average PIC value of 0.75. The newly developed sweet orange primer sequences, theirin silicoPCR products, exact position in the genome assembly and putative function are made publicly available. We present the largest number of SSR markers ever developed for a citrus species. Almost two thirds of the markers are transferable to 16 citrus relatives and may be used for constructing a high density linkage map. In addition, they are valuable for marker-assisted selection studies, population structure analyses and comparative genomic studies ofC. sinensiswith other citrus related species. Altogether, these markers provide a significant contribution to the citrus research community.
Citation:Biswas MK, Xu Q, Mayer C, Deng X (2014) Genome Wide Characterization of Short Tandem Repeat Markers in Sweet Orange (Citrus sinensis). PLoS ONE 9(8): e104182. doi:10.1371/journal.pone.0104182
Editor:Randall P. Niedz, United States Department of Agriculture, United States of America
ReceivedMarch 28, 2014;AcceptedJuly 9, 2014;PublishedAugust 22, 2014
Copyright:ß2014 Biswas et al. This is an open-access article distributed under the terms of the Creative Commons Attribution License, which permits unrestricted use, distribution, and reproduction in any medium, provided the original author and source are credited.
Data Availability:The authors confirm that all data underlying the findings are fully available without restriction. All relevant data are within the paper and its Supporting Information files.
Funding:This research was financially supported by the Ministry of Science & Technology of China (No. 2011CB100600) and the National Natural Science Foundation of China (No. 31330066). The funders had no role in study design, data collection and analysis, decision to publish, or preparation of the manuscript.
Competing Interests:The authors have declared that no competing interests exist. * Email: [email protected]
Introduction
Tandem repeats (TR) are abundant elements in plant genomes. Evidence suggests that TR originate mainly from replication slippage events. Typically, slippage in a TR occurs about once every 1,000 generations, where slippage rates vary with repeat type, unit size as well as among species [1,2]. TRs are usually classified according to their unit size into microsatellites, minisatellites, and satellites. There is no consensus regarding the unit size boundary between micro- and minisatellites. Proposed unit size ranges of microsatellites are e.g, 1–6 bp, 2–6 bp, 2–8 bp [3] and 1–10 bp. Microsatellites are also often referred to as simple sequence repeats (SSRs). In this study we consider repeat units of one to ten nucleotides as microsatellites. Their genomic abundance, co-dominant nature, easy assay, non-random distri-bution, correlation with many phenotypes as well as multi allelic feature have made microsatellites the marker of choice for diverse application in plant genetics. The availability of whole genomic sequences provides the opportunity to investigate the genome wide distribution, density, evolution and putative function of microsat-ellites. It is well known that the microsatellite frequency differs greatly among species [4] as well as among different genomic
regions,i.e.introns, exons, CDS, intergeneric regions [5]. Previous studies demonstrated that the SSR distribution in genomic regions has practical implications with regard to their utility as molecular markers. Genic-SSR markers are more transferable to related species than genomic-SSRs. This feature helps to design anchor markers for comparative mapping studies. Since they are often more conserved, genic-SSRs may provide an insufficient degree of polymorphism to discriminate between closely related germplasm. Therefore genomic-SSRs may be valuable complements.
the narrow genetic basis of the cultivated citrus species. Inter species genetic diversity in sweet orange is relatively low compared to other citrus species as reveled in early studies using different types of molecular markers including RAPD, AFLP, ISSR (Inter simple sequence repeat), IRAP (Inter-retroelement amplified polymorphism) and SSRs [10]. The development of high density reference linkage maps of citrus is essential for the understanding of genome organization, evolution, tagging important quantitative trait loci (QTL) and map-based cloning of agronomical important traits. Consequently, it is necessary to develop a marker system in citrus that is highly polymorphic and user friendly. Among different marker systems, microsatellite markers are extensively used for genetic mapping and MAS studies in plant breeding. Unfortunately, the number of developed microsatellite markers is still low in citrus. Recently, Biswas et al. [9] and Ollitrault et al. [11] demonstrated the utility of BAC-end derived citrus SSR markers in linkage mapping and phylogenetic studies in citrus; while Chen el al. [12] established the utility of 100 citrus EST-SSR markers for genomic mapping analyses. Despite this progress in the total number of informative, robust and publicly available markers for citrus, their number is still insufficient for many important applications such as the construction of a high density linkage map, closely related cultivar identification, positional cloning, MAS, trait tagging and comparative mapping. The large scale development of these markers was not possible until the whole genomic sequence of citrus was available. In this study we surveyed, developed, and characterized SSR markers from the recently sequenced nuclear genomic sequence of sweet orangecv ‘Valencia’. Furthermore, we investigated the transferability of these markers to related species.
Materials and Methods
Plant materials
Sixteen genotypes were used for the wet lab verification and transferability analysis of the genome wide SSR primers. Plant materials were collected from the National Center of Citrus Breeding, Huazhong Agricultural University, Wuhan, China. In addition, these genotypes represent the major groups of citrus and its close relatives (Table S1 in File S1). Total genomic DNA was extracted from 5 g mature fresh young leaves of each genotype using the CTAB method [13] with subsequent RNase A treatment.
Source of genomic sequences
The genome sequencing of a doubled-haploid callus line of sweet orange cv. ‘Valencia’ was performed with a whole-genome shotgun approach combined with the DNA-PET technology. The genome was assembled using the Short Oligo-nucleotide Analysis Package (SOAPdenovo). The high quality sequence reads were assembled into 4,811 scaffolds with N50 = 1.7 Mb. The total contig length (320.5 Mb) covers about 87.3% of the sweet orange genome. The frozen version of the sweet orange genome assembly, which consists of scaffolds and BAC end sequences, was used in this study for a genome wide SSR marker characterization. SSR mining and Primer design
The software SSRLocatorI V1.1 was used for genome wide SSR mining and primer design. To identify SSRs in the citrus genome, we searched for perfect repeats with a unit size of 1 to 10 bp and a length of at least 16 nucleotides. All SSRs were grouped into Class I ($20 bp total length) and Class II (16–19 bp total length). Primer pairs were design to meet the following restrictions: the amplicon had to be in the range 150–500 bp, the
primer annealing temperature was restricted to 55–60uC, the GC content had to be 40–60% and the primer length had to be 19– 21 bp.
In silicoanalysis of SSR polymorphism
In silicopolymorphism analysis of SSR markers was perform using the virtual PCR strategy where pairs of primer sequences from Sweet Orange were mapped onto the Clementina genomic sequence scaffolds. (Only di- to hexanucleotide repeat primers where considered.) The specificin silico-generated amplicons from Clementina were compared with the expected amplicon size from Sweet Orange and their size differences were recorded. If an amplicon size differed by at least 2 bp, the SSRs was classified as polymorphic, while amplicons of identical size were considered as monomorphic. SSR loci with a 1-bp difference were considered ambiguous and were removed from the analysis.
Functional annotation of genome wide SSR markers An in house developed perl script was used to isolate flanking sequences of the SSR markers for assigning a putative function to each SSR marker. For primers in protein coding regions, this approach made use of the Blast2GO tool. The mapping and annotation of the sequences is based on sequence similarity according to gene ontology [14]. Therefore, sequences without BLAST hit have not been annotated. The default settings were used for the annotation parameters (E value filter of 1E-10 and annotation cutoff of 55).
Wet lab verification and utility of the SSR markers A total of 950 SSR markers with an average distance of 0.5 Mb were selected from the nine chromosomes for the wet lab validation, where a set of 16 citrus genotypes were used as targets species. PCR reactions were conducted as follows: 10ml of PCR-volume consisted of 25 ng of genomic DNA, 1.5 mmol l21MgCl2,
0.2 mmol l21 dNTPs, 1.0 U Taq DNA polymerase, 16PCR
buffer and 0.1mmol l21of each primer pair. PCR amplification was conducted in a MJ-PTC-200 tm thermal controller (MJ Research, Waltham Mass) using the following program: 94uC for 5 min, 32 cycles at 94uC for 1 min, 55uC for 30 s, 72uC for 1 min, followed by a final step at 72uC for 4 min. After PCR, 8ml of loading buffer (98% formamide, 2% dextran blue, 0.2 mM EDTA) was added to each sample. Samples were denatured at 90uC for 5 min and then immediately placed on ice. An aliquot (4ml) of each sample was loaded onto 6% polyacrylamide gel (60 cm630 cm60.4 cm), which was run for 2 h and 30 min at
80 V. DNA bands were visualized with silver staining as described by Ruiz et al. [15]. The band size is reported for the most intense amplified band for each SSR or the average of the stutter if the intensity was the same. A 10 bp DNA ladder (Fermentas) was used as the reference point. Polymorphic information content (PIC) of
each SSR was calculated using the following formula:
PIC~1{Pp2
i, where piis the proportion of theith allele. Gnome wide localization and database of SSR marker
A graphical presentation of the SSR marker distribution in different chromosomes of Sweet Orange was made using the MapChart 2.2 software. For an easy access and utilization of SSR markers, all markers were stored in a database, which will be made available to the public soon. Markers are named according to the following scheme: E.g. in M2H4Si3025, the M stands for the initial character of the developer name, the 2 depicts the chromosome and H stands for the host institute. 4 depicts the
Genomic-SSR Marker inCitrus sinensis
SSR unit size, Si the Citrus species (hereCitrus sinensis) followed by the SSR pattern id, a number that is unique for each unit size. Results
Frequency and distribution of SSR in the sweet orange genome
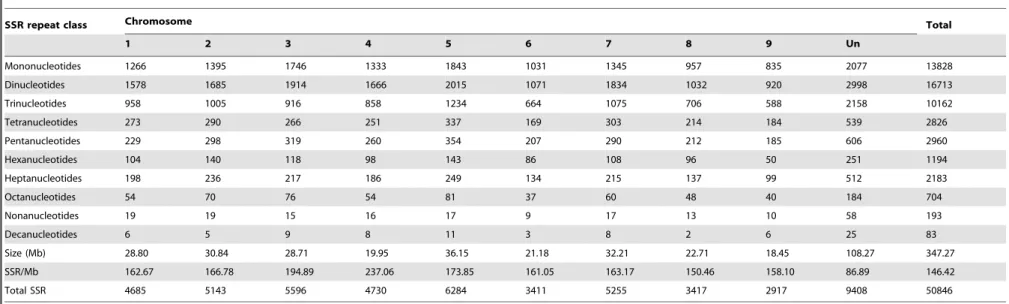
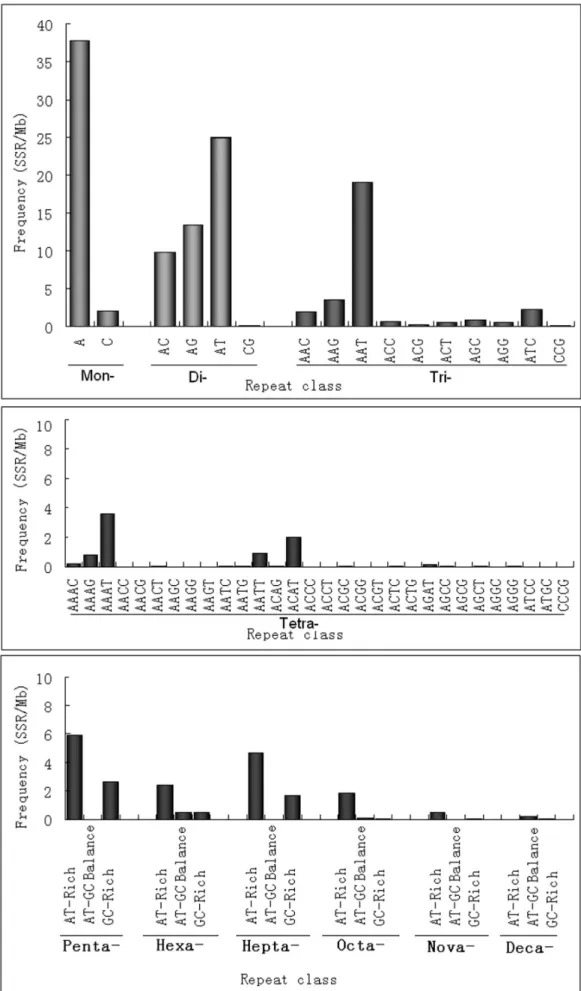
In the first step, we analyzed the distribution and frequency of perfect microsatellites with a minimum length of 16-bp and a unit size of 1 to 10-bp. The results are summarized in Table 1. A total of 50,846 SSRs were identified which represents an overall density across the genome of 146.42 SSR/Mbp (i.e., one SSR found in every 6.8 kbp). Based on their length, SSRs are categorized into two classes, namely Class I ($20 bp) and Class II (16–19 bp). Of the total number of SSR identified in the sweet orange genome, 28,211 (55.48%) were identified as Class I and 22635 (44.52%) as Class II. On average, the estimated frequency of Class I and Class II SSR was 81.24 and 65.18 per Mb, respectively. Altogether, the total lengths of mono- to deca-nucleotide repeats accounted for about 0.461% of the genome. Among the different unit sizes, dinucleotide repeats are the most common. They constitute 32.87% of all SSRs, followed by mono- (27.20%) and trinucleotide repeats (19.99%), while nona- and deca-nucleotide repeats were least abundant. Surprisingly, we found that hepta-nucleotide repeat numbers were two fold higher than hexanucleotides repeat numbers. Furthermore, we estimated the frequency distribution of SSRs in the nine chromosomes of the sweet orange genome and the result reveals that chromosome 4 has the highest frequency of SSRs (237.06 SSRs/Mb), while chromosome 8 contains the lowest (150.46 SSRs/Mb). Overall the frequency of SSRs in the different chromosomes was not significantly different (Table 2). SSR characteristics for different unit sizes are shown in Figure S1 and Table S2 in File S1. The mean number of trinucleotide (16.12) repeats is higher than others, except mononucleotides. The distribution of SSRs in different genomic region of the sweet orange genome is presented in Figure 1 and as a result it appears that SSR are denser in 59-UTR region than in other genic regions. A more detailed investigation of individual repeat types was performed and presented in Figure 2 and Table S3 in File S1. As expected A/T repeats are more abundant than G/C repeats. The most frequent dinucleotide repeat unit is AT, while GC is very rare. AT dinucleotide repeats account for 16.99% of all SSRs, which reveals that AT repeats are the overall most common repeat type in sweet orange genome. AAT is the most frequent and CCG the least frequent trinucleotide repeat pattern. The predominant tetranucleotide repeat is AAAT, whereas GC-rich repeats like ACCC, AGGC, AGGG, CCCG are rare. AT-rich motifs are predominant in penta-, hexa- and heptanucleotide repeats, such as AAAAT, AAAAG, AAATT and AATAT, which are the most common pentanucleotide repeats. AAAAAG, AAAAAT and AAAAAC motifs are prevailed among hexanucleotides. Octa-, nona- and decanucleotides are underrepresented repeat types in the sweet orange genome, altogether accounting for only 1.95% of the total SSRs. AT-rich repeat patterns such as AAAAAAAG, AAAAAAAT and AAAAAATT are most frequent among the octanucleotide repeats, whereas AAAAAAAAG, AAAAAAAAT and AAAAAAAAC are most abundant among nonanucleotide repeats. The AACAATTATT and AAAAAAAAAG patterns are most abundant among decanucleotide repeats.
Genome wide SSR marker development and in silico polymorphism analysis
One of the primary goals of this study was to develop genome-wide SSR markers. Primers were designed for most of the di- to
hexanucleotide repeats and results are presented in Table 3. A total of 21,248 SSR markers were successfully designed from the nine chromosomes. The distribution of SSR markers among the nine chromosomes was not significantly different. On average 2360 SSR markers were designed for each chromosome with 89 markers per Mb, covering the whole genome with gaps of less than 12 kb (Figure 3).
Virtual PCR (VPCR) was performed forin silicopolymorphism analysis and results are presented in Figure 4 and Table S4 in File S1. SSR markers are classified either as polymorphic or monomorphic based on thein silico amplicon size comparison. A total of 6588 (31%)C. sinensisprimers amplified specific bands in silicofrom the genome ofC. clementina. The remaining primers failed to generate specific amplicons or generated no amplicons. Among the 6588 SSR markers with amplicons, 3941 (59%) were polymorphic and 2647 (40%) were monomorphic as indicated in Figure 4. The relationship between degree of polymorphism and repeat length for each SSR type was estimated. We observe that shorter repeats are more monomorphic than long repeats, while polymorphic SSRs include a considerably higher percentage of long repeats. Dinucleotide repeats are more polymorphic than other repeat types and trinucleotide repeats have the highest proportion of monomorphic repeats.
Functional annotation, wet lab validation of SSR markers and utility of newly developed GW-SSR resource for citrus research
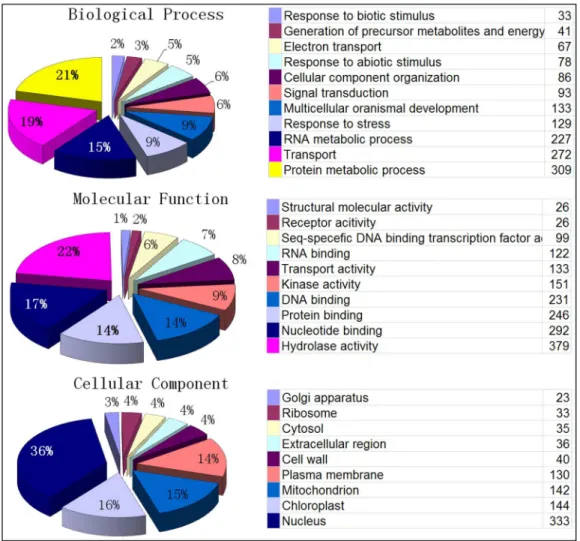
Functional annotation of SSR loci was performed by a Blast2Go analysis. A significant GO annotation was found for 1870 loci, whereas 19378 loci had no significant homology to known sequences in the public databases (Figure 5). The majority of SSR loci for which an annotation was found are involved in protein metabolic processes (309), transport (272), and RNA metabolic process (227). When mapped against the molecular function category, 379 (20%), 292 (16%), 246 (13%) and 231 (12%) SSR loci were involved in hydrolase activity, nucleotide binding, protein binding and DNA binding, respectively. When mapped against the cellular component GO terms, 333 SSR loci (18%) were involved in nucleus and 144 (8%) were involved in chloroplast function.
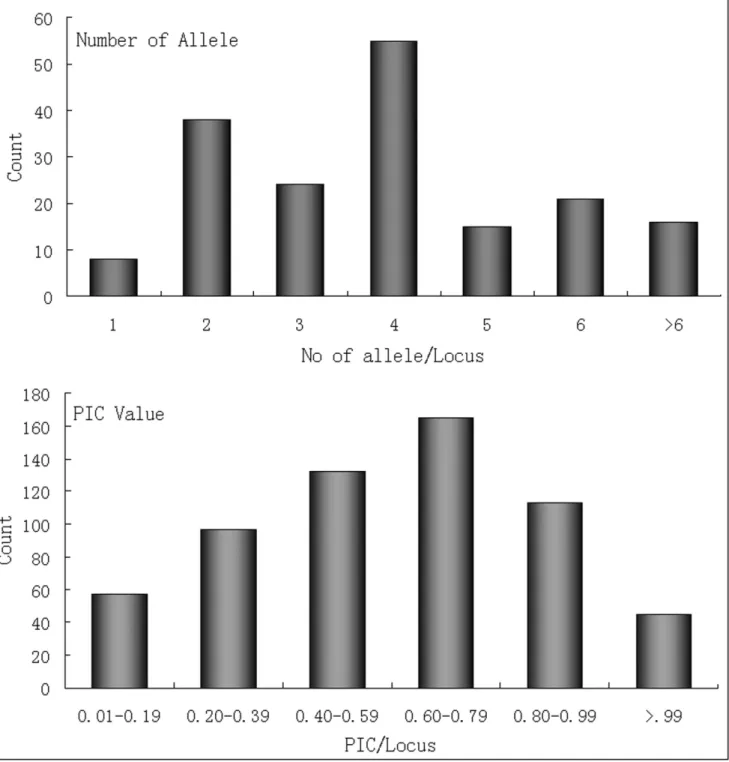
A subset of 950 markers had been selected for wet lab experiments. Of these, 64.11% could be amplified in all 16 citrus accessions with prominent PCR products having the expected size. Among the tested primer pairs, 578 amplified in orange accessions, while 56.11%, 57.58% and 50.42% amplified in C. grandis, lemon (C.limonia) and trifoliata orange (Poncirus trifoliata), respectively. Highest transferability to the relative species was found in lemon followed byC. grandisand Kumquat (Fortunella) (Table S10 in File S1). A total of 2547 alleles were recorded from 609 SSR loci with an average of 4 alleles per loci. The majority of the primer amplified 4 alleles, followed by 2 and 3 respectively (Figure 6). The PIC value varied from 0.10 to 0.95 with an average of 0.73. The majority of the PIC values were found in the interval from 0.60 to 0.79 (Figure 6).
Discussion
Frequency and distribution of SSRs in the sweet orange genome
We analyzed the genome-wide SSR distribution, frequency and density in the unit size range of 1 to 10 bp inC. sinensis. SSRs contributed 0.5% to the 347 Mbp genome assembly ofC. sinensis and we found 1 SSR per 6.8 Kbp. This result is comparable with the SSR densities reported for other plant species [16,17,18]. In general, the frequency of SSRs is considerably higher in dicot
species compare to monocots [4]. Our comparison of the SSR frequency in theC. sinensisand theS. bicolorgenome shows a 2 fold higher frequency in the sweet orange genome (see Table S5, S6 in File S1). The majority of the SSRs were identified in chromosome 5, although the density of SSRs is the highest in chromosome 4. Many reports have demonstrated that SSRs are non-randomly distributed in genomes of various species [5,19]. We performed a chi-square test to test for differences in the SSR distribution among different genomic regions and also the distribution among nine pseudo chromosomes (Table S7 in File
Figure 1. Absolute number count (A), relative number counts (B), and density (C) of SSRs in different genomic regions of the sweet orange genome.
doi:10.1371/journal.pone.0104182.g001
Genomic-SSR Marker inCitrus sinensis
S1). The chi square test supports a non-random distribution of SSRs in the sweet orange genome. We observed that the number of SSRs is negatively correlated with the genome size (r =20.70). Similar observations have also been reported by Cavagnaro et al. [20]. Different SSR characteristics have been documented for different genomic regions in plant genomes. For example, Mun et al. [18] reported that SSR frequencies are higher in intergenic regions than in transcribed regions. In agreement with this observation, our results show a 1.5 fold higher SSR frequency in intergenic regions compared to transcribed regions of the sweet orange genome. Furthermore, we observed that among untran-scribed regions, SSRs are densest in 59-UTR, followed by introns and 39-UTR regions. Similar observations for SSR densities in different genomic regions have been made for fungi [21,22] and plants [4]. The presence of certain polymorphic SSRs in coding regions could modify the coding protein. SSRs in UTRs or introns could affect the level of gene expression, which could even lead to phenotypic changes. Li et al. [23] and Zhang et al. [24] demonstrated that variations in 39-UTR or 59-UTR SSRs could be responsible for regulating the translation of proteins and for mRNA stabilization. The SSR elements in 59-UTR region are essential for some gene regulation adaptation as well as phenotypic changes on short time scales. In addition, evidence for SSRs in coding region which affect phenotypes in human MMR genes has been reported by Duval and Hamelin [25] as well as Vassileva et al. [26]. In this light, the high densities of SSRs in 59-UTRs of the sweet orange genome should be seen as an opportunity to study the influence of SSRs on citrus gene regulation.
In sweet orange, most SSRs are mono-, di- and trinucleotide repeats, which together account for about 80% of all of the SSRs. We found that dinucleotide repeats are most frequent in the sweet orange genome, where trinucleotide repeats are most frequent in
the cucumber [20] genome. This difference could arise from different search parameters used [20]. Cavagnaro et al. [20] explained how different SSR frequencies can be obtained in different studies due to differences in SSR search parameters and search algorithms. Therefore, in order to compare the frequency of SSRs in different plant species, the same program should be used with exactly the same search parameters. For this reason, we calculate the SSR frequencies of 11 plant genomes including citrus (see Table S5, S6 in File S1). Our data reveal that dinucleotide repeats are predominant in both monocot and dicot genomes and that the occurrence of different types of SSRs greatly vary with the search parameters. Surprisingly, heptanucleotide repeats show a higher density than hexanucleotide repeats in the sweet orange genome. Similar trends are also found in dicot species but not in monocot plant species. So it has been postulated that the decrease in SSR frequency with unit length is higher in monocot species as compared to dicot species. The distribution of microsatellites across the different genomic regions show that all repeat types except tri- and hexanucleotide repeats were comparatively less frequent in CDS regions compared to the other genomic region of the sweet orange genome. The high frequency of trinucleotide repeats in protein coding regions (CDS) has previously been reported for several plant species [16,17,18,27,28] and other eukaryotes including insects and human [29,30,31]. The predom-inance of tri- and hexanucleotide repeats in CDS regions can be explained by the fact that their mutations won’t disrupt the reading frame. We also found evidence for positive selection for specific repeats in the sweet orange genome by comparing the repeat density of a specific patter with its reverse complement on the sense strand in transcribed regions. This effect is called a standedness [5]. For example, the CT pattern is over-represent in 59-UTR but not 39-UTR compared to the AG pattern (Table S8, Table 1.SSR characteristics in the genome assembly ofC. sinensis.
SSR mining Total %
Total length of analyzed sequences (bp) 347267366
Number of identified SSRs 50846
Number of SSR Loci 46872
SSR Frequency (Mbp) 146.42
SSR Density (bp/Mbp) 4605.56 0.461
Distribution of SSRs
Type Class I* Class II$ Total %
Mononucleotides 3298 10530 13828 27.20
Dinucleotides 8882 7831 16713 32.87
Trinucleotides 5888 4274 10162 19.99
Tetra-nucleotides 2826 0 2826 5.56
Penta- nucleotides 2960 0 2960 5.82
Hexa- nucleotides 1194 0 1194 2.35
Hepta- nucleotides 2183 0 2183 4.29
Octa- nucleotides 704 0 704 1.38
Nona- nucleotides 193 0 193 0.38
Deca- nucleotides 83 0 83 0.16
Total (%) 28211(55.48) 22635(44.52)
Frequency (SSR/Mb) 81.24 65.18
* Class I :SSR loci are greater than 19 nt long; $
Table 2.Chromosome wide distribution of SSRs in theC. sinensisgenome.
SSR repeat class Chromosome Total
1 2 3 4 5 6 7 8 9 Un
Mononucleotides 1266 1395 1746 1333 1843 1031 1345 957 835 2077 13828
Dinucleotides 1578 1685 1914 1666 2015 1071 1834 1032 920 2998 16713
Trinucleotides 958 1005 916 858 1234 664 1075 706 588 2158 10162
Tetranucleotides 273 290 266 251 337 169 303 214 184 539 2826
Pentanucleotides 229 298 319 260 354 207 290 212 185 606 2960
Hexanucleotides 104 140 118 98 143 86 108 96 50 251 1194
Heptanucleotides 198 236 217 186 249 134 215 137 99 512 2183
Octanucleotides 54 70 76 54 81 37 60 48 40 184 704
Nonanucleotides 19 19 15 16 17 9 17 13 10 58 193
Decanucleotides 6 5 9 8 11 3 8 2 6 25 83
Size (Mb) 28.80 30.84 28.71 19.95 36.15 21.18 32.21 22.71 18.45 108.27 347.27
SSR/Mb 162.67 166.78 194.89 237.06 173.85 161.05 163.17 150.46 158.10 86.89 146.42
Total SSR 4685 5143 5596 4730 6284 3411 5255 3417 2917 9408 50846
doi:10.1371/journal.pone.0104182.t002
Genomic-SSR
Marker
in
Citrus
sinensis
PLOS
ONE
|
www.ploson
e.org
6
August
2014
|
Volume
9
|
Issue
8
|
S9 in File S1). It is believed that oligo pyrimidine tracts in the 59 -terminal may be involved in the regulation of translation in vertebrate mRNA and also known as the plant translational apparatus [32]. Evidences suggested that CT microsatellites in 59UTR of Arabidopsis thaliana are involved in their antisense transcription [33].
As shown in Figure 1, there is a remarkable variation in the frequency of individual repeat patterns in the sweet orange genome. The base composition of sweet orange SSR patterns is strongly biased toward A and T for all unit sizes. To give an example, the density of mono repeats A/T was 20 fold higher than
for G/C patterns. This result is consistent with the previous studies where AT rich repeats have been found to be characteristic for dicot plants but not for monocots. The prevalence of AT over GC rich repeats seems to correlate with the overall genome composition. Indeed, the GC content in dicot genomes is comparatively lower than in monocot genomes. High differences among repeat pattern densities have also been reported for example for the Brassicaceae where the GAA/TTC and AAG/ CTT trinucleotide patterns were the most frequent [34], while Hong et al. [35] found AAG/CTT to be the most abundant pattern inArabidopsisandB. rapa. In the Solanaceae, the GAA/
Figure 3. Chromosome maps depicting SSR loci of 5824 developed markers along the nine chromosomes ofC. sinensis. doi:10.1371/journal.pone.0104182.g003
Genomic-SSR Marker inCitrus sinensis
TCC and AGA/TCT patterns are most frequent, while CCG/ CGG are the most frequent patterns found in the Solanaceae family [35] and in the coccolithophoreEmiliania huxleyi[36]. Genome wide SSR marker development, in silico polymorphism analysis, Functional annotation and wet lab validation of SSR markers
As noted for example by Cavagnaro et al. [20] mononucleotide repeats are not suitable for marker development. Therefore, we only considered di- to hexanucleotides repeats for primer modeling. In this size range, 33855 SSRs were identified in the sweet orange genome, but only 21248 (62.76%) loci are suitable for SSR marker development. SSR loci can be unsuitable for marker development due to insufficiently flanking regions.In silico polymorphisms of the developed markers were estimated by using the virtual PCR strategy. That allowed us to understand the possible relationships between the degree of polymorphism and particular features of sweet orange microsatellites. It is known that long repeats are more prone to mutations, which shrink the repeat, both in plants and animals [20,37,38]. Similar trends are found in our study. Comparing C. sinensis and C. clementina, we found that most SSR alleles fromC. sinensisshowed a length reduction in the corresponding C. clementinaalleles. This result could be biased by the selection of the SSR loci analyzed, or the differences in SSR mutation rates between the two genotypes. Usually larger repeats are selected during SSR marker development; increasing the chances for a biased selection.
As expected, the majority of the SSR markers had no GO assignment since most SSRs are located in the intergenic regions of the sweet orange genome. However, a total 9% of the SSR markers had significant Gene Ontology hits. SSR loci with GO terms are good candidates as molecular markers for association studies.
In total, 950 SSRs that had been evaluated in silico were confirmed by wet lab experiments (i.e. PCR and gel electropho-resis) and for most of them, the results are consistent with the virtual PCR result. We obtained a high PCR amplification efficiency in this study (609 primer yielded scorable amplicons) which is consistent with earlier studies of marker development in plant species [39]. As expected, we found that the degree of marker transferability is higher in intra-specific populations than in inter-specific populations. The high degree of intra and inter specific transferability of markers will have a broad utilization in taxonomic, population conservation as well as mapping studies. Finally, it will assist breeding programs of citrus relatives, especially for species for which only few markers have been developed to data (such as lemon, lime, citron and kumquat etc.). The transferability of sweet orange SSR markers across Citrus species is higher than reported for other plant species [40,41]. In general, the transferability rate within genus and among the genus greatly varies with the phylogenetic distances of the examined species and the genomic region used for marker development. EST-derived SSRs are more conserved than genomic-SSRs, therefore EST-SSRs are more transferable to related genera than genomics SSRs.
Conclusion
The present study contributes to a detailed characterization and utilization of genome wide SSR markers in sweet orange. The sweet orange genome has a prevalence for AT-rich SSRs and SSRs are non-randomly distributed. A large number of markers have been developed and almost two thirds of these are transferable as well as polymorphic among citrus relatives. The
knowledge of these markers significantly contributes to enhance the genomic resources in citrus species and will facilitate a number of genetic and genomic studies in citrus, including genetic diversity
evaluation, population genetics, high density linkage map, positional cloning, and comparative genomics in other citrus species.
Figure 4. Frequency distribution ofC. sinensisSSRs by repeat length, in monomorphic and polymorphic SSRs obtained fromin silico
PCR analyses.
doi:10.1371/journal.pone.0104182.g004
Figure 5. Gene Ontology annotation of genome wide developed sweet orange SSR marker flanking regions (A), the GO biological process, (B) molecular function and (C) cellular component.
doi:10.1371/journal.pone.0104182.g005
Genomic-SSR Marker inCitrus sinensis
Supporting Information
Figure S1 Relative frequency (%) of SSR types, by
number of repeats in the sweet orange genome. (TIF)
File S1 Supporting files. Table S1, List of plat material
used in wet lab experiment. Table S2, Mean number of repeats units observed in sweet orange genome. Table S3, Detailed investigation of individual repeat types. Table S4,In silicoPCR result withC. clementina. Table S5, Results of microsatellite search. Table S6,
Distribu-tion to different repeat type classes among the 11 plant species. Table S7, Chi-square and correlation analysis. Table S8, Strand specificity of perfect microsatellites in C. sinensistranscribed regions. Table S9, SSR
distribu-tion in different genomic fracdistribu-tion on sweet orange genome. Table S10, Summary of the wet lab experiment. (DOC)
File S2 Supporting file. Table S11,Citrus sinensisSSR
marker data base. (XLSX)
Author Contributions
Conceived and designed the experiments: MKB QX XD. Performed the experiments: MKB. Analyzed the data: MKB CM. Contributed reagents/
materials/analysis tools: MKB QX. Contributed to the writing of the manuscript: MKB CM. Supervised the projects: XD.
References
1. Weber JL, Wong C (1993) Mutation of human short tandem repeats. Hum Mol Genet 2: 1123–1128.
2. Kruglyak S, Durrett RT, Schug MD, Aquadro CF (1998) Equilibrium distributions of microsatellite repeat length resulting from a balance between slippage events and point mutations. Proc Natl Acad Sci U S A 95: 10774– 10778.
3. Richard GF, Kerrest A, Dujon B (2008) Comparative genomics and molecular dynamics of DNA repeats in eukaryotes. Microbiol Mol Biol Rev 72: 686–727. 4. Sonah H, Deshmukh RK, Sharma A, Singh VP, Gupta DK, et al. (2011) Genome-wide distribution and organization of microsatellites in plants: an insight into marker development in Brachypodium. PLoS One 6: e21298. 5. Mayer C, Leese F, Tollrian R (2010) Genome-wide analysis of tandem repeats in
Daphnia pulex - a comparative approach. BMC Genomics 11:277. 6. FAOSTAT (2012) Food and Agriculture Organization of the United Nations,
Rome: FAO.
7. Arumuganathan K, Earle E (1991) Nuclear DNA content of some important plant species. Plant Molecular Biology Reporter 9: 208–218.
8. Biswas MK, Chai L, Amar MH, Zhang X, Deng XX (2011) Comparative analysis of genetic diversity in Citrus germplasm collection using AFLP, SSAP, SAMPL and SSR markers. Scientia Horticulturae 129: 798–803.
9. Biswas MK, Chai L, Mayer C, Xu Q, Guo W, et al. (2012) Exploiting BAC-end sequences for the mining, characterization and utility of new short sequences repeat (SSR) markers in Citrus. Molecular Biology Reports: 1–14.
10. Biswas MK, Xu Q, Deng XX (2010) Utility of RAPD, ISSR, IRAP and REMAP markers for the genetic analysis of Citrus spp. Scientia Horticulturae 124: 254–261.
11. Ollitrault F, Terol J, Pina JA, Navarro L, Talon M, et al. (2010) Development of SSR markers from Citrus clementina (Rutaceae) BAC end sequences and interspecific transferability in Citrus. Am J Bot 97: e124–129.
12. Chen C, Zhou P, Choi YA, Huang S, Gmitter FG Jr (2006) Mining and characterizing microsatellites from citrus ESTs. Theor Appl Genet 112: 1248– 1257.
13. Cheng YJ, Guo WW, Yi HL, Pang XM, Deng X (2003) An efficient protocol for genomic DNA extraction fromCitrus species. Plant Molecular Biology Reporter 21: 177–178.
14. Bohra A, Dubey A, Saxena RK, Penmetsa RV, Poornima KN, et al. (2011) Analysis of BAC-end sequences (BESs) and development of BES-SSR markers for genetic mapping and hybrid purity assessment in pigeonpea (Cajanus spp.). BMC Plant Biol 11: 56.
15. Ruiz C, Paz Breto M, Ası´ns MJ (2000) A quick methodology to identify sexual seedlings in citrus breeding programs using SSR markers. Euphytica 112: 89–94. 16. Cardle L, Ramsay L, Milbourne D, Macaulay M, Marshall D, et al. (2000) Computational and experimental characterization of physically clustered simple sequence repeats in plants. Genetics 156: 847–854.
17. Temnykh S, DeClerck G, Lukashova A, Lipovich L, Cartinhour S, et al. (2001) Computational and experimental analysis of microsatellites in rice (Oryza sativa L.): frequency, length variation, transposon associations, and genetic marker potential. Genome Res 11: 1441–1452.
18. Mun JH, Kim DJ, Choi HK, Gish J, Debelle F, et al. (2006) Distribution of microsatellites in the genome of Medicago truncatula: a resource of genetic markers that integrate genetic and physical maps. Genetics 172: 2541–2555. 19. Kuntal H, Sharma V, Daniell H (2012) Microsatellite analysis in organelle
genomes of Chlorophyta. Bioinformation 8: 255–259.
20. Cavagnaro PF, Senalik DA, Yang L, Simon PW, Harkins TT, et al. (2010) Genome-wide characterization of simple sequence repeats in cucumber (Cucumis sativus L.). BMC Genomics 11: 569.
21. Labbe´ J, Murat C, Morin E, Tacon F, Martin F (2011) Survey and analysis of simple sequence repeats in the Laccaria bicolor genome, with development of microsatellite markers. Current Genetics 57: 75–88.
22. Murat C, Riccioni C, Belfiori B, Cichocki N, Labbe J, et al. (2011) Distribution and localization of microsatellites in the Perigord black truffle genome and identification of new molecular markers. Fungal Genet Biol 48: 592–601. 23. Li B, Xia Q, Lu C, Zhou Z, Xiang Z (2004) Analysis on frequency and density of
microsatellites in coding sequences of several eukaryotic genomes. Genomics Proteomics Bioinformatics 2: 24–31.
24. Zhang L, Zuo K, Zhang F, Cao Y, Wang J, et al. (2006) Conservation of noncoding microsatellites in plants: implication for gene regulation. BMC Genomics 7: 323.
25. Duval A, Hamelin R (2002) Genetic instability in human mismatch repair deficient cancers. Ann Genet 45: 71–75.
26. Vassileva V, Millar A, Briollais L, Chapman W, Bapat B (2002) Genes involved in DNA repair are mutational targets in endometrial cancers with microsatellite instability. Cancer Res 62: 4095–4099.
27. Morgante M, Hanafey M, Powell W (2002) Microsatellites are preferentially associated with nonrepetitive DNA in plant genomes. Nat Genet 30: 194–200. 28. Peng JH, Lapitan NL (2005) Characterization of EST-derived microsatellites in the wheat genome and development of eSSR markers. Funct Integr Genomics 5: 80–96.
29. Toth G, Gaspari Z, Jurka J (2000) Microsatellites in different eukaryotic genomes: survey and analysis. Genome Research 10: 967–981.
30. Subramanian S, Mishra RK, Singh L (2003) Genome-wide analysis of microsatellite repeats in humans: their abundance and density in specific genomic regions. Genome Biol 4: R13.
31. Weng Y, Azhaguvel P, Michels GJ Jr, Rudd JC (2007) Cross-species transferability of microsatellite markers from six aphid (Hemiptera: Aphididae) species and their use for evaluating biotypic diversity in two cereal aphids. Insect Mol Biol 16: 613–622.
32. Shama S, Meyuhas O (1996) The translational cis-regulatory element of mammalian ribosomal protein mRNAs is recognized by the plant translational apparatus. Eur J Biochem 236: 383–388.
33. Martienssen RA, Colot V (2001) DNA methylation and epigenetic inheritance in plants and filamentous fungi. Science 293: 1070–1074.
34. da Maia LC, de Souza VQ, Kopp MM, de Carvalho FI, de Oliveira AC (2009) Tandem repeat distribution of gene transcripts in three plant families. Genet Mol Biol 32: 822–833.
35. Hong CP, Piao ZY, Kang TW, Batley J, Yang TJ, et al. (2007) Genomic distribution of simple sequence repeats in Brassica rapa. Mol Cells 23: 349–356. 36. Read BA, Kegel J, Klute MJ, Kuo A, Lefebvre SC, et al. (2013) Pan genome of the phytoplankton Emiliania underpins its global distribution. Nature 499: 209– 213.
37. Ellegren H (2000) Heterogeneous mutation processes in human microsatellite DNA sequences. Nat Genet 24: 400–402.
38. Wierdl M, Dominska M, Petes TD (1997) Microsatellite instability in yeast: dependence on the length of the microsatellite. Genetics 146: 769–779. 39. Cavagnaro PF, Chung SM, Manin S, Yildiz M, Ali A, et al. (2011) Microsatellite
isolation and marker development in carrot - genomic distribution, linkage mapping, genetic diversity analysis and marker transferability across Apiaceae. BMC Genomics 12: 386.
40. Zhang LY, Bernard M, Leroy P, Feuillet C, Sourdille P (2005) High transferability of bread wheat EST-derived SSRs to other cereals. Theor Appl Genet 111: 677–687.
41. Zhao H, Yu J, You FM, Luo M, Peng J (2011) Transferability of microsatellite markers from Brachypodium distachyon to Miscanthus sinensis, a potential biomass crop. J Integr Plant Biol 53: 232–245.
Genomic-SSR Marker inCitrus sinensis