Skewed RAPD markers in linkage maps of
Citrus
Roberto Pedroso de Oliveira
1, Carlos Ivan Aguilar-Vildoso
2, Mariângela Cristofani
3and
Marcos Antônio Machado
21
Embrapa, Centro de Pesquisa Agropecuária de Clima Temperado (CPACT), Pelotas, RS, Brazil.
2
Centro Apta Citrus ‘Sylvio Moreira’, Cordeirópolis, SP, Brazil.
3
Embrapa, Centro Nacional de Pesquisa de Milho e Sorgo, Sete Lagoas, MG, Brazil
Abstract
The objective of this work was to analyze the effects of RAPD markers with skewed segregation on genetic linkage maps. Segregation data for 123Citrus sinensis (L.) Osbeck cv. Pêra markers and 53 C. reticulata Blanco cv. Cravo markers in F1 progeny composed of 94 hybrids were used. Genetic linkage maps of the two varieties were constructed with non-skewed markers (p < 0.05 and p < 0.01) using the program MAPMAKER 3.0 and a pseudo-testcross strategy. The maps were compared to those constructed with all markers. Alterations in the genetic distances were observed based on the location of the skewed markers within the linkage groups. Generally, the skewed markers were located at the end of the linkage groups, sometimes forming entire linkage groups, without causing significant distance modifications. However, skewed markers located between non-skewed markers caused significant distance modifications and, in some cases, altered the order of the markers. Most of the skewed markers can be included in linkage maps, but in each case the degree of distance modification caused by each marker needs to be assessed.
Key words: genetic distance, Mendelian segregation, molecular markers, segregation distortion.
Received: May 15, 2003; Accepted: November 27, 2003.
Introduction
Genetic linkage maps have been obtained for several plant species and are the basis for advanced genetic studies that provide a better understanding of the inheritance, iden-tification and isolation of genes (Rooseet al.,2000). Clon-ing and gene insertion through genetic transformation have been widely used in species with well-defined genetic maps (Gmitter Jr.et al.,1996).
Different types of molecular markers have been used to obtain genetic linkage maps. Molecular markers are used because they are highly polymorphic and are not influenced by the environment. Among these, random amplified poly-morphic DNA (RAPD) markers are the most common be-cause the technique is easy, inexpensive, uses a low amount of genomic DNA, and produces markers that are highly polymorphic and that represent the whole genome (Ferreira and Grattapaglia, 1998). RAPD markers are detected by the random amplification of genomic DNA fragments of dif-ferent sizes through the polymerase chain reaction (PCR) (Williamset al.,1990).
The genetic features found inCitrusfavor the con-struction of genetic maps. Citrus has a small genome
(1C = 0.62 pg) (Guerra, 1984), is diploid with a small num-ber of chromosomes (n = 9) (Soost and Cameron, 1975) and is highly polymorphic. In addition, interspecific and intergeneric hybrids can be produced (Barrett, 1985).
Several studies have described the mapping ofCitrus
in order to identify genes and/or quantitative trait loci (QTL) for traits such as resistance/susceptibility to mineral salts and cold (Caiet al.,1994; Mooreet al.,2000), tristeza virus (Mestreet al.,1997; Cristofaniet al.,1999) and citrus variegated chlorosis (CVC) (Oliveira et al., 2004), dor-mancy, juvenile characters and vigor (Rooseet al.,1992), plant height and fruit acidity (Gmitter Jr.et al.,1996).
The construction of linkage maps ofCitrusbased on molecular markers has been achieved using markers with an expected Mendelian segregation and with those that a skewed segregation (Caiet al., 1994; Luro et al., 1994; Kijaset al.,1997; Cristofaniet al.,1999). For maps of other genera, some authors have used markers with a skewed seg-regation (Crouzillat et al., 1996), while others have ex-cluded such markers (Grattapaglia and Sederoff, 1994). Skewed loci can reveal important genetic information but can also alter the distances and the linear order of the other markers in the linkage groups (Jarrellet al.,1992).
The objective of this work was to analyze and quan-tify the effects of RAPD markers with a skewed
segrega-Send correspondence to Roberto Pedroso de Oliveira. Embrapa Clima Temperado, BR 392 km 78, Caixa Postal 403, 96001-970 Pelotas, RS, Brazil. E-mail: rpedroso@cpact.embrapa.br.
tion on genetic maps and on the location of these markers in linkage groups usingCitrusspecies as a model.
Material and Methods
The species used wereCitrus reticulata Blanco cv. Cravo, C.sinensis(L.) Osbeck cv. ‘Pêra’ and 94 F1progeny
obtained by crossing these varieties. The hybrids were ob-tained by controlled crossing, with ‘Cravo’ mandarin as the female parent. Data from the segregation of 123 RAPD markers from ‘Pêra’ sweet orange and 53 from ‘Cravo’ mandarin, all obtained by Oliveiraet al.(2004), were used for genetic analyses. These markers were heterozygous for one of the parents (Aa) and recessive homozygous (aa) for the other, based on the presence of the RAPD bands. The null hypothesis of a 1:1 Mendelian segregation was tested for each marker byχ2analyses (p < 0.05 and p < 0.01).
Linkage maps for each variety were constructed using the markers that did not have a skewed segregation at p < 0.05 and at p < 0.01. The pseudo-testcross strategy, the Kosambi function (Kosambi, 1944) and the parameters LOD (Likelihood of odds)≥6.0 and a maximum frequency of recombination (θ) of 0.40 were applied to the linkage analyses among the markers using the software MAPMAKER v. 3.0 (Landeret al.,1987). The compiled data were duplicated and recoded to allow the detection of linkage of the RAPD marker when in repulsion phase (Grattapaglia and Sederoff, 1994). The linkage groups were determined by grouping two points that were afterwards ar-ranged by multipoint analyses. The groups were also con-structed with markers from both linkage phases.
Once the maps of each variety were constructed, the number, size and composition of the linkage groups, the length of the maps, the linear order and the distances among
the markers were compared to the results obtained by Oliveiraet al.(2004). These authors used all markers to construct maps ofCitrus, regardless of the absence or pres-ence of skewed segregation.
The alterations in the map distances of adjacent mark-ers caused by the removal of markmark-ers with a skewed segre-gation were analyzed. The position of the markers with a skewed segregation in the linkage groups (at the end of the groups or between markers with the expected segregation) was correlated with the conservation of the distances and the order of non-skewed segregation markers. The correla-tion among the distances of the markers with an expected segregation in the absence and presence of skewed markers at intermediate positions was also evaluated.
Results and Discussion
Significant deviations in the rates of segregation of the markers in relation to the proportion of expected Men-delian segregation (1:1) were observed at several levels in genetic linkage maps ofCitrusobtained from interspecific and intergenera hybridizations, with extreme values rang-ing from 22.2% to 61% for p < 0.05. In the present study, the ‘Pêra’ variety showed 61% (p < 0.05) and 48% (p < 0.01) of the markers with a skewed segregation, while ‘Cravo’ mandarin had 26.4% (p < 0.05) and 15.1% (p < 0.01). The genetic nature ofCitrusfavors deviations in marker segregation in the progenies, frequently with selec-tion during embryo formaselec-tion (pre and/or post-zygotic stages) and during the development of the plants. Thus,
Citrusis an appropriate model for studying the effects of these markers in genetic linkage maps of perennial species.
A comparison of the maps constructed with markers having the expected Mendelian segregation ratios (1:1) at p < 0.05 and p < 0.01 is given in Table 1. Although the
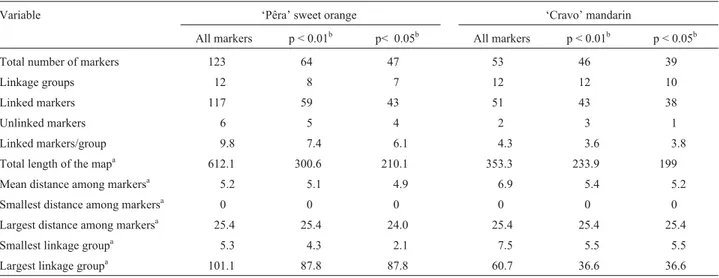
Table 1- The effect of using RAPD markers with different levels of skewed segregation on the construction of linkage maps forC. sinensisOsb. ‘Pêra’ andC. reticulataBlanco ‘Cravo’.
Variable ‘Pêra’ sweet orange ‘Cravo’ mandarin
All markers p < 0.01b p< 0.05b All markers p < 0.01b p < 0.05b
Total number of markers 123 64 47 53 46 39
Linkage groups 12 8 7 12 12 10
Linked markers 117 59 43 51 43 38
Unlinked markers 6 5 4 2 3 1
Linked markers/group 9.8 7.4 6.1 4.3 3.6 3.8
Total length of the mapa 612.1 300.6 210.1 353.3 233.9 199
Mean distance among markersa 5.2 5.1 4.9 6.9 5.4 5.2
Smallest distance among markersa 0 0 0 0 0 0
Largest distance among markersa 25.4 25.4 24.0 25.4 25.4 25.4
Smallest linkage groupa 5.3 4.3 2.1 7.5 5.5 5.5
Largest linkage groupa 101.1 87.8 87.8 60.7 36.6 36.6
a
Quantified variables are in centiMorgan (cM) units. b
‘Pêra’ variety had a higher number of markers when com-pared to those of ‘Cravo’ mandarin, primarily because of a high heterozygous index (Oliveiraet al.,2002), the number of markers in both varieties in the linkage map was very similar after removing the markers that had a skewed seg-regation.
Practically, no alteration in the number of linkage groups of ‘Cravo’ mandarin was observed when the mark-ers with a skewed segregation were excluded. On the other hand, in ‘Pêra’ sweet orange, 12 groups were obtained when the map was constructed with all of the markers, whereas only seven and eight groups were obtained for maps constructed with markers that had the expected Men-delian segregation ratio (1:1) at p < 0.05 and p < 0.01, re-spectively. This occurred because the markers with a skewed segregation in ‘Cravo’ mandarin were present in a smaller percentage, and normally at the extremities of the linkage groups, while in ‘Pêra’ sweet orange, there were several linkage groups composed exclusively of markers with a skewed segregation (five groups at p < 0.05 and four at p < 0.01). In this case, removal of the markers with a skewed segregation resulted in the exclusion of the entire corresponding linkage groups.
The maps of both varieties showed no division of linkage groups when the markers with a skewed segrega-tion were removed. Cristofaniet al.(1999) showed that the number of linkage groups was inversely proportional to the number of markers because of the division of some groups caused by the absence of markers at intermediate positions. This trait was probably not seen here because of the short distance among the map markers and also because of the concentration of markers with a skewed segregation found in certain linkage groups or only at their extremities.
The segregation of the markers in the progeny studied showed low recombination frequencies and are therefore located very close to one another in the linkage groups. The average distance between adjacent markers varied from 4.9 to 5.2 cM for ‘Pêra’ sweet orange and from 5.2 to 6.9 cM for ‘Cravo’ mandarin. The values for the highest distance between adjacent markers for both varieties were con-served, thus preventing the formation of gaps, but causing a decrease in the average distance among markers after the exclusion of those with a skewed segregation (Table 1). Hence, the use of a cross with a high number of progenies (94) allowed the identification of distances among very close markers. The presence of a high amount of heterochromatin in the chromosomes ofCitruspartially ex-plains the tendency of markers to concentrate at certain po-sitions in the linkage groups (Guerra, 1993).
The number of unlinked markers in the maps of both varieties decreased when the markers with a skewed segre-gation were removed (Table 1). These results were initially though to contradict the theories related to mapping since, according to Liou (1990), as the number of markers de-creases in a map the number of unlinked markers inde-creases.
However, the reduction in the number of markers seen here was not random, but was caused by the exclusion of mark-ers with a skewed segregation and that theoretically had a lower probability of linkage.
When the markers with a skewed segregation were re-moved, there was a proportional decrease in the absolute number of linked markers, in the number of linked markers per linkage group, in the size of the linkage groups, and in the total length of the maps of both varieties. Consequently, there was a lower coverage of the genome (Table 1).
Theoretically, the distances and the order of mapped markers should not change in the linkage groups when new markers are included or excluded. Small variations in the distances can be explained by the occurrence of double crossing overs, which are not very frequent between adja-cent markers, whereas significant variations should only occur when the maps are constructed with a small number of markers (Liu , 1998).
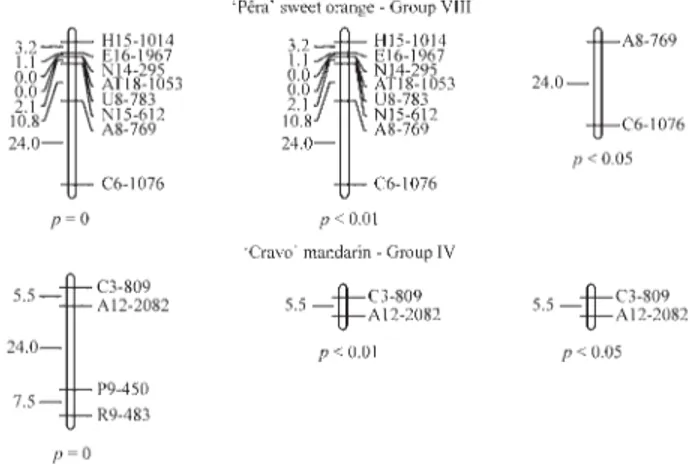
The majority of skewed markers, 98.4% in ‘Pêra’ sweet orange and 96.2% in ‘Cravo’ mandarin, mapped at the extremities of the linkage groups and, in some cases, made up the entire linkage group. Similar behavior has been documented by others (Caiet al.,1994; Luroet al.,
1994; Cristofaniet al.,1999). In ‘Pêra’ sweet orange, the markers with a skewed segregation were located at the ex-tremities of four groups and formed five other complete groups, to give a total of 12 groups. In the case of ‘Cravo’ mandarin, four groups were found at the extremities and two others were completely formed, to give a total of 12 (p < 0.05). In these cases, removal of the markers with a skewed segregation did not alter the distances of the ex-pected segregation markers (Figure 1).
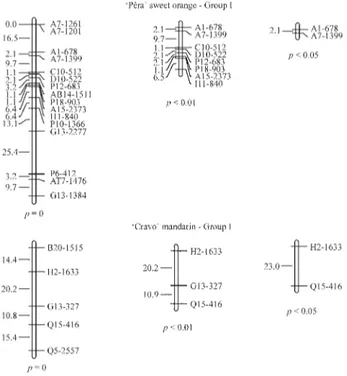
A small number of markers with a skewed segrega-tion occurred among the markers with an expected Mende-lian segregation in the linkage groups. Two such markers
were found among the 123 markers in the maps of ‘Pêra’ sweet orange (AB14-1511 and B10-1986) and two among the 53 markers in the maps of ‘Cravo’ mandarin (G13-327 and E19-1282). In three cases (AB14-1511, B10-1986 and G13-327), the removal of markers with a skewed segrega-tion from the linkage groups led to alterasegrega-tions in the dis-tances of the adjacent markers that showed the expected Mendelian segregation (Figures 2 and 3). For the marker B10-1986, there were also alterations in the order of the re-maining markers in the linkage groups (Figure 3). Such al-terations have been documented by Jarrellet al.(1992) in maps of otherCitrusspecies. The removal of the markers G13-327 and E19-1282 did not alter the order because only two markers were left in the respective linkage groups.
In some linkage groups, the exclusion of markers with a skewed segregation located at the extremities altered the distances by only 0.1 cM. These changes were probably not significant since they occurred only in the marker that occupied the extremity of the group. An exception was seen with the removal of the AV5-1555 marker of ‘Cravo’ man-darin, which also caused alterations in the order of the markers (Figure 3). In this case, the marker was considered to be an artifact that resulted from the limitations of the RAPD technique (Grattapaglia and Sederoff, 1994).
The alterations in the distances, expressed in map units, were significantly higher when the markers with a skewed segregation located among those with the expected segregation were removed. The interference varied from 11.8% to 104.8% in the maps studied, with a tendency to in-crease the distances in the presence of the skewed segrega-tion markers. A linear correlasegrega-tion (r2= 0.91) was observed among the distances of the markers with the expected seg-regation in the absence and presence of markers with a skewed segregation. This correlation demonstrated that the presence of markers with a skewed segregation located among the markers with an expected segregation increased the distance among the markers by 1.485 fold for each cM. The existence of this correlation and, consequently, of a factor or equation for adjustment needs to be confirmed by adding new markers to the maps.
Every time a marker with a skewed segregation is added to linkage maps, there is a possibility that the dis-tances may be altered, and this could jeopardize the identi-fication of QTLs and the associated improvement programs (Caiet al.,1994; Luroet al.,1994). Therefore, the markers to be used in constructing the maps should be selected based on the degree of alteration caused by each marker. The markers with skewness that occur rarely among the markers with the expected segregation should be excluded or, if possible, have their distances corrected to prevent arti-facts. On the other hand, the markers with a skewed segre-gation that are clustered and located at the extremity of groups or that completely occupy the linkage groups can be considered to be derived from chromosomal regions with structural differences (Caiet al., 1994), from genetic
re-Figure 2- Partial linkage map ofCitrusshowing the effect of excluding markers with a skewed segregation that are located within the linkage groups ofC. sinensisOsb. ‘Pêra’ andC. reticulataBlanco ‘Cravo’. The linkage groups were constructed using MAPMAKER with a pseudo-testcross strategy, a Kosambi function, LOD≥6.0 andθ ≤ 0.40. p = 0, p < 0.05 and p < 0.01 refer to the probability of the expected Mendelian segregation ratio (1:1) of the markers used to construct the map.
combination inhibited in heterochromatin-rich areas, from close association to the centromeres or telomeres, and/or from the expression of genes that affect the viability under selection (Grattapaglia and Sederoff, 1994). In all cases, the inclusion of such markers in the maps is essential for ge-netic studies and mapping.
Conclusion
The comparison of linkage maps with and without markers that have a skewed segregation is essential for un-derstanding the genetics of a species and for selecting suit-able markers for mapping studies. As shown here, most markers with a skewed segregation were located at the ex-tremities of the linkage groups or formed entire linkage groups. The location of markers with a skewed segregation in a given linkage group generally affected the extent to which the genetic distances were altered. However, the in-clusion of markers with a skewed segregation positioned at extremities of the linkage groups usually did not markedly affect the genetic distances of markers with an expected segregation. In contrast, the inclusion of markers with a skewed segregation located within linkage groups usually significantly altered the genetic distances of markers with an expected segregation. Although most markers with a skewed segregation can be included in linkage maps, it is still necessary to assess the interference of each marker in the genetic distances of markers with an expected segrega-tion. Since these conclusions are based onCitrus, they may not be wholly applicable to other species.
References
Barrett HC (1985) Hybridization ofCitrusand related genera. Fruit Var J 39:11-16.
Cai Q, Guy CL and Moore GA (1994) Extension of the linkage map in Citrususing random amplified polymorphic DNA (RAPD) markers and RFLP mapping of cold-acclimation-responsive loci. Theor Appl Genet 89:606-614.
Cristofani M, Machado MA and Grattapaglia D (1999) Genetic linkage maps ofCitrus sunkiHort. ex. Tan. andPoncirus tri-foliata(L.) Raf. and mapping of citrus tristeza virus resis-tance gene. Euphytica 109:25-32.
Crouzillat D, Lerceteau E, Petiard V, Morera J, Rodriguez H, Walker D, Phillips W, Ronning C, Schnell R, Osei J and Fritz P (1996)Theobroma cacaoL.: A genetic linkage map and quantitative trait loci analysis. Theor Appl Genet 93:205-214.
Ferreira ME and Grattapaglia D (1998) Introdução ao Uso de Marcadores Moleculares em Análise Genética. Embrapa-Cenargen, Brasília, 220 pp.
Gmitter Jr. FG, Xiao SY, Huang S, Hu XL, Garnsey SM and Deng Z (1996) A localized linkage map of the tristeza virus resis-tance gene region. Theor Appl Genet 92:688-695.
Grattapaglia D and Sederoff R (1994) Genetic linkage maps of Eucalyptus grandis and Eucalyptus urophylla using a
pseudo-testcross: Mapping strategy and RAPD markers. Genetics 137:1121-1137.
Guerra MS (1984) Cytogenetics of Rutaceae. II. Nuclear DNA content. Caryologia 37:219-226.
Guerra MS (1993) Cytogenetics of Rutaceae. V. High chromo-somal variability inCitrusspecies revealed by CMA/DAPI staining. Heredity 71:234-241.
Jarrell DC, Roose ML, Traugh SN and Kupper RS (1992) A ge-netic map of citrus based on the segregation of isozymes and RFLPs in an intergeneric cross. Theor Appl Genet 84:49-56. Kijas JMH, Thomas MR, Fowler JCS and Roose ML (1997)
Inte-gration of trinucleotide microsatellites into a linkage map of Citrus. Theor Appl Genet 94:701-706.
Kosambi DD (1944) The estimation of map distance from recom-bination values. Ann Eugenet 12:172-175.
Lander ES, Green P, Abrahamson J, Barlow A, Daly MJ, Lincoln SE and Newburg L (1987) Mapmaker: An interactive com-puter package for constructing primary genetic linkage maps of experimental and natural populations. Genomics 1:174-181.
Liou PC (1990) A molecular study of citrus genome through re-striction fragment length polymorphism and isozyme map-ping. PhD Thesis, University of Florida, Gainesville. Liu BH (1998) Statistical Genomics: Linkage, Mapping and QTL
Analysis. CRC Press, Boca Raton, 611 pp.
Luro F, Lorieux M, Laigret F, Bové JM and Ollitrault P (1994) Genetic mapping of an intergenericCitrushybrid using mo-lecular markers. Fruits 49:404-408.
Mestre PF, Asins MJ, Pina JA, Carbonell EA and Navarro L (1997) Molecular markers flanking citrus tristeza virus re-sistance gene fromPoncirus trifoliata(L.) Raf. Theor Appl Genet 94:458-464.
Moore GA, Tozlu I, Weber CA and Guy CL (2000) Mapping quantitative trait loci for salt tolerance and cold tolerance in Citrus grandis(L.) Osb. xPoncirus trifoliata(L.) Raf. hy-brid populations. Acta Horticulturae 535:37-45.
Oliveira RP, Cristofani M, Vildoso CIA and Machado MA (2002) Diversidade genética entre híbridos de tangerina Cravo’ e laranja ‘Pêra’ utilizando marcadores RAPD. Pesquisa Agro-pecuária Brasileira 37:479-484.
Oliveira RP, Cristofani M, Vildoso CIA and Machado MA (2004) Genetic linkage maps of ‘Pêra’ sweet orange and ‘Cravo’ mandarin with RAPD markers. Pesquisa Agropecuária Bra-sileira 39:159-165.
Roose ML, Jarrell DC and Kupper RS (1992) Genetic mapping in aCitrusxPoncirusF2population. Proc Int Soc Citriculture
7:210-213.
Roose ML, Fang D, Cheng FS, Tayyar RI, Federici CT and Kupper RS (2000) Mapping the Citrus genome. Acta Horticulturae 535:25-32.
Soost RK and Cameron JW (1975)Citrus. In: Janick J and Moore JN (eds) Advances in Fruit Breeding. Purdue University Press, West Lafayette, pp 507-540.
Williams JGK, Kubelik AR, Livak KJ, Rafalski JA and Tingey SV (1990) DNA polymorphisms amplified by arbitrary primers are useful as genetic markers. Nucleic Acids Res 18:6531-6535.