Short Report
Printed in Brazil - ©2014 Sociedade Brasileira de Química0103 - 5053 $6.00+0.00S
*e-mail: [email protected]
Ischemic Stroke Progress Evaluation by
31P NMR-Based Metabonomic of Human Serum
Caroline W. P. S. Grandizoli,a Marcos C. Lange,b Felipe T. M. Novak,b
Francinete R. Camposc and Andersson Barison*,a
a NMR Center, Department of Chemistry, Paraná Federal University (UFPR), 81530-110 Curitiba-PR, Brazil
b Neurology Division, Hospital de Clínicas, Paraná Federal University (UFPR), 80060-900 Curitiba-PR, Brazil
c Department of Pharmacy, Paraná Federal University (UFPR), 80210-170 Curitiba-PR, Brazil
Neste trabalho, análises quimiométricas de espectros de NMR (ressonância magnética nuclear) de
31P{1H} obtidos de soro sanguíneo permitiram discriminar pacientes que sofreram acidente vascular
encefálico isquêmico daqueles saudáveis devido a alterações na composição química de compostos contendo fósforo. Estes resultados indicam que análises metabonômicas por NMR de 31P permitem
conhecer melhor os mecanismos desencadeados pelo acidente vascular encefálico isquêmico.
In this work, chemometric analyses over 31P{1H} NMR (nuclear magnetic ressonance) spectra of
human blood serum permitted to discriminated ischemic stroke patients from health individuals due to changes in the chemical composition of phosphorus-containing compounds. These results indicate that 31P NMR-based metabonomic allowed insights over the mechanism triggered by ischemic stroke.
Keywords: 31P NMR, metabonomic, chemometric, ischemic stroke, diagnostic, ischemic
stroke biomarkers
Introduction
Stroke is a disease with great impact in society nowadays, being one of the major causes of morbidity and mortality.1 Despite the decrease in stroke mortality rates in
many countries, stroke still is one of main causes of death and disabilities.2 Nevertheless, ischemic stroke diagnosis
is currently done by clinical examination associated with brain image, as magnetic resonance image (MRI) and computed tomography (CT), both with sensitive or specific lower than 100%.3,4 This inaccuracy may result in
misdiagnosis5 and delay in the start of therapy, increasing
the risk of recurrence.3 Similar problems occur in the
prediction of outcome after ischemic stroke, because even the best-validated clinical prognostic models are not able to give an accurate prediction.6 In this sense,
the serum biomarkers present a valuable potential as auxiliary method for diagnosis and prognosis, providing information about the possible etiologic mechanisms related to poor outcome.4,6 However, as stated by Saenger
e Christenson the search of biomarkers is hampered by the diversity and complexity of brain tissues combined
with a lack of knowledge regarding the complete cerebral physiology.7
In this way, 1H NMR-based metabonomics approaches
has been already proposed,8-10 demonstrating that the
technique is useful in the search for biomarkers that allow to diagnostic, prognostic and help in a better comprehension
of ischemic stroke mechanism. Alternatively, 31P NMR
presents some advantages, due to high sensibility of
31P nucleus, wide spectral window and it is present in
several serum metabolites. In this way, 31P NMR has been
employed in some investigations such as in vivo 31P NMR
analyses for brain ischemia investigation11,12 and
tumour-related conditions by serum 31P NMR analyses.13,14 In this
work, 31P NMR-based metabonomics of human blood
serum was employed in the investigation of mechanism triggered by ischemic stroke.
Experimental
Serum samples
in which 80% were submitted to thrombolytic therapy. All patients were submitted to etiological investigation as recommended by the Brazilian Society of Cerebrovascular Diseases.15,16 The control group consisted of 17 healthy
individuals without any cardiovascular risk factor or previous stroke history, matched by age and sex as much as possible with stroke patients. Aliquots of approximately 20 mL from peripheral blood were collected in the first seven days after symptoms onset, transferred to sterile tubes, five min centrifuged at 7000 × g and then freeze-stored at 193 K prior to NMR analyses.
The whole procedure was reviewed and approved by Ethic Committees for human research of Clinical Hospital of Paraná Federal University (Protocol number 1989.156/2009-07).
NMR analyses
31P{1H} NMR spectra were acquired at 303 K on a Bruker
AVANCE 400 NMR spectrometer, operating at 9.4 Tesla, observing 31P at 161.98 MHz, equipped with a 5 mm direct
detection probe with z gradient. For this, aliquots of 400 µL
of serum samples were completed with 200 µL of D2O
and then again centrifuged by ten minutes at 2000 × g on a microcentrifuge. Followed, aliquots of 500 µL were directly transferred into 5 mm NMR tubes and submitted to NMR analyses. The spectra were acquired by applying 30 degree excitation pulses with 1H decoupling during acquisition, 32k
data points, providing a spectral resolution of 2.29 Hz, 2k scans averages, and recycle time of 0.2 s. All NMR spectra were manually phased and baseline corrected, and referenced against the inorganic phosphate (Pi)
31P NMR signal at d 4.95.
Statistical analyses
The 31P{1H} NMR spectra were subjected to multivariate
statistical analyses on Bruker AMIX software version 3.9.7. The 31P{1H} NMR spectra were first normalized to the total
intensity spectra and binned into 1.4 ppm wide buckets, using simple rectangular bucketing method from AMIX over the region of 0.0-7.0 ppm, prior to principal component analyses (PCA). Buckets with variances less than 38% were excluded from PCA, in order to include only signal regions (1.4-2.8 and 4.2-5.6 ppm). Follow, statistical significance analyses were performed according to the method proposed by Goodpaster
et al.,17 with modifications in order to compare disease and
healthy groups with aid of Bruker AMIX software version 3.9.7. Thereby, instead of performing Mann-Whitney U test for loadings significance calculation, it was performed a combination of Kruskal-Wallis and Kruskal-Wallis with a T-test at 95% confidence level. Follow, SIMCA prediction
models were then constructed from PCA with 80% of samples and used to predict the remaining of samples.
Additionally, bucket tables were constructed with aid of AMIX software by binning the regions 1.4-2.8 and 4.2-5.6 ppm into 0.04 ppm wide buckets and exported to Excel software in which classes were added the each sample. The resulting data matrix was then submitted to uni and multivariate analyses in freeware R package muma
(Metabolomics Univariate and Multivariate Analyses). The data were normalized, mean-centered and scaled to each of the available options: pareto, vaste, range, medium and auto. The PCA obtained for each pre-processed data were compared and the best discrimination were selected based in quantitative analysis of cluster separation, according to calculated p-value from F statistics and the proportion of variance explained by each pair of PCs.18 In sequence
orthogonal projection to latent structures discriminant analysis (OPLS-DA) were also performed in order to obtain a better clustering.19 Automated comprehensive univariate
analyses, consisting in a decision tree algorithm that automatically perform rigorous hypothesis tests on each individual variables, were also performed. The resulting volcano and boxplot were analyzed.18
Results and Discussion
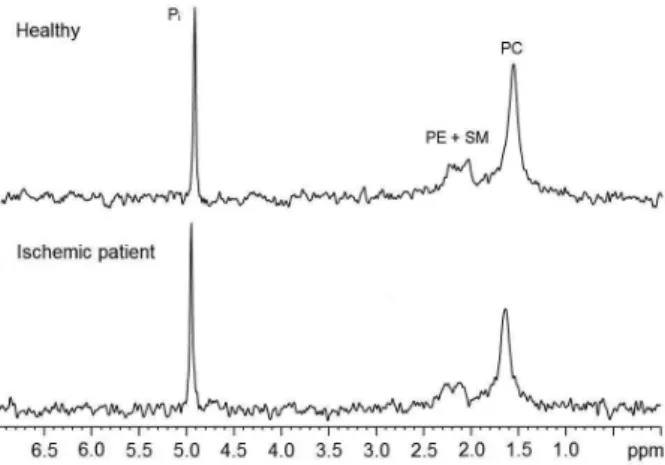
31P{1H} NMR spectra profile (Figure 1) from serum
samples of most patients were very similar, presenting differences mainly in signals intensities. Considering the misinformation in the literature about 31P NMR spectra
calibration, the spectra were referenced against the higher
frequency signal at 4.95 ppm. The 31P NMR chemical
shifts assignments were performed with aid literature data as presented in the Figure 1.13
Figure 1. Representative 31P{1H} NMR spectra of serum samples from a
healthy individual and a ischemic stroke patient with signals assignment according to Kuliszkiewicz-Janus and Baczyński,13 as phosphatidylcholine
The chemometric analyses was performed considering the buckets (i.e., the signals) at 1.4-2.8 and 4.2-5.6 ppm in the
31P{1H} NMR spectra. The first correspond to phospholipids
phosphatidylcholine (PC), phosphoethanolamine (PE) and sphingomielin (SM) while the second to inorganic
phosphate (Pi) (Figure 1). The main advantage of
chemometric analyses such as PCA and PLS-DA is the extreme sensitivity such methods to subtle spectral differences as well as permits an easy visualization of differences between groups. Besides, chemometric-based strategies are much more practical for a first exploratory analysis of the groups then univariate analyses when the number of sample is too large.
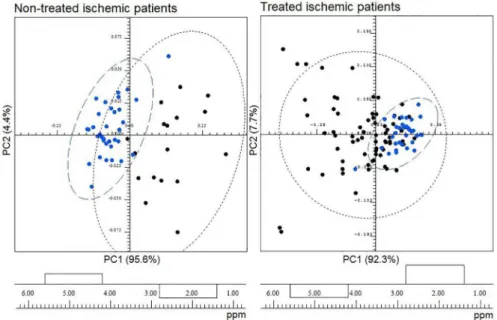
The application of PCA including the two 31P{1H} NMR
spectra regions has permitted to a partial discrimination in PC1 between ischemic stroke patients without thrombolytic therapy and healthy individuals (Figure 2). According to PC1 loadings (Figure 2) the spectra from ischemic stroke patients presented higher levels of Pi and lower levels
of phospholipids when compared to those from healthy individuals. Statistical significance analyses result in a critical p-value of 0.025, revealing both bucket as significant (d 4.90, p-value = 8.15 × 10⁻¹⁶; d 2.10, p-value = 9.55 × 10⁻⁸).
Similar analyses were performed with the 31P{1H} NMR
spectra from patients with brain injury that were submitted to thrombolytic therapy and healthy individuals. Although in this case the discrimination between the groups was not too obvious as in those non-submitted to thrombolytic therapy (Figure 2). Thus, the chemical composition of phosphorus-containing compounds of treated ischemic patients is more similar to the healthy individuals than
those non-treated ischemic patients, probably due to thrombolytic therapy.
In order to quantify and evaluate the statistical significance,
it was used a tool described by Goodpaster et al.20
implemented in muma software, an R package that provides a simple step-wise pipeline for metabolomics univariate and multivariate statistical analyses. In this case, the 0.04 ppm wide buckets were constructed with aid of AMIX software, considering the regions 1.4-2.8 and 4.2-5.6 ppm of 31P{1H} NMR spectra, and submitted to muma. The
best discrimination regarding non-treated patients with thrombolytic therapy and healthy individuals was obtained for PC2 versus PC3 with pareto scaling, which presented a p-value from F statistics of 1.55 × 10⁻¹³ and a explained
variance of 33%.18 In turn, regarding treated patients with
thrombolytic therapy and healthy individuals resulted in a
p-value of 1.99 × 10⁻⁹ and a explained variance of 41.2% for
PC1 versus PC2 from vaste scaling.
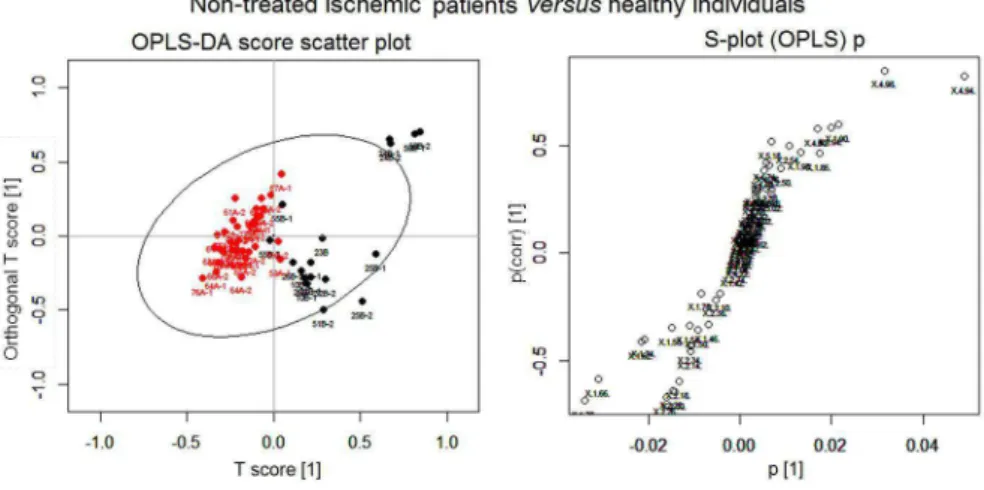
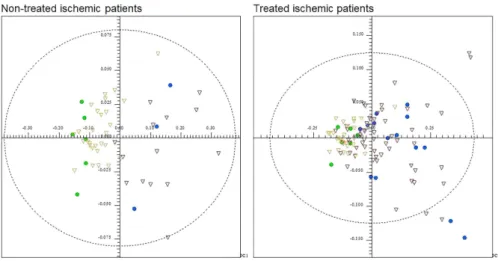
In an attempt to improve discrimination than PCA, the higher classification power OPLS-DA technique was applied.19 This approach showed a partial discrimination
between the groups in both cases, although a better discrimination was obtained for those non-treated patients and healthy individuals than for treated patients and healthy individuals (Figure 3). This technique have an algorithm similar to PLS-DA and is able to correlate information regarding the sample sets and the variables responsible to discriminate them, eliminating undesired or unexpected sources of variation.19 As explained by Gaude et al.,19
the OPLS-DA technique normally results in better clustering than PLS-DA due to its ability to distinguish
Figure 2. PCA of 31P{1H} NMR spectra from serum samples of ischemic stroke patients (black) versus healthy individuals (blue), and its respective PC1
information corresponding to experimental perturbation from orthogonal part of the data, which is independent from the experimental perturbation.
Additionally, univariate analyses were performed in order to get clear informations on how each variable (i.e., the buckets) behaves between the groups non- and treated patients and healthy individuals. Univariate
analyses were performed for each pairwise comparison and graphical outcome were provided as Volcano plots. In these investigation, variables with p-value lower than 0.05 and beyond the positive and negative fold changes (1.2 and 0.8) are considered significant and are plotted in blue,18 while those variables below these double threshold
are plotted in gray (Figure 4). Visualizing Volcano plots
Figure 3. OPLS-DA score and S-plots of the analyses of 31P{1H} NMR spectra from serum samples of ischemic stroke patients (black) and healthy
individuals (red).
for the comparison of both ischemic stroke patients groups and healthy individuals, it is notable that in both cases the buckets at 4.94 and 4.98 ppm, were of high significance, followed by the buckets at 1.70 and 2.34 ppm (Figures 4A and 4B).
In PCA analyses, no significant differences have been observed between non- and treated patients with
thrombolytic therapy. This found was supported by muma
analyses in which there was no satisfactory p-value for a pair of principal components that explain a reasonable amount of the variance. Also Volcano plot shows that none variables were significant (Figure 4C), revealing that the differences in the chemical composition of phosphorus-containing compounds between ischemic patients, independently of thrombolytic therapy, and healthy individuals are higher than those between treated and non-treated groups.
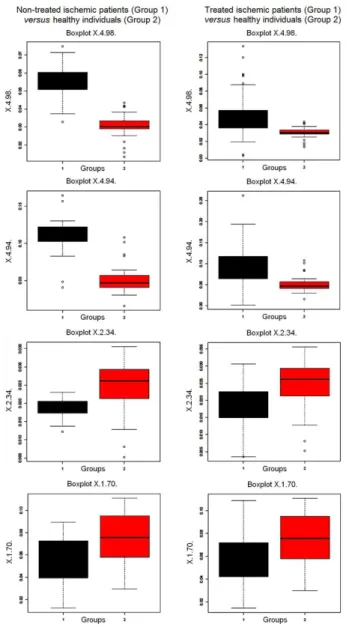
Additional boxplots graphical outcome for univariate analyses were provided in order to help visualize the single variables (i.e., the signals in 31P NMR spectra)
behavior between groups.19 According to the boxplots for
buckets centered at 1.70, 2.34, 4.94 and 4.98 ppm, it is clear that buckets at 4.94 and 4.98 ppm, that correspond to Pi (Figure 1), were present in higher levels in ischemic
patients samples (Figure 5). However, the variation between non-treated patients and healthy individuals was higher than those for treated patients and healthy group (Figure 5). In turn, the buckets centered at 2.34 ppm, correspondent to PE and SM, and 1.70 ppm, correspondent to PC (Figure 1), were present in higher amounts in healthy individuals, while in non- and treated patients they were present in very similar amounts. These founds can be an indicative that thrombolytic therapy is being effective.
Regarding the observed metabolites, Pi is generally
generated by degradation of ATP, a common phenomenon
caused by biological events or endogenous factors.21
Komatsumoto et al. found increase in Pi levels in cerebral
tissues in cats with occlusion of cerebral artery, especially those with acute ischemia, which was related with the decrease of ATP.11 In turn, the decrease in phospholipids
levels is supported by studies in cerebral tissues that related the decrease in phospholipids levels to the occurrence of ischemia, which could be associated to oxidative stress and activation of phospholipases.22 Therefore, the founds in this
work supports that phosphorus-containing compounds can be consider as important biomarkers in the investigation of ischemic stroke.
The PCA between both non- and treated ischemic stroke patients and healthy individuals were used for construction of SIMCA-based prediction models. In this approach, 80% of the samples were considered in models
construction in order to predict the origin of the last 20% samples. The classification model for non-treated ischemic stroke patients and healthy individuals was 100% sensitivity and specific in predict the class of new samples (Figure 6). Moreover, all prediction samples were in confidence ellipsoid model (Figure 6). Otherwise, the classification model for treated ischemic stroke patients and healthy individuals was 85.7% sensitivity and a 100% specific in predict the origin of new samples (Figure 6). However, some samples were out of confidence ellipsoid (Figure 6). Although the number of samples is small, this founds gives a glimpse of the technique potential in disease diagnostic.
Conclusions
This work shows that 31P NMR-based metabonomic of
human blood serum can be a valuable tool for ischemic stroke diagnosis as well as to investigate the mechanism triggered by post-ischemic stroke. The simple analysis over the signal areas in 31P NMR spectra gives insights to
discriminate disease and healthy individuals. Therefore, this investigation shows that phosphorus-containing compounds in human serum can be consider important biomarkers in ischemic stroke investigation and can
be derived from one measurement such as 31P NMR or
others simple analytical tools in order to help in early ischemic stroke diagnosis as well as to provide a better understanding of ischemic stroke mechanism. Moreover, the positive response to thrombolytic treatment observed in the present study should be further established by correlating phosphorus-containing compounds levels with clinical outcome in large studies.
Acknowledgments
The authors are gratefulto CAPES, CNPq (479758/2010-7), Finep, Fundação Araucária and UFPR for financial support and fellowships.
References
1. Roger, V. L.; Go, A. S.; Lloyd-Jones, D. M.; Benjamin, E. J.; Berry, J. D.; Borden, W. B.; Bravata, D. M.; Daí, S.; Ford, E. S.; Fox, C. S.; Fullerton, H. J.; Gillespie, C.; Hailpern, S. M.; Heit, J. A.; Howard, V. J.; Kissela, B. M.; Kittner, S. J.; Lackland, D. T.; Lichtman, J. H.; Lisabeth, L. D.; Makuc, D. M.; Marcus,
G. M.; Marelli, A.; Matchar, D. B.; Moy, C. S.; Mozaffarian, D.; Mussolino, M. E.; Nichol, G.; Paynter, N. P.; Soliman, E. Z.; Sorlie, P. D.; Sotoodehnia, N.; Turan, T. N.; Virani, S. S.; Wong, N. D.; Woo, D.; Turner, M. B.; Circulation 2012, 125, e2. 2. Mirzaei, M.; Truswell, A. S.; Arnett, K.; Page, A.; Taylor, R.;
Leeder, S. R.; J. Neurol. Neurosurg. Psychiatry 2012, 83, 138.
3. Whiteley, W.; Tseng, M. C.; Sandercock, P.; Stroke 2008, 39, 2902.
4. Foerch, C.; Montaner, J.; Furie, K. L.; Ning, M. M.; Lo, E. H.; Neurology 2009, 73, 393.
5. Baird, A. E.; Stroke 2007, 38, 694.
6. Whiteley, W.; Chong, W. L.; Sengupta, A.; Sandercock, P.; Stroke 2009, 40, e380.
7. Saenger, A. K.; Christenson, R. H.; Clin. Chem. 2010, 56, 21. 8. Yang, M.; Wang, S.; Hao, F.; Li, Y.; Shi, X.; Talanta 2012, 88,
136.
9. Chen, H. J.; Shen, Y. C.; Lin, C. Y.; Tsai, K. C.; Lu, C. K.; Shen, C. C.; Lin, Y. L.; Metabolomics 2012, 8, 974.
10. Jung, J. Y.; Lee, H. S.; Kang, D. G.; Kim, N. S.; Cha, M. H.; Bang, O. S.; Ryu, D. H; Hwang, G. S.; Stroke 2011, 42, 1282. 11. Komatsumoto, S.; Nioka, S.; Greenberg, J. H.; Yoshizaki, K.;
Subramanian, V. H.; Chance, B.; Reivich, M.; J. Cereb. Blood Flow Metab. 1987, 7, 557.
12. Roucher, P.; Meric, P.; Coreza, J. L.; Mispelter, J.; Tiffon, B.; Lhoste, J. M.; Seylaz, J.; Brains Res. 1991, 550, 54.
13. Kuliszkiewicz-Janus, M.; Baczyński, S.; Magn. Reson. Med.
1996, 35, 449.
14. Sullentrop, F.; Moka, D.; Neubauer, S.; Haupt, G; Engelmann, U.; Hahn, J.; Schicha, H.; NMR Biomed. 2002, 15, 60. 15. Sociedade Brasileira de Doenças Cerebrovasculares.; Arq.
Neuropsiquiatr. 2002, 60, 675.
16. Raffin, C. N.; Fernandes, J. G.; Evaristo, E. F.; Siqueira Neto, J.
Figure 6. SIMCA prediction models based on PCA of 31P{1H} NMR spectra from serum samples of ischemic stroke patients (red triangles) versus healthy
I.; Friedrich, M.; Puglia, P.; Darwich, R.; Arq. Neuropsiquiatr.
2006, 64, 342.
17. Goodpaster, A. M.; Romick-Rosendale, L. E.; Kennedy, M. A.; Anal. Biochem. 2010, 401, 134.
18. Gaude, E.; Chignola, F.; Spiliotopoulos, D.; Spitaleri, A.; Ghitti, M.; Garcia-Manteiga, J. M.; Mari, S.; Musco, G.; Curr. Metabolomics 2013, 1, 180.
19. Trygg, J.; Wold, S.; J. Chemometrics 2002, 16, 119.
20. Goodpaster, A. M.; Kennedy, M. A.; Chemometr. Intell. Lab.
2011, 109, 162.
21. Haque, S.; Shima, Z. F.; J. Teachers Assoc. 2006, 19, 13. 22. Drgová, A.; Likavcanova, K.; Dobrota, D.; Gen. Physiol.
Biophys. 2004, 23, 337.
Submitted: January 18, 2014