Article
Printed in Brazil - ©2014 Sociedade Brasileira de Química0103 - 5053 $6.00+0.00A
*e-mail: [email protected]
ZnO Prepared by Solution Combustion Synthesis:
Characterization and Application as Photoanode
Adriana C. Lucilha,a Renata Afonso,a Paulo R. C. Silva,b Luiz F. Lepre,c
Rômulo A. Andoc and Luiz H. Dall’Antonia*,a
aLaboratório de Eletroquímica e Materiais, Departamento de Química, Centro de Ciências Exatas, Universidade Estadual de Londrina, CP 6001, 86051-990 Londrina-PR, Brazil
bLaboratório de Filmes Finos e Materiais, Departamento de Física, Universidade Estadual de Londrina, CP 10011, 86057-970 Londrina-PR, Brazil
cLaboratório de Espectroscopia Molecular, Instituto de Química, Universidade de São Paulo, 05508-000 São Paulo-SP, Brazil
No presente trabalho foram confeccionados de maneira simples e eficiente fotoeletrodos baseados em ZnO produzidos a partir de síntese de combustão, diretamente na superfície de óxido de índio dopado com estanho (ITO), na presença de diferentes combustíveis: ácido cítrico, glicina e ureia, submetidos a tratamento térmico em 500 e 600 oC. Os filmes foram caracterizados
por análise termogravimétrica, difratometria de raios X, Raman, refletância difusa, microscopia eletrônica de varredura e medidas eletroquímicas, na presença e ausência de luz. O poder redutor de cada combustível investigado, bem como baixas temperaturas de tratamento térmico foram determinantes para a área superficial disponível dos materiais de ZnO formados. A completa conversão a óxido de zinco a baixas temperaturas de calcinação, bem como o tamanho das partículas foram determinantes para a eficiência fotoeletrocatalítica. O fotoeletrodo obtido ao utilizar a glicina como combustível da síntese e tratado a 500 oC, por 2 h, apresentou melhor resposta em relação
a fotocorrente (103 µA cm-2 mg-1) e aos parâmetros cinéticos (22,9 × 10⁻³ min-1 cm-2 mg-1) para a
fotoeletrocatálise do corante azul de metileno, sob irradiação UV.
In this work photoelectrodes based on ZnO produced from combustion synthesis were prepared in a simple and efficient way, directly on the surface of indium tin oxide (ITO), in the presence of different fuels: citric acid, glycine and urea, and undergoing heat treatment at 500 and 600 oC.
The films were characterized by thermogravimetric analysis, X-ray diffraction, Raman, diffuse reflectance spectroscopy, scanning electron microscopy and electrochemical measurements in the presence and absence of light. The reducing power of each fuel was investigated, as well as low temperature heat treatment was crucial to the available surface area of the formed ZnO materials. The complete conversion to zinc oxide at low calcination temperatures, as well as the particle size were crucial for the photoeletrocatalytic efficiency, since the photoelectrode fuel obtained with glycine and treated at 500 °C showed better response of the photocurrent (103 µA cm-2 mg-1) and
the kinetic parameters (22.9 × 10⁻³ min-1 cm-2 mg-1) for the photoelectrocatalysis of methylene
blue dye under UV irradiation.
Keywords: zinc oxide, combustion solution synthesis, discoloration, photocurrent, methylene
blue
Introduction
The semiconductor oxides have been shown as interesting materials for both photoeletrocatalytic and photocatalytic remediation of organic contaminants,
physical properties for electronic and optical applications.6-9 In addition, ZnO has a direct electron transition and highly organized crystalline structure. These features allow the material to absorb higher energy quantity for the electronic transitions to occur. The high crystallinity of ZnO is considered an important feature of the catalytic efficiency.
The application of ZnO in photoelectrocatalysis10 implies its use as a photoelectrode,11,12 which applies fixed potential under irradiation, which generates a potential gradient that enables the separation process of the charge carriers (h+/e–). The use of this type of photocatalyst rather than particles in suspension provides certain advantages such as reducing the aggregation and sedimentation and increased interaction with the incident light. Accordingly, the application of electrochemical principles has allowed improvement in the efficiency of photocatalytic processes.13-15
Furthermore, synthesis of oxide semiconductors has been performed under unfavorable conditions: concerning the energy requirements and long time duration. Moreover, there is difficulty with the size, distribution and purity of the materials produced. Thus, the solution combustion synthesis (SCS), which uses the metal precursor solution and an organic fuel, has received considerable attention as a method which has important characteristics as precursors: environmentally safe, simple and fast production of the material16-19 Moreover, it is interesting to note the exothermicity of the combustion reaction, as well as extensive gas release during the process, which enhances the production of highly crystalline materials, thin, porous, non-agglomerated and nanoscaled;16 these are important characteristics for the catalytic efficiency of the material. Another important aspect of this synthesis remains in its intrinsic ability to alter the chemical composition of the solid product and the reaction yield, by varying the precursor (metal salt or fuel).16
The influence of different fuels in the SCS is interesting, distinguishing between these with respect to the amount of gases released during combustion, as well as the temperature of the flame ignition. These factors affect the size and morphology, optical and electronic characteristics of the products, as mentioned earlier. Potti and Srivastava20 investigated the combustion synthesis of ZnO using different fuels in solution (citric acid, dextrose, glycine, oxalyl dihydrazide, oxalic acid, and urea). The presence of pronounced hysteresis in N2 adsorption-desorption isotherm curves indicated the three-dimensional network arrangement of pores in the ZnO samples prepared using dextrose and urea as fuels. Moreover, samples using glycine and oxalyl dihydrazide as fuel exhibited higher particle sizes as compared to other samples. The sample
morphology also varied according to the fuel, samples synthesized with dextrose seems to be the most porous, whereas urea seems to be the least porous. The structure using oxalic acid and urea presents cylindrical particles. These fuels present a higher fuel:oxidizer molar ratio. On the other hand, other fuels show spherical particles; however, their particle size distribution seems to be varied. These fuels present a lower fuel:oxidizer molar ratio. It has been observed that some correlation exists between the structure type and fuel:oxidizer molar ratio. The oxide produced using oxalic acid as fuel promoted better photocatalysis for the degradation and discoloration of Orange G azo dye. Deorsola and Vallauri21 analyzed the influence of the type of fuel (citric acid, glycine and urea) in the synthesis of ZnO. Samples obtained using glycine as fuel present the highest values for specific surface area when compared with samples from other fuels. Also, the morphology observed was also dependent of the fuel used during the synthesis process, samples with citric acid and urea as fuel showed the presence of strongly agglomerated nanoparticles; however, samples obtained with glycine as fuel showed the lowest degree of agglomeration and the distribution of the particles size was narrower and more uniform. The similar characteristics of samples with citric acid and urea as fuel were attributed to the very similar behavior in terms of exothermicity, reaction velocity and development of gases using those fuels.
The search for photoelectrodes with high efficiency based on ZnO has generated intense research in the development of new materials,24-27 in order to improve and/or enhance their photoelectrochemical, catalytic and surface characteristics.28,29 To the best of the knowledge of the authors the production of ZnO photoelectrodes by direct combustion synthesis process directly on top of ITO glass has not been described. Moreover, the effect of fuel type on the structural, optical, textural, and photocatalytic degradation abilities of ZnO photoelectrodes synthesized through the SCS route has not been investigated yet, and how different fuels affect ZnO electrode properties obtained by combustion in solution. This manuscript describes how the synthesis of ZnO by SCS route was performed directly on the surface of conducting substrate (indium tin oxide, ITO) allowing greater adherence to photoanodes. In this way, this study aims to prepare, in a simple and proficient way, photoelectrodes based on ZnO produced from combustion synthesis in the presence of different fuels: citric acid, glycine and urea, undergoing heat treatment at 500 and 600 oC and study its properties as photoanode in photoelectrocatalysis applied to the methylene blue dye.
Experimental
Materials
Methylene blue dye (C16H18ClN3S.3H2O, CI 52015) was used without prior purification. Other reagents, such as zinc nitrate hexahydrate (Zn(NO3)2.6H2O, Synth, 99.4%), glycine (C2H5NO2, Vetec, 98.5-101.5%), citric acid (C6H8O7, Synth, 99.5%), urea (NH2CONH2, Nuclear, 99.0%), ammonium hydroxide (NH4OH, Biotec, 28.0-30.0%), nitric acid (HNO3, Biotec, 65.0%) and anhydrous sodium sulfate (Na2SO4, Biotec, 99.0%) were of analytical grade. The solutions were prepared using ultrapure water.
Synthesis of ZnO photoelectrodes (ITO/ZnO) applying solution combustion
Solutions containing 0.76 mol L-1 Zn(NO
3)2.6H2O and 1.64 mol L-1 fuel (citric acid, glycine and urea) of equal volume were mixed and homogenized in a magnetic stirrer at room temperature, keeping the fuel:cation ratio equal to unity.30 Concentrated NH
4OH and/or HNO3 were added until pH 7.0 was reached. The resulting solution was left in the oven at 80 oC for 20 h, in order to obtain a gel, which was diluted with appropriate amount of deionized water. Five-layer films were prepared by casting the gel on a glass slice covered with a conducting layer of ITO. Between
layers a treatment was conducted at 100 oC for 10 min and after 5 layers were deposited, the film was submitted to a thermal treatment at 500 to 600 oC for 2 h.
Characterization
Thermogravimetric analysis (TGA) measurements of the gels were performed using the Universal V4.5a TA equipment under air atmosphere at 25 to 1000 ºC, with a heating rate of 10 °C min-1. The alumina was used as reference substance. X-ray diffractograms (XRD) were obtained by the powder method at 40 kV and 30 mA, using the PANalytical X’Pert PRO MPD equipment with Cu-Kα
radiation source. The adjustment of the diffractograms of the samples was performed by the Rietveld refinement using the software GSAS-EXPGUI. The quality of the refinements was measured using the control parameters
χ2 and Rp, from equations 1 and 2, respectively, which are statistical tests that show how much the calculated crystal parameters are close to real values.
(1)
(2)
wherein wi = 1/yi, yi is the intensity measured in the i-th point
and yci is the intensity calculated (teorically) in the i-th point.
The indices “o” and “c” indicate the observed and calculated values, respectively. The vibrational modes of the material powder prepared for spectra were obtained in Raman spectrometer Renishaw System 3000 coupled to a Leica Microscope (Olympus lens objective 50 x). Laser source of Ar+ Melles Griot. Excitation at 488 nm was obtained by a Nd/YAG laser beam with a power of 200 mW. The scanning system was used with an accumulation of 256 scans and spectral resolution of 2 cm-1. The determination of the band-gap energy (Eg) of the powder was estimated using the diffuse reflectance spectrum obtained with the Shimadzu UV-Vis UV-3101 PC. The morphology and structural organization of the prepared powder were characterized by scanning electron microscopy (SEM, Philips FEI Quanta 200).
Electrochemical measurements were performed, in the presence and absence of UV light, by cyclic voltammetry in 5.0 mV s-1 by using the potentiostat/galvanostat AUTOLAB (128N) coupled with three electrodes: an Ag wire as reference, a Pt wire as counter electrode and ZnO films as the working electrode. The electrolytic cell used was a quartz cuvette (1.0 × 1.0 × 4.0 cm3). The supporting electrolyte was 0.1 mol L-1 Na
Photoelectrocalysis measurements
The irradiations were carried out within a box (0.13 × 0.14 × 0.07 m3) internally padded with aluminum foil, using as source of UV irradiation a 15 W Hg vapor lamp, placed horizontally at 2 cm from the electrolytic cell. Chronoamperometry was used to evaluate the discoloration of 2 mL of methylene blue (10.0 µmol L-1) by the application of +1.0 V potential at intervals of predetermined time (0, 10, 20, 40, 60 and 120 min). The discoloration was analyzed through the measurement of absorbance from the electrolyte solution at 664 nm (Ocean Optics USB4000) and the discoloration rate constant, kobs, was determined graphically considering a
kinetic behavior of pseudo-first order.31 Methylene blue was chosen as a molecule model to follow the electrode photoelectroactivity since it presents a very simple chemical structure and electronic spectrum.
Results and Discussion
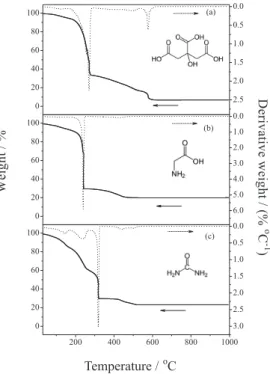
Thermogravimetric analysis (TGA) of gels containing three different fuels - citric acid (26.2 mg sample mass), glycine (25.1 mg sample mass) and urea (39.0 mg sample mass) - showed that the decomposition of the compounds was significantly dependent on fuel used in the synthesis (Figure 1). The formation of ZnO from citric acid was distinguished by five major mass losses (Figure 1a). The first (4.90%) corresponds to a loss of moisture and hydration
of water molecules present in the gel. The second (41.8%) was assigned to the combustion process. The third (20.5%) and fourth (16.4%) losses correspond to the gradual loss of remaining organic residue of combustion. Finally, the fifth loss (9.58%) was attributed to the complete pyrolysis. The residual mass of ZnO was observed as 6.93%.
By using glycine as a fuel (Figure 1b), the reaction was characterized by three steps of mass loss, the first (4.93%) due to loss of water. The second (65.6%), defined by the combustion reaction at 240 °C, and the third (9.40%), characterized by complete pyrolysis with ZnO as a remaining product (20.1%).
When urea was used as fuel, the thermogram was also categorized by five characteristic mass losses (Figure 1c). The first (14.9%) was related to the loss of water present in the sample. Following the merger of the precursor material and fuel (urea, 133 °C) the combustion process starts, characterizing the second weight loss (39.6%). The third (14.9%) and fourth (4.11%) are related to the gradual loss of remaining organic residue of combustion. The fifth loss (2.49%) represents the complete pyrolysis with ZnO residual product (23.3%).
The obtained residual percentages are consistent with expected values, 6.92% (citric acid), 19.2% (glycine) and 22.2% (urea), considered as quantities of fuel mass used for each synthesis and the ratio between them, as well as the mass of each sample used to perform the measurements.
The formation of ZnO occurs at lower temperature when using the fuel glycine (476 °C) as compared to citric acid (552 °C) and urea (525 °C) (Figure 1). This behavior can be explained by the value for combustion heat for citric acid (10.2 kJ g-1), glycine (13.0 kJ g-1) and urea (10.5 kJ g-1),17,23 as well as the amount of each fuel used per mol of zinc
nitrate. Accordingly, the amount of heat generated when citric acid was used as fuel was the highest, followed by glycine and urea. The largest amount of fuel makes the reaction highly explosive and it is not self-propagating, which prevents the completion of the reaction kinetics, and consequently affects the formation of considerable organic byproduct quantities.16 After ZnO formation with temperature augmentation it was not observed any weight change until 1000 °C was reached, this indicates that combustion was complete and no solid state reaction occurs in the samples.
The combustion reaction in solution is characterized as a redox process, wherein the precursor mixture or metal nitrate acts as an oxidizing agent and the organic fuel as a reducing agent.16 The synthesis of ZnO, using citric acid, glycine and urea as fuels can be represented by equations 3, 4 and 5, respectively.
Zn(NO3)2.6H2O + C6H8O7 + 2O2→ ZnO + 6CO2 +
10H2O + N2 (3)
Zn(NO3)2.6H2O + 2NH2CH2COOH + 2O2→ ZnO + 4CO2 + 11H2O + 2 N2 (4)
Zn(NO3)2.6H2O + 2(NH2)2CO + 1/
2O2→ ZnO + 2CO2 +
10H2O + 3N2 (5)
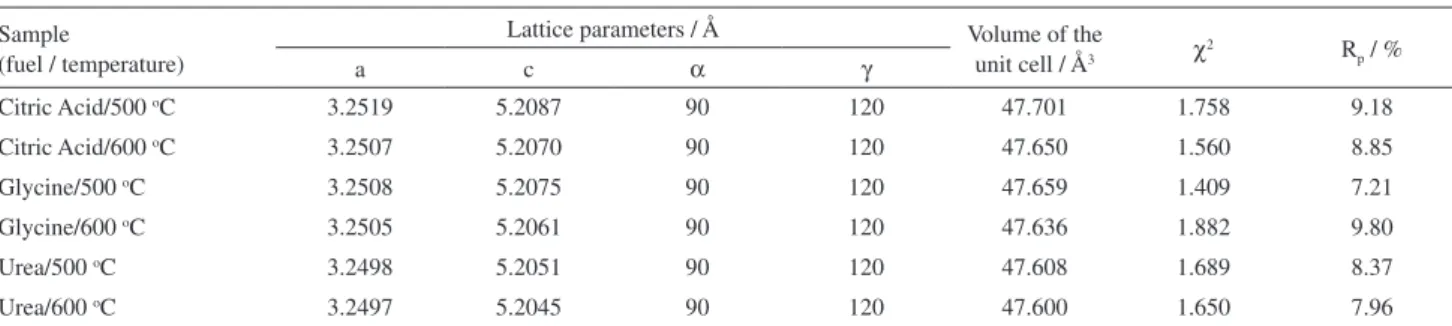
The resulting samples based on the synthesis using different fuels (citric acid, glycine and urea) and thermal treatment temperatures (500 and 600 °C) presented the same diffraction pattern for XRD results (Figure 2). The diffraction patterns indicated good crystallinity, with intense and very well-defined peaks, which allowed
Rietveld refinement of the crystal structures, from a pattern of ZnO (ICSD 67454 or PDF 01-079-2205). The presence of impurities in the samples, due to incomplete combustion, causes no changes in the XRD patterns; it is considered that they are not in their crystalline form. From these results, it was verified that the materials obtained are mostly of ZnO crystals of wurtzite structure, with the parameters of refinement χ2 = 1.66 and Rp = 8.56%. These kind of crystals are characterized by the peaks in 2θ 31.7o (100); 34.4o (002); 36.3o (101); 47.5o (102); 56.6o (110); 62.8o (103) and 67.9o (112),21,22 which belong to the hexagonal system P63mc (186) crystallographic class 6mm (PDF code 01-079-2205), with estimated lattice
parameters a = 3.25 Å and c = 5.21 Å, and volume of the unit cell 47.6 Å3 (χ2 = 1.66; R
p = 8.56%) (Table 1). Due to the low values for χ2 and Rp it may be concluded that crystal parameters obtained by refinement are sufficiently close to the real ones.
Considering the values of lattice parameters and unit cell volume of the synthesized materials, obtained by Rietveld refinement (Table 1), we could verify the effect of both the annealing temperature and the fuel used in the synthesis on the crystalline properties of ZnO. The increase in annealing temperature produced a decrease in volume of the unit cell due to sintering of the material. Now with regard to the fuels used, we observed a decrease in the volume of the unit cell by using citric acid, glycine and urea, respectively. This can be explained by the presence of nitrogen in the molecule, which increases the reducing power of the fuel and the amount of thermally generated gases,16 enabling the reduction of the unit cell crystals of the formed material.
Raman spectroscopy is an effective technique to investigate changes in the vibrational modes in crystalline compounds obtained under different synthesis conditions.32 The ZnO wurtzite structure belongs to the C6v4 space group, with two formulas per primitive cell unit in which all atoms
occupy C3v sites1 (Figure 2 inset). The optical phonons predicted by the group theory, in the center of the Brillouin zone for this structure, are A1 + 2B1 + E1 + 2E2. From
Table 1. Rietveld refinement parameters for the materials of the synthesized ZnO
Sample
(fuel / temperature)
Lattice parameters / Å Volume of the
unit cell / Å3 χ2 Rp / %
a c α γ
Citric Acid/500 oC 3.2519 5.2087 90 120 47.701 1.758 9.18
Citric Acid/600 oC 3.2507 5.2070 90 120 47.650 1.560 8.85
Glycine/500 oC 3.2508 5.2075 90 120 47.659 1.409 7.21
Glycine/600 oC 3.2505 5.2061 90 120 47.636 1.882 9.80
Urea/500 oC 3.2498 5.2051 90 120 47.608 1.689 8.37
Urea/600 oC 3.2497 5.2045 90 120 47.600 1.650 7.96
Figure 2. X-ray diffraction of synthesized ZnO samples using different fuels and temperatures of heat treatment: (a) citric acid, 500 oC; (b) citric
acid, 600 ºC; (c) glycine, 500 oC; (d) glycine, 600 oC; (e) urea, 500 oC;
these, A1 and E1 are polar and have different frequencies of transverse (TO) and longitudinal (LO) optical modes. The E2 phonons are nonpolar and have two wavenumbers, E2 (high) and E2 (low), associated with the vibration of oxygen and zinc in the subnet, respectively. The B1 modes are inactive in Raman spectroscopy.33-36
Raman spectra for ZnO samples synthesized using different fuels and thermal treatment temperatures are shown in Figure 3. From these, it was possible to verify that using citric acid and heat treatment for 2 h at 500 oC (Figure 3a), there is evidence of incomplete formation of ZnO. This can be explained by means of thermogravimetric analysis, which indicated that the formation of ZnO, using the fuel citric acid, occurs only at 552 oC (Figure 1). On the other hand, in materials treated for 2 h at 600 oC (Figure 3b) it is possible to verify the characteristic vibration bands for ZnO wurtzite structure at 436 cm-1, assigned to E
2high mode associated with the vibration of oxygen.
Regarding the fuel glycine, the spectra resulting from the heat treatment for 2 h at 500 to 600 oC (Figures 3c and 3d, respectively) indicate two bands. The first one at 437 cm-1 related to E
2high and the second one at 579 cm-1 is assigned to mode A1 (LO).
Raman spectra for synthesized samples during 2 h at 500 and 600 oC using urea as fuel (Figures 3e and 3f, respectively) show the vibrational modes 2E2 at 331 cm-1,
A1 (TO) at 380 cm-1, E2 (high) at 437 cm-1 and around 580 cm-1, which corresponds to the region A
1 modes (LO) at 574 cm-1 and E
1 (LO) at 583 cm-1. Furthermore, for the samples synthesized with this fuel it was possible to observe a broad band in the region of 850-1200 cm-1 attributed to multi-phonon modes of ZnO.
Based on the spectral analysis it was possible to verify an increasing of in the band intensity of ZnO, with the increase of annealing temperature. This indicates that the higher temperatures increase the purity of the material. Moreover, it was observed that by using citric acid, glycine and urea as fuels, the characteristic bands of ZnO are more evident due to the decrease in fluorescence resulting from the incomplete combustion of organic material. As mentioned before, this can be explained by the increase of reducing ability these fuels (reducing ability: urea > glycine > citric acid).
The values for band-gap energy of synthesized materials were estimated from the UV-Vis diffuse reflectance spectra (Figure 4), using the method proposed by Wood and Tauc, which considers that the energy band-gap is associated with the absorption and the photon energy, αhν= C (hν – Eg)n, and n is a constant associated with the type of electronic
transition. Zinc oxide has direct transition with a value of
n equal to ½.37,38
The values for the band-gap energy of the materials synthesized in this study showed no significant variation when using citric acid and glycine as synthesis fuels. However, when using urea, the absorption region of the material shifts to higher wavelengths, that is, the energy band-gap decreases. This behavior may be related to the quality of crystallinity and changes in the crystallite size and impurities
Figure 3. Raman spectra at 488 nm of ZnO samples synthesized using various fuels and temperatures of the heat treatment: (a) citric acid, 500 oC;
(b) citric acid, 600 ºC; (c) glycine, 500 oC; (d) glycine, 600 oC; (e) urea,
500 oC; and (f) urea, 600 oC.
Figure 4. UV-Vis spectra of the diffuse reflectance of the ZnO samples
synthesized using different fuels and thermal treatment temperature: (—) citric acid, 500 oC; (---) citric acid, 600 oC; (····) glycine, 500 ºC;
present in the material, factors previously observed by X-ray diffraction and Raman scattering spectra.39 The oxide synthesized in presence of glycine at 500 oC showed the highest value of band-gap energy (3.18 eV) (Table 2), since it is less pronounced than bulk ZnO (3.37 eV). Interestingly, the highest value of band gap energy obtained in this study is still smaller than that obtained by Ahmad et al.23 of 3.248 eV, on the effect of the proportion of glycine in the photocatalytic activity of ZnO. Since the same proportion of fuel:oxidant (1:1) was used the band gap showed a value of 3.26 eV. The presence of impurities or by-products generated by incomplete combustion of the sample does not affect the energy band-gap of the ZnO formed.
The images obtained by SEM, with magnifications of 20,000 and 24,000×, showed changes both in morphology and in the structural organization of ZnO particles with the variety of fuel used in the synthesis (citric acid, glycine and urea) (Figure 5). By changing the annealing temperature (500 or 600 oC) it was possible to observe an agglomeration resulting from the fusion of crystallites at higher temperatures. Furthermore, using this technique, it was possible to estimate the average particle size, verifying that the smallest particles were synthesized respectively by using glycine (< 220 nm), citric acid (220-236 nm) and urea (916-1100 nm). Among the syntheses performed using glycine and heat treatment for 2 h at 500 oC, the resulting ZnO particles presented the smallest size, enabling a greater number of active sites available for the surface reactions.40
To evaluate the photoelectrochemical property of the obtained electrodes, photoelectrochemical measurements were conducted in a single compartment electrochemical cell in 0.1 mol L-1 Na
2SO4 solution by the application of +1.0 V potential. As the mass of ZnO deposited varies with the process, the current density has been normalized by the mass deposited on the substrate, jN. During the scan of linear
sweep voltammograms, the electrode was irradiated for 5 s and the light was chopped for 5 s (Figure 6). In the dark a
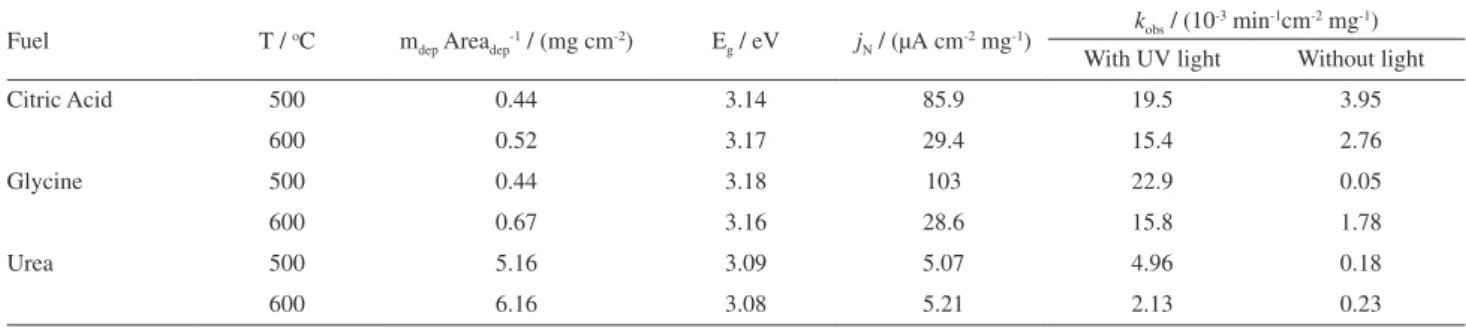
small current density (less than 10-4 µA cm-2 mg-1) can be observed for all electrodes. However, in the UV irradiation process, the current density increases reaching values of 103 µA cm-2 mg-1 for electrodes obtained using glycine as fuel in the solution combustion process and calcined at 500 oC, the best response observed. Furthermore, the lowest values observed for photocurrent (at +1.0 V) under UV irradiation was observed for films obtained with urea as fuel (5.07 µA cm-2 mg-1) (Table 1). In Figure 6, the voltammograms show only the ITO/ZnO photoelectrode obtained using glycine as fuel and calcined at 500 oC. However, the observed behavior was the same for all obtained photoelectrodes.
Table 2. Values of the amount of material deposited per unit area (mdep Areadep-1), band-gap energy for ZnO synthesized using various fuels and the thermal
treatment temperature; current density normalized by the area (1.3 ± 0.1 cm2) and deposited mass; rate of discoloration of methylene blue (10.0 µmol L-1)
in the dark and under UV irradiation normalized by mass of ZnO deposited on the surface of ITO
Fuel T / oC m
dep Areadep-1 / (mg cm-2) Eg / eV jN / (µA cm-2 mg-1)
kobs / (10-3 min-1cm-2 mg-1)
With UV light Without light
Citric Acid 500 0.44 3.14 85.9 19.5 3.95
600 0.52 3.17 29.4 15.4 2.76
Glycine 500 0.44 3.18 103 22.9 0.05
600 0.67 3.16 28.6 15.8 1.78
Urea 500 5.16 3.09 5.07 4.96 0.18
600 6.16 3.08 5.21 2.13 0.23
Figure 5. SEMimages of ZnO samples synthesized using various fuels
and temperatures of heat treatment: (a) citric acid, 500 oC; (b) citric acid,
600 ºC; (c) glycine, 500 oC; (d) glycine, 600 oC; (e) urea, 500 oC; and
Furthermore, it was observed that the photocurrent increases with the augmentation in the characteristic potential of the n-type semiconductor. In addition, it
was observed for all electrodes that during the light chopping the response time of the electrode was rather short, reaching values around 0.40 s. This suggests that the films have excellent transport properties of the charge carriers. In addition, the voltammetric profile indicates that immediately after the UV irradiation, the current density has negligible decay. This indicates the high stability of these photoelectrodes with respect to the process of recombination of charge/holes (h+/e–).28,41-43
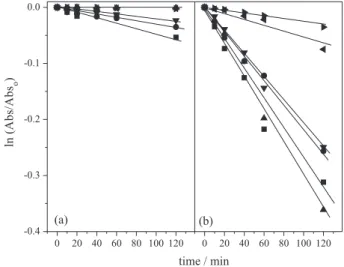
The increase in the intensity of the photocurrent results from the motion of electrons (e–) to the cathode under the applied potential. Thus, it decreases the rate of recombination of charge carriers (h+/e–) in semiconductor surface, increasing photocatalytic efficiency. This justifies the results for the discoloration of 2 mL of 10.0 µmol L-1 methylene blue (Figure 7a inset), by chronoamperometry performed in the dark and under continuous UV irradiation. The absorption spectra of discoloration of methylene blue,
using this photoelectrode, confirm that the discoloration is more effective under UV irradiation than that performed in the dark (only electrochemical degradation) (Figure 7). The discoloration was proven by the decrease in absorbance at 664 nm maximum. All discolorations followed a kinetic law of pseudo-first order31 and the constant rate observed (kobs) was calculated and normalized by the mass of
ZnO deposited (Figure 8 and Table 2). It was possible to observe the highest photoeletrocatalytic capacity of ZnO synthesized with glycine and heat treated at 500 oC for 2 h
Figure 6. Photoelectrochemical response (a) complete and (b) enlarged for the photoelectrode with ZnO produced in presence of glycine and treated at 500 oC, with pulses of 5 s with and without irradiation of
UV light in electrochemical cell with 0.1 mol L-1 Na
2SO4 as supporting
electrolyte, s = 5 mV s-1.
Figure 7. Spectral variations in discoloration of methylene blue (10.0 µmol L-1) in the presence of the ZnO electrode synthesized with
glycine and heat treated at 500 oC: (a) in the dark; and (b) under UV
irradiation, as a function of reaction time: (—) 0 min; (---) 10 min;
(····) 20 min; (-·-) 40 min; (-··) 60 min; and (---) 120 min. Electrochemical measurements were carried out in room temperature and applying +1.0 V. Inset: chemical structure of methylene blue.
Figure 8. Kinetics of methylene blue discoloration (10.0 µmol L-1) under the
(Table 2), in terms of observed constant rate and also by the dye discoloration percentage under irradiation (90.1%) and darkness (2.70%). The results are in agreement with the photocurrent values obtained for this electrode.
The preeminent photoelectrochemical and photoelectrocatalytic results were obtained when glycine was used as fuel during the synthesis, followed by citric acid and urea as well. Also the results suggest that in lower temperature heat treatment (500 oC) the results were enhanced (Table 2). This can be explained by the relative size of the particles obtained using different fuels, as well as the sintering process of the samples by increasing the annealing temperature (600 oC). These factors are directly related to the available surface area of the synthesized materials and, consequently, to the values of current density (jN) and catalytic activity (kobs).
From Table 2 it is possible to observe a significant difference between the values obtained for the bulk quantity of material deposited per unit of the conductive substrate
(ITO) area, using different fuels. This is related to the method of preparation of films by casting and consequently the quality of the obtained gel synthesis. As the best gel homogeneity for the procedure was obtained when using urea as fuel, the greater bulk amount of the material adhered to the substrate was expected.
Sapkal et al.44 verified that ZnO photoelectrodes, obtained by spray pyrolysis, degrade 38.68% of methylene blue during 80 min for the reaction. This percentage is much smaller as we can observe in this manuscript (90.1%), in a lower time of discoloration (120 min). Chatchaia et al.45 related an efficient photoelectrocatalytic discoloration (ca. 80%) when compared with photocatalytic process (ca. 30%) during 120 min, applying a photoelectrode based on WO3/BiVO4.
Satisfactory results found for the application of the materials synthesized in the photocatalytic discoloration of methylene blue can be attributed to the different features that this synthesis provides to the materials.16 In this case, the different morphologies and different particle sizes may provide active sites for adsorption, promoting better dye discoloration. Hariharan described that the use of smaller particles increases the catalytic efficiency due to the increased surface area as well as altering the surface properties.46 Thus, the decrease in particle size can affect the photocatalytic activity of ZnO.
From the comparison between the kobs values and the
results obtained by diffuse reflectance, it was revealed that, while the band-gap energy of the synthesized ZnO decreased when using glycine, citric acid and urea as fuels, respectively, the photocatalytic efficiency was also reduced. The images obtained by SEM showed that the smaller ZnO particles were obtained when using fuels glycine,
citric acid and urea, respectively. Moreover, the increase in the heat treatment temperature of 500 to 600 oC leads to an increase in the size of synthesized ZnO particle. The observed behavior causes a decrease in the available area of the photocatalyst, the substrate available for adsorption and absorption of light, thus affecting the photocatalytic ability of the material. According to the results, the photoelectrode obtained using glycine as fuel and treated at 500 oC showed better photoeletrocatalytic efficiency for discoloration of methylene blue. Therefore, the results obtained led us to infer that the particle size was crucial to the efficiency of photoelectrocatalytic materials obtained by solution combustion at different temperatures and fuel synthesis.
Conclusions
ZnO photoelectrodes were successfully obtained by a simple and efficient method applying solution combustion, allowing the investigation of the type of fuel and the heat treatment temperature influence on the photoeletrocatalytic efficiency of the material. The synthesis conditions affect the heat liberated in the combustion process and the sintering materials and, therefore, their structural, morphological and optical properties, as well as the surface on which electrochemical and catalytic processes occur. The available area determines the efficiency obtained for the photoelectrode discoloration of methylene blue. Thus, the electrode obtained by the synthesis using glycine as fuel and treated at 500 oC during 2 h provided the highest photocurrent density response and best photoelectrocatalytic behavior due to the formation of semiconductor particles of smaller size.
Acknowledgments
The authors wish to thank CNPq, FAPESP and Fundação Araucária (15585/2010), NEMAN (Pronex, 17378/2009) for financial support. A. C. L. and R. A. thank CAPES for scholarships. The authors would like to thank LMEM-UEL for SEM analyses and LEM-USP/SP for Raman analyses. The two anonymous reviewers are also thanked for constructive criticism of an earlier manuscript version.
References
1. Zhang, G.; Finefrock, S.; Liang, D.; Yadav, G. G.; Yang, H.; Fang, H.; Wu, Y.; Nanoscale2011, 3, 2430.
2. Choudhary, S.; Upadhyay, S.; Kumar, P.; Singh, N.; Satsangi, V. R.; Shrivastav, R.; Dass, S.; Int. J. Hydrogen Energy2012,
3. Chen, H. M.; Chen, C. K.; Liu, R.-S.; Zhang, L.; Zhang, J.; Wilkinson, D. P.; Chem. Soc. Rev.2012, 41, 5654.
4. Osterloh, F. E.; Chem. Soc. Rev.2013, 42, 2294.
5. Walter, M. G.; Warren, E. L.; McKone, J. R.; Boettcher, S. W.; Mi, Q.; Santori, E. A.; Lewis, N. S.; Chem. Rev.2010, 110, 6446.
6. Özgür, Ü.; Alivov, Y. I.; Liu, C.; Teke, A.; Reshchikov, M. A.; Doğan, S.; Avrutin, V.; Cho, S.-J.; Morkoç, H.; J. Appl. Phys.
2005, 98, 041301.
7. Ahmad, M.; Zhu, J.; J. Mater. Chem. 2011, 21, 599.
8. Ali, M.; Winterer, M.; Chem. Mater.2010, 22, 85.
9. Fang, Y.; Wang, Y.; Wan, Y.; Wang, Z.; Sha, J.; J. Phys. Chem. C
2010, 114, 12469.
10. Grätzel, M.; Nature2001, 414, 338.
11. Xu, F.; Sun, L.; Energy Environ. Sci. 2011, 4, 818.
12. Kronawitter, C. X.; Vayssieres, L.; Shen, S.; Guo, L.; Wheeler, D. A.; Zhang, J. Z.; Antoun, B. R.; Mao, S. S.; Energy Environ. Sci.2011, 4, 3889.
13. Nowotny, J.; Sorrell, C. C.; Bak, T.; Sheppard, L. R.; Sol. Energy
2005, 78, 593.
14. Kudo, A.; Miseki, Y.; Chem. Soc. Rev.2009, 38, 253. 15. Woodhouse, M.; Parkinson, B. A.; Chem. Soc. Rev.2009, 38,
197.
16. Rajeshwar, K.; de Tacconi, N. R.; Chem. Soc. Rev.2009, 38,
1984.
17. Hwang, C.-C.; Wu, T.-Y.; Wan, J.; Tsai, J.-S.; Mater. Sci. Eng., B
2004, 111, 49.
18. Patil, K. C.; Aruna, S. T.; Mimani, T.; Curr. Opin. Solid State Mater. Sci.2002, 6, 507.
19. Sousa, V. C.; Segadães, A. M.; Morelli, M. R.; Kiminami, R. H. G. A.; Int. J. Inorg. Mater.1999, 1, 235.
20. Potti, P. R.; Srivastava, V. C.; Ind. Eng. Chem. Res.2012, 51,
7948.
21. Deorsola, F. A.; Vallauri, D.; J. Mater. Sci.2011, 46, 781.
22. Hwang, C.-C.; Wu, T.-Y.; Mater. Sci. Eng., B2004, 111, 197. 23. Ahmad, M.; Hong, Z.; Ahmed, E.; Khalid, N. R.; Elhissi, A.;
Ahmad, W.; Ceram. Int.2013, 39, 3007.
24. Chen, H.; Li, W.; Hou, Q.; Liu, H.; Zhu, L.; Electrochim. Acta
2011, 56, 9459.
25. Tang, J.; Zheng, J.-J.; Yu, Y.-T.; Chen, L.; Zhang, N.; Tian, Z.;
Electrochim. Acta2012, 83, 247.
26. Wu, G.; Shen, Y.; Wu, Q.; Gu, F.; Cao, M.; Wang, L.; J. Alloys Compd.2013, 551, 176.
27. Xu, L.; Chen, Q.; Xu, D.; J. Phys. Chem. C2007, 111, 11560.
28. Hsu, C.-H.; Chen, D.-H.; Int. J. Hydrogen Energy2011, 36, 15538.
29. Fitch, A.; Strandwitz, N. C.; Brunschwig, B. S.; Lewis, N. S.;
J. Phys. Chem. C2013, 117, 2008.
30. Kumar, V. R.; Kavitha, V. T.; Wariar, P. R. S.; Nair, S. U. K.; Koshy, J.; J. Phys. Chem. Solids2011, 72, 290.
31. Atkins, P.; de Paula, J.; Physical Chemistry, 8th ed.; Oxford
University Press: Oxford, 2006.
32. Gouadec, G.; Colomban, P.; Prog. Cryst. Growth Charact. Mater.2007, 53, 1.
33. Damen, T. C.; Porto, S. P. S.; Tell, B.; Phys. Rev.1966, 142, 570.
34. Koyano, M.; QuocBao, P.; ThanhBinh, L.; HongHa, L.; NgocLong, N.; Katayama, S.; Phys. Status Solidi A 2002, 193,
125.
35. Fazio, E.; Patanè, S.; Scibilia, S.; Mezzasalma, A. M.; Mondio, G.; Neri, F.; Trusso, S.; Curr. Appl. Phys.2013, 13, 710.
36. Singh, V. P.; Das, D.; Rath, C.; Mater. Res. Bull.2013, 48, 682. 37. Choppali, U.; Garman, B. P.; J. Lumin.2008, 128, 1641.
38. Xue, S. W.; Zu, X. T.; Zhou, W. L.; Deng, H. X.; Xiang, X.; Zhang, L.; Deng, H.; J. Alloys Compd.2008, 448, 21.
39. Weng, M.-H.; Pan, C.-T.; Yang, R.-Y.; Huang, C.-C.; Ceram. Int.2011, 37, 3077.
40. Wang, H.; Xie, C.; Zhang, W.; Cai, S.; Yang, Z.; Gui, Y.;
J. Hazard. Mater.2007, 141, 645.
41. Xiao, F.; Wang, F.; Fu, X.; Zheng, Y.; J. Mater. Chem. 2012,
22, 2868.
42. Hsu, C.-H.; Chen, D.-H.; Nanoscale Res. Lett.2012, 7, 593. 43. Sun, K.; Jing, Y.; Li, C.; Zhang, X.; Aguinaldo, R.; Kargar, A.;
Madsen, K.; Banu, K.; Zhou, Y.; Bando, Y.; Liu, Z.; Wang, D.;
Nanoscale2012, 4, 1515.
44. Sapkal, R. T.; Shinde, S. S.; Waghmode, T. R.; Govindwar, S. P.; Rajpure, K. Y.; Bhosale, C. H.; J. Photochem. Photobiol., B
2012, 110, 15.
45. Chatchaia, P.; Nosakab, A. Y.; Nosakab, Y.; Electrochim. Acta
2013, 94, 314.
46. Hariharan, C.; Appl. Catal., A2006, 304, 55.
Submitted: October 16, 2013 Published online: April 25, 2014