ACTIVE
CONSUMER
PARTICIPATION
IN THE HEALTH
DELIVERY
SYSTEM: AN EVALUATION
OF PATIENT
SATISFACTION1
Paul A. Sommersz
Many people and institutions providing health care ovulook opportunities to collect valuable feedback information from those served. This article describes one reasonably simple and eflective way of collecting and using swh infom- tion.
Introduction
A variety of past studies on health care de- livery have described consumer opinions about the care received, ranges of patient at- titudes, physician conduct, and other vari- ables affecting consumer satisfaction (1-10,. But such studies have generally failed to pro- vide a way of including consumer input on a continuing basis in the appraisal of health ser- vice systems, in order to see if the systems can be improved. This is a real problem, for it is not enough to periodically ask patients what they think of the services provided. Promoting effective changes in a delivery system requires an ongoing partnership between health service consumers and providers. In other words, if the “optimum care” the consumer seeks and the provider is trying to give is to be realized, a joint effort is required.
The question thus is whether health provid- ers can harness the virtually untapped re- source found sitting in their reception areas and examination rooms. I believe that they can; and even though the development of a consumer-oriented delivery system requires some departure from traditional health care
‘Also appearing in Spanish in the BoIetin de la Ofitina Sanitaria Panarne&ana 94(l), 1983.
ZAsistant Administrator, Gundersen Clinic, Ltd., La Crosse, Wisconsin, U.S.A.
practices, the results are well worth it-as evi- denced by both patient satisfaction and in- creased referrals once consumer satisfaction becomes part of the service package.
Most health providers overlook the oppor- tunity to collect this valuable information or collect it only on a periodic basis, thus limiting their ability to identify both individual patient difficulties and developing problems of a gen- eral nature. Nevertheless, the method used to gather such information is well-accepted, sim- ple to administer, and a source of important information for managing productive changes when treated in a systematic and quantitative fashion.
To help secure ongoing consumer data, questionnaires are designed for both the pa- tient and the referral source (in cases where patients do not refer themselves). These ques- tionnaires generally have a fairly standard for- mat, but their content should remain flexible enough to include questions considered vital by providers of any relevant services. Specific questions should be selected to deal with those elements of service most important to the staff, the patients, and the referral sources. Once se- lected, these questions should be listed on draft questionnaires that are reviewed by staff mem- bers and field-tested on patients and referral sources. Changes should then be made on the basis of the responses received from the field tests, and the revised questionnaire should be
368 PAHO BULLETIN . vol. 16, no. 4, 1982
tested in a similar manner until an acceptable set of questions is developed.
Design Considerations
In order to illustrate this way of obtaining consumer input and evaluating consumer sat- isfaction, it seems appropriate to consider how such work has been accomplished with respect to a specific category of patients-handi- capped children3 and teenagers 0 to 21 years of age. It should be noted, however, that the approach described is applicable to virtually
any service or program where interest exists in evaluating consumer satisfaction (1 I, 12). The model described here has proven successful at two group medical practices in the midwestern United States. Other methods for assessing consumer attitudes and opinions have been described by various authors (13-17).
In seeking information about consumer sat- isfaction, it seems reasonable to ask what one could expect to learn from data of this kind. To answer this question, one needs to look at the information in terms of individual cases and also in terms of results relating to groups of similar patients so as to illustrate general profiles of the overall service delivery system. As this suggests, assessment of the question- naire information should tell (1) if the indi- vidual consumers were satisfied with service activities; (2) if there were any particular com- plaints; and (3) what general comments or suggestions were being made about the ser- vices. For example, if a consumer is having difficulty in getting the insurance department to process claims or in obtaining reports from
3Pursuant to U.S. Public Law 94-142 (The Handi- capped Children Act of 1975), handicapped children have the following conditions: physical, crippling, or or- thopedic disability; developmental disability or mental retardation; emotional disturbance; hearing disability; visual disability; learning disability; speech or language disability; or other health impairments detrimental to educational progress (which means limited strength, vi- tality, or alertness that may be due to a heart condition, tuberculosis, rheumatic fever, nephritis, asthma, sickle cell anemia, hemophilia, epilepsy, lead poisoning, leu- kemia, or diabetes).
a certain doctor, the questionnaire affords an opportunity to tell about such problems, and this can pave the way for action to resolve the matter. (Answers to questions seeking more information about specific points or a detailed explanation of some problem can be placed in a “comments and suggestions” section at the end of the questionnaire.)
The Questionnaire
In general, the survey questionnaire is de- signed to yield information that will permit as- sessment of specific features of the health care process (i.e., interpretation of individual phy- sician findings, accuracy of diagnosis, helpful- ness of recommendations, scheduling of ap- pointments, summarization of all findings, and so forth). Specific questions are developed as previously described-with initial input from staff members, consumers, and referral sources. These are then field-tested, appro- priate deletions or modifications are made, and a master questionnaire is drawn up around a framework of key questions.
In developing this questionnaire, emphasis is placed on things of importance from the consumer’s point of view. Findings drawn from past research (1,2,12,18) have shown that consumers tend to associate certain con- ditions with satisfactory care. These include (1) the opportunity to ask questions, (2) effec- tive explanation of findings by staff members, (3) provision of all help needed to make the patient’s visit pleasant and meaningful, and (4) experiences demonstrating the usefulness of the medical findings after the patient leaves the doctor’s office. Accordingly, stress should be placed on questions relating to such points. A complete questionnaire, with its entries ar- ranged in logical sequence, is shown in An- nex 1.
Survey Procedures
Sommers l HEALTH DELIVERY SYSTEM EVALUATION 369
elude an introductory letter (see Annex), and pose, the format for recording the answers to each should be mailed out with a stamped, most questions should include a scale running self-addressed return envelope. A second from no (0 per cent) satisfaction to 100 per questionnaire should be sent, followed by a cent satisfaction, with a rating of 50 per cent telephone call, if the first questionnaire is not being intermediate. An example of this format
returned. is as follows:
Patients or their parents and referral sources should be asked to rate their answers on a “positive or negative” continuum in terms of their own levels of satisfaction. For that pur-
Sample Question: “Were you given opportu- nities to ask questions?”
NO
NEGATIVE
Rating Scale
POSITIVE
YES
0% 10% 20% 30% 40% 50% 60% 70% 80% 90% 100% Average
This rating scale format provides respon- dents with an opportunity to show not just whether a particular situation was acceptable but how satisfactory it was. For instance, in the sample cited suppose the respondent felt there was an opportunity to ask questions but the opportunity was poor. Perhaps the respon- dent was rushed, was not listened to, or was diverted before the answer could be fully com- prehended. To be honest, the respondent would have to answer the question “yes,” but could circle a low rating scale response (below 50 per cent if need be).
Results
A brief review of the returned question- naires will serve to identify responses indicat- ing less than satisfactory service. In the case of unusually unfavorable ratings or negative comments, it may be necessary to telephone the consumer in order to get to the bottom of the problem. In any case, prompt processing
is needed, it being important to resolve service delivery issues as they are identified, so as to prevent an initially minor problem from de- veloping into a major or chronic concern that may come to affect many patients. Therefore, individual questionnaires should be reviewed as they are received in the mail, and any prob- lems cited should be dealt with promptly.
Over time, the accumulation of information from individual questionnaires provides a basis for general examination of the health service delivery system. That is, the compila- tion, quantification, grouping, analysis, and interpretation of these data at systematic in- tervals provides a way of locating system defi- ciencies. Improvements seeking to lessen the extent and degree of unfavorable ratings and comments can then be made.
370 PAHO BULLETIN l vol. 16, no. 4, 1982
tive remarks a score of 1 and the negative re- marks a score of 0, or vice versa. Also, re- sponses to “yes-no” questions (e.g., to ques- tions 14 through 17 in the Annex question- naire) can be scored in a similar manner. “Check answer” responses can be quantified according to numbers listed beside the answer (e.g., 1, 2, 3, 4, or 5 in the case of Annex question 18). And answers to “rating scale” questions, which are essentially prequantified, can be expressed numerically in terms of the respondent’s chosen 0 to 100 per cent rating.
Consumer satisfaction with a particular ser- vice can then be monitored and projected. It is also possible to assess the levels of satisfaction expressed by different groups.
Visual display of such information can pro- vide an instant overview of the general situa- tion. If an unsatisfactory rating appears or an unsatisfactory trend commences, it is then necessary to examine the activities involved to determine the reason or reasons for dissatis- faction.
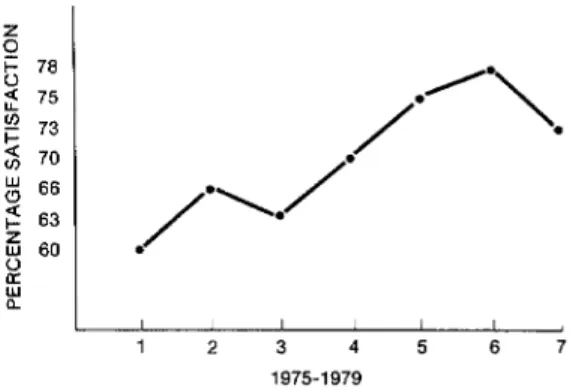
For example, one question from the “case coordinator” portion of a questionnaire as- sessing multispecialty pediatric services for ex- ceptional children read as follows: “Were sug- gestions, made by staff concerning the child’s educational activities, appropriate to local pro- gram activities and community resources?” Average satisfaction ratings of 60, 66, 63, 70, 75, 78, and 70 per cent were obtained sequen- tially over time (1,12). Figure 1 provides a visual projection of these data.
Besides being used in mail surveys, this general approach can be employed in other ways. Among other things, it has been possi- ble to apply the procedure to a consultation program providing telephone callers with tapes about childhood and adolescent prob- lems upon request (19). For this purpose a special set of questions was developed in post- card format. The resulting prepaid self-ad- dressed postcards were then inserted into bro- chures describing the available consulting tapes, and callers requesting tapes were asked to fill out the postcard questionnaire and re-
turn it. Since the callers’ names were not re- quested or given, the procedure remained confidential. However, each caller’s age and sex, as well as the time the call was made, was requested. Using the same rating procedure just described, a measure of consumer satis-
faction with various program features was ob- tained. The average responses to a question about ease of understanding in June-August 1978 and March-December 1979 are shown in Figure 2.
The procedure can also be applied to group counseling sessions, as it was to group coun- seling provided for adolescents with a neuro-
Figure 1. The average satisfaction ratings given from 1975 to 1979 in response to the following question: “Were suggestions, made by the staff
concerning the child’s educational activities, appropriate to your program activities and
community resources?”
a
I1975-1979
Figure 2. Average levels of consumer satisfaction expressed in response to the taped consultation
Sommers l HEALTH DELIVERY SYSTEM EVALUATION 371
logically based movement disorder known as of their satisfaction with the counseling and to Gilles de la Tourette’s disease (20). The par- identify matters that should be dealt with in ticipating adolescents included both boys and future sessions. The questions asked, the aver- girls. The questions shown in Table 1 were age responses to the first five questions, and addressed to each of them following an initial the various answers given to the last question counseling session in order to gauge the extent were as shown in Table 1.
Table 1. Excerpts from a survey of subjects receiving group counseling for Gilles de la Tourette’s disease showing initial instructions, the questions asked, and
the results based on answers to questions 1-5.
RATE EACH QUESTION AS IT CORRESPONDS TO YOUR LEVEL OF SATISFACTION. CIRCLE THE PER CENT (7%) THAT YOU BELIEVE TO BE MOST APPROPRIATE. A RATING OF 50% IS CONSIDERED AVERAGE. A RATING ABOVE 50% INDICATES A FAVORABLE (POSITIVE) RE- SPONSE AND A RATING BELOW 50% INDICATES A NEGATIVE (LESS THAN FAVORABLE) RE- SPONSE.
Example:
NEGATIVE POSITIVE
NO YES
Questions (number responding = 22):
1) Did you enjoy talking about Tourette with others? 2) Were all questions you had about Tourette answered? 3) Were you given opportunities to ask questions?
4) Do you feel better about yourself after having participated in the discussion?
5) Would you like to have another meeting with the same group?
0% 10% 20% 30% 40% 50% 60% 70% 80% 90% 100% Average
88% 55% 82% 92% 100% Comment/suggestion section:
6) If another meeting is planned, what would you like to do? a) Find out what causes Tourette.
b) Discuss ways of handling inappropriate behavior and ways to stop or handle teasing c) Be informed of ways to help teachers and students to understand Tourette.
d) Find out how other people cope with it.
Inferential Analysis be applied to the results in an effort to more
precisely identify activities associated with un- Over time, as questionnaires are sent to favorable ratings and comments as well as ac- new groups of consumers at scheduled inter- tivities that merit increased emphasis (18, Zl-
vals, new ratings are compared to past ratings 23). This procedure is known as inferential to find the direction and magnitude of changes analysis.
372 PAHO BULLETIN l vol. 16, no. 4, 1982
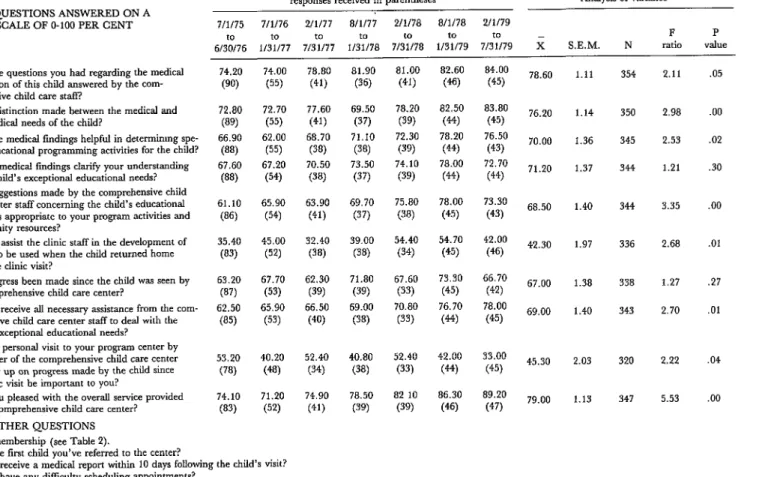
applied to consumer satisfaction data about medical services provided to handicapped children from 1 July 1975 to 31 July 1978 (N = 402), as reported in 1979 (1,2,11, I2), and to other groups of handicapped children from 1 August 1978 to 31 July 1979 (N = 152) (18). The aim was to examine findings from parents and “case coordinators”4 involved with children receiving the same services. Similarities and differences in their responses were then compared in an attempt to deter- mine predictable patterns and relationships. Both parents and case coordinators completed a two-part questionnaire, Part A containing satisfaction rating questions (on a 0 to 100 scale) and Part B containing “yes-no,” “check answer,” and “free response” questions. The questions asked and the average Part A satis- faction ratings obtained are shown in Tables 2 and 3. An analysis of variance was performed on the Part A data recorded at different times to determine whether the indicated changes were statistically significant (P< 0.05).
Parents
By and large, the parental satisfaction rat- ings obtained in response to the Part A ques- tions showed quite high levels of satisfaction from the time the survey began in July 1975 through July 1979. Since the 1979 responses to a majority of the questions (1, 2, 3, 4, and 7) showed 80 per cent satisfaction or over, the potential for demonstrating further statistical- ly significant gains was relatively slight.
However, the results of a similar survey conducted in 1978 (2) had indicated that aver- age parental satisfaction with overall medical
‘U.S. Public Law 94-142 assigns educational and learning-related responsibilities for a handicapped child to the school district where the child resides. Within this context, staff members from public health, social service, and other agencies have frequent cause to refer such a child to medical facilities for evaluation and treatment, and then to serve as “case coordinators” for the child at the local level.
services was significantly higher than average case coordinator satisfaction with those ser- vices (P < 0.05). This statistical difference was attributed largely to the personal contact af- forded parents while at the doctor’s office, a contact that allowed the parents to become personally acquainted with the doctor and staff, and which facilitated clarification and resolution of any questions.
Case Coordinators
Case coordinator responses to most ques- tions demonstrated a significant increase in satisfaction over time. This improvement was documented by statistically significant gains (PcO.05) vis-a-vis the average responses to questions 1, 2, 3, 5, 6, 8, 9,5 and 10. To pro- mote these changes, major emphasis was placed on the following activities: (1) trans- mitting medical information to case coordi- nators in language appropriate for determin- ing what the handicapped child’s specific edu- cational activities should be; (2) clearly an- swering all questions about the child’s visit to the doctor; (3) explaining the child’s medical and nonmedical needs; (4) providing oral and written reports about the plan of evaluation and treatment that could easily be integrated into the child’s learning program; and (5) en- couraging doctors and staff members to pro- vide all necessary assistance to the child and family throughout the evaluation and follow- up process.
Table 2. Parent responses to a questionnaire requesting information about services for handicapped children provided from 1 July 1975 to 31 July 1978 and from 1 August 1978 to 31 July 1979.
PART A: QUESTIONS ANSWERED ON A RATING SCALE OF O-100 PER CENT
Average percentage ratings obtained from parent questionnaires submitted in the indicated period, showing the number of re-
sponses received in parentheses Analysis of variancea ?I1175 7/I/76 211177 a/1/77 2/t/78 8/i/78 2/t/79
6/3bq/76 1/3:q77 7/3:0/77 I/3:0/78 7/3:0/78 1/3fp/79 7/3f;;79 x
F P S.E.M. N ratio value 1) Were you given opportunities questions? to ask 84.20 87.70 88.10 88.70 88.80 88.90 89.10
(90) (53) (41) (38) (51) (47) (40)
87.50 .97 2) Was there an explanation findings as they related to the education of the medical 75.50 83.70 79.00 80.30 80.80 79.20 86.10
(8% (52) (41) (38) (51) (47) (38) 80,00
1.28 of your child?
3) Did you receive a clearly developed explana- 70.50 74.90 76.80 76.10 82.90 80.00 85.30
tion of all findings after your clinic visit? (89) (53) (41) (38) (52) (47) (40) 77.10 1.48 4) Were your appointments scheduled properly? 89.30 80.40 82.40 82.60 87.50 87.40 88.30
(90) (52) (41) (38) (51) (46)
85 go (40) . 1.18 5) Has progress been made since your child was 68.70 64.40 67.00 71.80 66.20 69.60 68.10
seen by the comprehensive child care center? (87) (50) (39) (38) (50) (46) (36) 67.go
1.56 6) Would a personal visit to your community
by a member of the comprehensive child 57.30 56.00 55.00 57.50 57.50 50.50 58.70 care center to follow up on progress made (81) (47) (40) (36) (50) (43) (37)
56.20 2.10 by your child since the clinic visit be im-
portant to you?
7) Were you pleased with the overall service pro- vided by the comprehensive child care center? 82.10 84.00 82.00 86.40 85.80 83.60 84.80 (87) (51) (41) (36) (52) (47) (40)
83,80 1.19 PART B: OTHER QUESTIONS
8) Group membership (defined by the time interval the child was first seen for his exceptional needs). 9) Is it your first visit to the center?
10) Did you receive an appointment to return?
11) DO you have any suggestions or general comments about the service and care you received?
360 356
360 358 346
334
354 .66 1.14
1.95 1.33 .31
.22
.30 .68 .34
.07 .24 .93
.97
.94
Table 3. Case coordinator responses to a questionnaire requesting information about services for handicapped children provided from 1 July 1975 to 31 July 1978 and from 1 August 1978 to 31 July 1979.
PART A: QUESTIONS ANSWERED ON A RATING SCALE OF O-100 PER CENT
1) Were the questions you had regarding the medical evaluation of this child answered by the com- prehensive child care staff?
2) Was a distinction made between the medical and non-medical needs of the child?
3) Were the medical findings helpful in determimng spe- cific educational programming activities for the child? 4) Did the medical findings clarify your understanding
of the child’s exceptional educational needs? 5) Were suggestions made by the comprehensive child
care center staff concerning the child’s educational activities appropriate to your program activities and community resources?
6) Did you assist the clinic staff in the development of a plan to be used when the child returned home from the dinic visit?
7) Has progress been made since the child was seen by the comprehensive child care center?
8) Did you receive all necessary assistance from the com- prehensive child care center staff to deal with the child’s exceptional educational needs? 9) Would a personal visit to your program center by
a member of the comprehensive child care center to follow up on progress made by the child since the clinic visit be important to you?
10) Were you pleased with the overall service provided by the comprehensive child care center? PART B: OTHER QUESTIONS
11) Group membership (see Table 2).
12) Is this the fmt child you’ve referred to the center?
Average percentage ratings obtained from case coordiiator question- naires submitted in the indicated period, showing the number of
responses received in parentheses Analysis of variancea 7/t/75 7/l/76 2/l/77 a/1177 2/l/78 8/i/78 2/l/79
to to to
6/3bq/76 I/31/77 7131177 I/3:0/78 7/3fio/78 t/31/79 7/3:0/79 x
F P S.E.M. N ratio value 74.20 (90) 72.80 (89) 66.90 w 67.60 (88) 61.10 (86) 35.40 (83) 63.20 (87) 62.50 (85) 53.20 (78) 14.10 (83) 74.00 (55) 72.70 (55) 62.00 (55) 67.20 (54) 65.90 (54) 45.00 (52) 67.70 (53) 65.90 (53) 40.20 (48) 71.20 (52) 78.80 (41) 77.60 (41) 68.70 (38) 70.50 (38) 63.90 (41) 32.40 (38) 62.30 (39) 66.50 (40) 52.40 (34) 74.90 (41) 81.90 (36) 69.50 (37) 71.10 (38) 73.50 (37) 69.70 (37) 39.00 (38) 71.80 (39) 69.00 (38) 40.80 (38) 78.50 (39) 81.00 (41) 78.20 (3% 72.30 (3% 74.10 (39) 75.80 (38) 54.40 (34) 67.60 (33) 70.80 (33) 52.40 (33) 82 10
(39) 82.60 (46) 82.50 (9 78.20 (4‘9 78.00 (44) 78.00 (45) 54.70 (45) 73.30 (45) 76.70 (44) 42.00 (44) 86.30 (46) 84.00 (45) 83.80 (45) 76.50 (43) 72.70 (44) 73.30 (43) 42.00 (46) 66.70 (42) 78.00 (45) 33.00 (45) 89.20 (47)
78.60 1.11 354 2.11 .05 76.20 1.14 350 2.98 .oo 70.00 1.36 345 2.53 .02 71.20 1.37 344 1.21 .30 68.50 1.40 344 3.35 .oo 42.30 1.97 336 2.68 .Ol 67.00 1.38 338 1.27 .27 69.00 1.40 343 2.70
45.30 79.00
2.03 320 1.13 347
2.22 5.53
.Oi
.04 .oo
13) Did you receive a medical report within 10 days following the child’s visit? 14) Did you have any difficulty scheduling appointments? . .^
15) i-low tar do you hve from the center (m mlles)c
16) The title of case coordinator (physician, public school staff member, health nurse, developmental disability staff member, social worker). 17) Do you have any suggestions or general comments about the service and care you received?
Sommers l HEALTH DELIVERY SYSTEM EVALUATION 375
Compakon of Parent and Coordinator Responses
To see whether there were statistically sig- nificant differences between parental and case coordinator satisfaction ratings, a matched pair analysis was made of the July 1975~June 1976 responses to three questions found on both the parent and case coordinator ques- tionnaires (2). The results, shown in the left- hand columns of Table 4, indicated a signifi- cant difference in the responses to only one question, that being “Were you pleased with the overall service provided by the Compre-
hensive Child Care Center?” This suggested that careful attention should be given to the values of both groups, for parents and case coordinators could have different expectations of the services provided for the child during and following medical intervention. It could also mean that health service providers should identify the different needs of parents and case coordinators and ensure provision of services meeting both sets of needs.
Statistically significant differences can
change from one period of evaluation to the next. However, when the same comparison between parental and case coordinator re- sponses was made with the following year’s data (that of July 1976-June 1977), including new groups of parents and case coordinators, a similar result occurred. That is, as Table 4 shows, a statistically significant difference (P < 0.05) was found to exist between parental and case coordinator levels of overall satisfac- tion with the provided services (28). This find- ing of a statistically significant difference ex-
tending over two separate evaluation periods underlined the importance of addressing and fulfilling the expectations of both groups.
Advanced Inferential Analysis:
Predicting Consumer Satisfaction
A specific medical service, such as a pe- diatric neurologic assessment to rule out or confirm a condition like epilepsy, requires a coordinated series of physician, staff, and lab- oratory activities (see Table 5). Each of these
Table 4. Analysis of differences in the responses of parents and case coordinators to three survey
questions (see Tables 2 and 3).
Questions (see Tables 2 and 3)
1 July 1975 - 30 June 1976 1 July 1976 - 30 June 1977 No. of matching
pairs responding T-.faltle
No. of matching
pairs responding T-value Has progress been made since your child
was seen by the comprehensive child care center? (Question 5 of Table 2 for par- ents, Question 7 of Table 3 for case coor- dinators.)
66 1.03a 56 - .99a
Would a personal visit to your community by a member of the comprehensive child care center to follow up on progress made by your child since seeing the doctor be important to you? (Question 6 of Table 2 for parents, Question 9 of Table 3 for case coordinators.)
Were you pleased with the overall services provided by the comprehensive child care center? (Question 7 of Table 2 for par- ents, Question 10 of Table 3 for case co- ordinators.)
59 -0.09a 52 1.68a
64 2.95b 58 2.09b
376 PAHO BULLETIN l vol. 16, no. 4, 1982
Table 5. An illustrative example of specific steps involved in providing a particular medical service.
step 1
Appointment(s) made
step 5
Administration of EEG and/or EGG
tests
step 9
Discussion of treat- ment plan with phy- sician
step 2
Records and other registration information collected
step 3 step 4
Check-in at doctor’s office Performance of laborato- and procurement of addi- ry and X-ray studies tional information
Step 6 Step 7 Step 8
General physical examination Doctor’s physical examina- Discussion of all results conducted by nurse-including tion conducted with physician measurement of height, weight,
blood pressure, temperature, etc. Step 10
Return of patient to home, com- mencement of plan, and follow- up contact with physician if needed
activities is identifiable and can be defined. It is important, however, that the relationship between each step be carefully examined,
since it is the combined effect of separate ac- tivities that determines how well the complete service is provided and how it is perceived by the patient.
Dissatisfaction with the way one or more steps are performed may leave the consumer dissatisfied with the overall visit; or, alterna- tively, some consumers may excuse poor ser- vice at certain steps if the final results meet the needs that caused them to seek care. How- ever, it is possible to determine how great a part each service element is contributing to the consumers’ overall opinions by asking them to rate their satisfaction with both gen- eral and specific aspects of the service.
In general, consumer satisfaction with med- ical services will change in relation to the em- phasis placed upon delivery of those services by physicians and staff members. If the overall service improves, consumer ratings of the same service will tend to improve. Likewise, if a specific activity improves, we can predict that patient satisfaction with that activity should improve. Nevertheless, at some point the law of diminishing returns will be reached and the ratings will stabilize, hopefully at a level acceptable to the practitioner and one in-
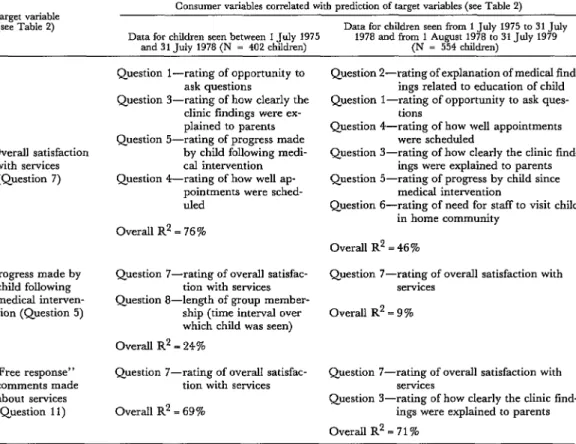
dicative of maximum benefit for the patient. The job of predicting the effect of positive changes in the service delivery system can be facilitated by application of advanced inferen- tial analysis. For example, such analysis (in- volving stepwise multiple linear regression analysis--l, 2,24) was applied to data from the foregoing handicapped child survey. The aim was to predict which medical activities would be most likely to have a major impact on (1) consumer satisfaction with overall medical services; (2) parental and case coordinator
perceptions about progress made by the child following medical intervention; and (3) com- ments made about the services provided.
Sommers l HEALTH DELIVERY SYSTEM EVALUATION 377
Table 6. Consumer variables associated with prediction of parents’ overall satisfaction concerning the services provided, of their satisfaction regarding progress made by their children following medical intervention,
and of the satisfaction they expressed in other comments (see Table 2). Each variable is listed by order of its degree of correlation; only variables having a “P” value for entry into the stepwise
regression equation of over 0.05 have been listed.
Target variable (see Table 2)
Consumer variables correlated with prediction of target variables (see Table 2) Data for children seen from 1 July 1975 to 31 July Data for children seen between 1 July 1975 1978 and from 1 August 1978 to 31 July 1979
and 31 July 1978 (N 3 402 children) (N = 554 children)
Overall satisfaction with services
(Question 7)
Progress made by child following medical interven- tion (Question 5)
“Free response” comments made about services (Question 11)
Question l-rating of opportunity to ask questions
Question S-rating of how clearly the clinic findings were ex- plained to parents Question 5-rating of progress made
by child following medi- cal intervention
Question 4-rating of how well ap- pointments were sched- uled
Overall R2 = 76 %
Question 7-rating of overall satisfac- tion with services Question g-length of group member-
ship (time interval over which child was seen) Overall R2 = 24%
Question 7-rating of overall satisfaction with services
Overall R2 = 9%
Question 7-rating of overall satisfac- Question ‘I-rating of overall satisfaction with tion with services services
Overall R2 = 69%
Question 3-rating of how clearly the clinic find- ings were explained to parents
OverallR’=71%
Question Z-rating of explanation of medical fmd- ings related to education of child Question l-rating of opportunity to ask ques-
tions
Question 4-rating of how well appointments were scheduled
Question J-rating of how clearly the clinic find- ings were explained to parents Question 5-rating of progress by child since
medical intervention
Question 6-rating of need for staff to visit child in home community
Overall R* = 46 %
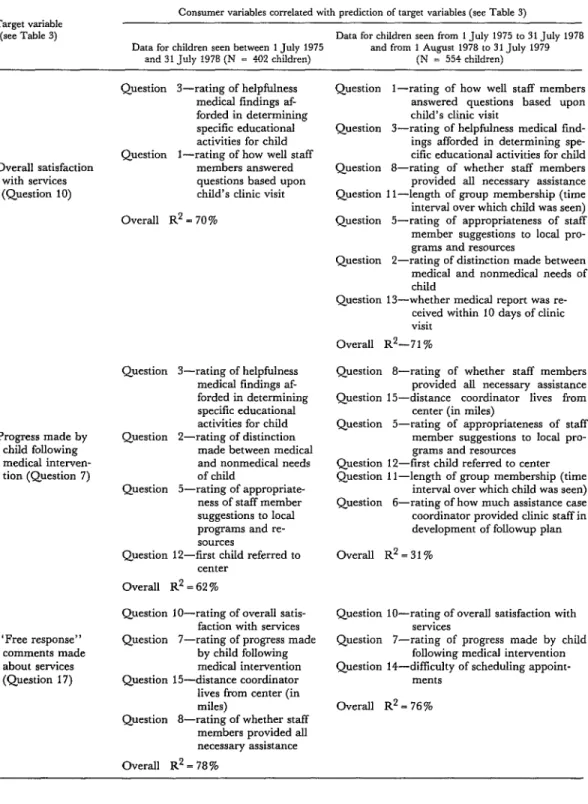
The increase in the number of “predictor” variables found to have a noteworthy associa- tion with overall case coordinator satisfaction can be accounted for by a significant improve- ment in case coordinator ratings over time (see Table 3). Of course, this larger number of variables implies that plans for sustaining and improving case coordinator satisfaction will require devoting special attention to a rela- tively large number of activities, rather than concentrating special attention on a few.
Regarding the parental data, the analysis showed that nearly all the variables having a noteworthy association in 1975-1978 also had a noteworthy association in 1978-1979. In ad-
dition, the matters cited in questions 2 and 6 had come to have a noteworthy association with overall satisfaction, and that cited in question 3 had come to have a noteworthy association with parental comments. Like the case coordinator responses, the parental re- sponses showed a steady improvement in sat- isfaction over time.
378 PAHO BULLETIN l vol. 16, no. 4, 1982
Table 7. Consumer variables associated with prediction of case coordinators’ overall satisfaction concerning the
services provided, of their satisfaction regarding Progress made by children following medical intervention,
and of the satisfaction they expressed in other comments (see Table 3). Each variable is listed by order of its degree of correlation; only variables having a “P” value for entry into the stepwise
regression equation of over 0.05 have been listed. Target variable
(see Table 3)
Consumer variables correlated with prediction of target variables (see Table 3)
Data for children seen from 1 July 1975 to 31 July 1978 Data for children seen between 1 July 1975 and from 1 August 1978 to 31 July 1979
and 31 .Tuly 1978 (N = 402 children) (N = 554 children)
Overall satisfaction with services (Question 10)
Progress made by child following medical interven- tion (Question 7)
“Free response” comments made
about services
(Question 17)
Question 3-rating of helpfulness medical findings af- forded in determining specific educational activities for child Question l-rating of how well staff
members answered questions based upon child’s clinic visit Overall R2 = 70%
Question 3-rating of helpfulness medical findings af- forded in determining specific educational activities for child Question P-rating of distinction
made between medical and nonmedical needs of child
Question 5-rating of appropriate- ness of staff member suggestions to local programs and re- sources
Question 12-first child referred to center
Overall It2 = 62 %
Question lo-rating of overall satis- faction with services Question 7-rating of progress made
by child following medical intervention Question 15-distance coordinator lives from center (in miles)
Question 8-rating of whether staff members provided all necessary assistance Overall R2 = 78 %
Question l-rating of how well staff members answered questions based upon child’s clinic visit
Question 3-rating of helpfulness medical fmd- ings afforded in determining spe- cific educational activities for child Question 8-rating of whether staff members
provided all necessary assistance Question 1 l-length of group membership (time interval over which child was seen) Question J-rating of appropriateness of staff member suggestions to local pro- grams and resources
Question Z-rating of distinction made between medical and nonmedical needs of child
Question 13-whether medical report was re- ceived within 10 days of clinic visit
Overall R2-71 %
Question 8-rating of whether staff members provided all necessary assistance Question 15-distance coordinator lives from
center (in miles)
Question J-rating of appropriateness of staff member suggestions to local pro- grams and resources
Question 12-first child referred to center Question 1 l-length of group membership (time
interval over which child was seen) Question 6-rating of how much assistance case coordinator provided clinic staff in development of followup plan Overall R2 = 3 1%
Question lo-rating of overall satisfaction with services
Question 7-rating of progress made by child following medical intervention Question 14-diffkulty of scheduling appoint-
Sommers l HEALTH DELIVERY SYSTEM EVALUATION 379
progress was the parents’ overall satisfaction with the services-and even this had a rela- tively slight association (R2 = 0.09). One pos- sible explanation could be that parents’ per- ceptions of their child’s “progress” were not greatly influenced by the other variables, these variables being more closely associated with “quality of service.” If so, this supports the theory that parents, being principally in- terested in their child’s health, are apt to be
especially concerned about health status
changes (or lack of them) that may relate to the child’s handicapped condition. This in turn suggests that if medical intervention can- not overcome or reduce the handicap, parental satisfaction will probably remain moderate (in
the 50-70 per cent range) instead of rising to higher levels. Moreover, since such preoccu- pation with the outcome might well be less pronounced among case coordinators, the co- ordinators’ perceptions of progress could well be more closely associated with various “qual- ity of service” variables, as the data in Table 7 indicate.
In this manner, besides providing a basis for predicting which variables can influence future consumer responses, this sort of analy- sis can provide insight into relationships be- tween different variables and possible reasons for disparities in the attitudes of different con- sumer groups.
SUMMARY
Most health providers overlook the opportunity to collect consumer input or collect it only on a pe- riodic basis, thus limiting their ability to detect in- dividual patients’ difficulties and to nip developing problems of a more general nature in the bud. One simple and effective way of collecting such informa- tion on a continuing basis is to develop a question- naire that will provide an accurate index of con- sumer satisfaction with the key services involved.
The questionnaire format discussed here, which is only one of various available, has proven success- ful at two group medical practices in the midwest- ern United States. It is geared to a series of ques- tions directed at things consumers tend to consider
important, these questions (suggested by staff members, referral sources, and consumers) having been previously included in draft questionnaires and tested in the field. Previous research has shown that consumers tend to associate certain conditions with satisfactory care-these conditions including an opportunity to ask questions, effective explana- tion of findings by staff members, provision of all help needed to make the patient’s visit pleasant and
meaningful, integration and summarization of all results in “jargon-free” reports, and experiences demonstrating the usefulness of the visit after the patient leaves the doctor’s office. Accordingly, stress should be placed on questions relating to these matters.
Questionnaires used by the author for this pur- pose have typically included queries about the respondent’s satisfaction with a number of cir- cumstances and activities. Most of these queries ask the respondent to rate his or her level of satisfaction on a scale ranging from 0 to 100 per cent. The ques- tionnaires are then submitted periodically to all ap- propriate consumers, the responses are scanned upon receipt to see if prompt action is needed, and the data obtained are subjected to statistical analy- sis at regular intervals. Overall, this general ap- proach has provided an effective way of monitoring consumer satisfaction with key aspects of a service, pinpointing specific problems, and determining the steps needed to see that appropriate levels of con- sumer satisfaction are achieved and maintained.
REFERENCES
(1) Sommers, P. A., and C. Fuchs. Pediatric (2) Sommers, P. A., and G. R. Nycz. Monitor- care for exceptional children: An inferential evalua- ing consumer satisfaction with the clinical services tion procedure utilizing longitudinal consumer sat- provided to exceptional children. Am J Public Health isfaction information. Med Care 18(6):657-667, 68(9):903-905, 1978.
380 PAHO BULLETIN l vol. 16, no. 4, 1982
ity of medical care. Med Care 12(4):328-337, 1974. (4) Lebow, J. Evaluation of an outpatient pe- diatric practice through the use of consumer ques- tionnaires. Med Cure 13(3):250-255, 1975.
(‘5) Lister, J. The bureaucratic machine, fit to drive? The consumer’s vote. N Engl J Med 295(22): 1240-1242, 1976.
(6) Doyle, B. J., and J. E. Ware, Jr. Physician conduct and other factors that affect consumer sat- isfaction with medical care. JMed Educ 52:793-801, 1977.
(7) Ware, J. E., Jr., and M. K. Snyder. Dimen- sions of patient attitudes regarding doctors and medical care services. Med Care 13(8):669-682, 1975.
(8) Ware, J. E., Jr., W. R. Wright, M. K. Snyder, and G. C. Chu. Consumer perceptions of health care services: Implications for academic medicine. J Med Educ 50:839-848, 1975.
(9) Williamson, J. W. Evaluating quality of pa- tient care: A strategy relating outcome and process assessment. JAMA 218:564-569, 1971.
(10) Graff, L. Health care good, one survey finds. Hospitals 54(7): 129-136, 1980.
(11) Sommers, P. A., W. A. Jones, G. G. Griese, and F. W. Theye. Medical-educational in- teraction for exceptional children. Wis Med J 78 (2): 15, 1978.
(12) Sommers, P. A., and G. Nycz. Evaluating health services for exceptional children: A focus on consumer satisfaction. Guidelines for PI@ Services 17(2):45-60, 1979.
(13) Buros, 0. Personality Tests and Reviews. Gryphon; Highland Park, New Jersey, 1970.
(14) Buros, 0. The Seventh Mental Measurement Yearbook. Gryphon; Highland Park, New Jersey, 1972.
(15)Chun, K. T., S. Cobb, andJ. R. P. French. Measures for Psychological Assessment. Institute for Social Science Research, Ann Arbor, 1978.
(16) Fink, A., and J. Kosecoff. An Evaluation Primer. Capitol Publications, Washington, D. C., 1978.
(17) Schulberg, H. C., and F. Baker. Program Evaluation in the Health Fields (vol. 2). Human Sci- ences Press, New York, 1979.
(18) Sommers, P. A. Predicting the Improve- ment of Medical Services for Exceptional Children. In L. Mann, D. Sabatino, and L. Joiner (eds.). The Almanac of Special Education. Learning Publications;
Holmes Beach, Florida, 1982.
(19) Sommers, P. A., and F. W. Theye. Dial Harmony: A Community Service of the Comprehensive Child Care Center of the Marshfield Clinic and Medical Foundation; Dial Access Systems: A Way to Spread Your Message. University of Wisconsin Press, Madison,
1979.
(20) Sommers, P. A. Evaluation of Group Coun- seling Provided by Marshfield (Wisconsin) Clinic Staff to Children with the Gilles de la Tourette Syn- drome. Unpublished evaluation report, 1979.
(21) Popham, W. J. Educational Statistics: Use and Interpretation. Harper and Row, New York, 1967.
(22) Sommers, P. A. Standardizing Medical- Educational Services for Exceptional Children: A Focus on Mental Retardation. In Council for Ex- ceptional Children. International Perspectives on Future Special Education, Reston, Virginia, 1979.
(23) Sommers, P. A. An inferential evaluation model. J Educ Tech, May 1973, pp. 65-67.
(24) Draper, N. R., and H. Smith. Applied Re- gression Analysis. John Wiley and Sons, New York,
Sommers l HEALTH DELIVERY SYSTEM EVALUATION 381
ANNEX 1. EXAMPLE OF A MASTER QUESTIONNAIRE
Patient Number
Clinic ( )
Today’s Date:
Dear
We are interested in knowing how you feel about the treatment you (and the patient you accompa- nied to the Clinic if you are not the patient) received when last seen at Clinic for special services. Listed on the following pages are questions relating to various parts of your experiences here.
Please rate each of the questions corresponding to your level of satisfaction particularly as it relates to the most recent visit. A rating of 50% is average. A rating above 50% indicates a positive (satisfied) response and a rating below 50% indicates a negative(unsatisfactory) response. Circle the percent (%) of satisfaction you have for each question.
Example Question: “Was the amount of time Clinic staff spent with you satisfactory?”
NEGATIVE POSITIVE
(Not satisfied) (Satisfied)
NO YES
0% 10% 20% 30% 40% 50% 60% 70% 80% 90% 100%
Complete and return questionnaire in the enclosed, stamped envelope within the next five days. For those questionnaires not returned, Clinic staff will follow-up on and assist with the completion.
Thank you for taking the time to respond to this questionnaire. Your response will help improve our service to you.
Sincerely,
Patient Services Coordinator Telephone (715) 387-
382 PAHO BULLETIN l vol. 16, no. 4, 1982
Please crrcle the % (50% being average) that corresponds to your level of satisfachon with each of the followmg quesbons (If you would like to
explain your answer, please use space followmg question). I NEGATIVE POSITIVE 1. Were you satisfied with the date and time of your appomtment?
If no, what could have been done to improve it7 NO YES
0% 10% 20% 30% 40% 50% 60% 70% 80% 90% 100%
2. Were you given opportumties to ask questions? NO YES
0% 10% 20% 30% 40% 50% 60% 70% 80% 90% 100%
3. NO YES
0% 10% 20% 30% 40% 50% 60% 70% 80% 90% 100%
4. NO YES
0% 10% 20% 30% 40% 50% 60% 70% 80% 90% 100%
5. Did you receive a clearly developed explanahon of all findings7
6.
Clime NO YES
0% 10% 20% 30% 40% 50% 60% 70% 80% 90% 100%
NO YES
0% 10% 20% 30% 40% SO% 60% 70% 80% 90% 100%
7. NO YES
0% 10% 20% 30% 40% 50% 60% 70% 80% 90% 100%
8. Has progress been made since last being seen at this specral clime service?
If no, what could be done to increase progress? NO YES
0% 10% 20% 30% 40% 50% 60% 70% 80% 90% 100%
9. NO YES
0% 10% 20% 30% 40% 50% 60% 70% 80% 90% 100%
IO. Dfd you receive all necessary assistance from staff? NO YES
0% 10% 20% 30% 40% 50% 60% 70% 80% 90% 100%
If. Was the cost reasonable for services provided7 NO YES
0% 10% 20% 30% 40% 50% 60% 70% 80% 90% 100%
12. NO YES
0% 10% 20% 30% 40% 50% 60% 70% 80% 90% 100%
13. Were you pleased with the overall service provided at the Clinic7 NO YES
0% 10% 20% 30% 40% 50% 60% 70% 80% 90% 100% ..,
14. Was this your first visit to
” CIRCLE Y&JR ANSW;R for medical care? NO YES 15. Was this your first visit to special service clinic?
16. Did you receive an appointment to return?
If yes, what date(s)” What department(s)? 17. Did you have any difficulty scheduling appointments7
If yes, describe problem(s)
NO YES NO YES
Sommers l HEALTH DELIVERY SYSTEM EVALUATION 383
18 How long did you wait to be seen for your appointment?
19. Who referred you to the special clinic service?
20. How many mtles do you live from the doctor’s office7
... CHECK YOUR ANSWER
1, _ O-5 minutes 4. _ 30-60 minutes 2. _ 5-15 minutes 5. _ Over one hour 3. _ 15-30 minutes
1. _ Your family doctor 4 _ Self 2. _ Medical center doctor 5 _ Other (specrfy) 3. _ Nurse
1. _ Within 20 miles 2. _ 20-100 miles 3. _ Over 100 miles
21. Were there things about your health that you thought were important but not brought up durmg the Clinic visit?
22 List the department or departments in which you were seen other than special clinic services
Departments: Date(s) seen:
23.
24. Do you have any suggestions or general comments about the service and care you received?
THANK YOU FOR COMPLETING THE QUESTIONNAIRE.