Appendix
This appendix is part of the Master’s thesis “Consumer Satisfaction with Water, Wastewater and Waste Services in Portugal” by Karoline Hormann, Master’s student in Economics at Nova School of Business and Economics (submitted in January 2016).
List of Figures
1 Histogram, Satisfaction with Wastewater Services . . . 2
2 Histogram, Satisfaction with General Waste Services . . . 3
3 Histogram, Satisfaction with Recycling Waste Services . . . 4
List of Tables
1 Summary of Median, Mean and Standard Deviation Scores . . . 52 Marginal Effects from Ordered Logit, Water . . . 6
3 Marginal Effects from Ordered Logit, Wastewater . . . 6
4 Marginal Effects from Ordered Logit, General Waste . . . 7
5 Marginal Effects from Ordered Logit, Recycling Waste . . . 7
6 Extended Spearman Correlation Matrix, Water . . . 8
7 Extended Spearman Correlation Matrix, Wastewater . . . 9
8 Extended Spearman Correlation Matrix, General Waste . . . 10
Figure 1: Histogram, Satisfaction with Wastewater Services
Figure 2: Histogram, Satisfaction with General Waste Services
Figure 3: Histogram, Satisfaction with Recycling Waste Services
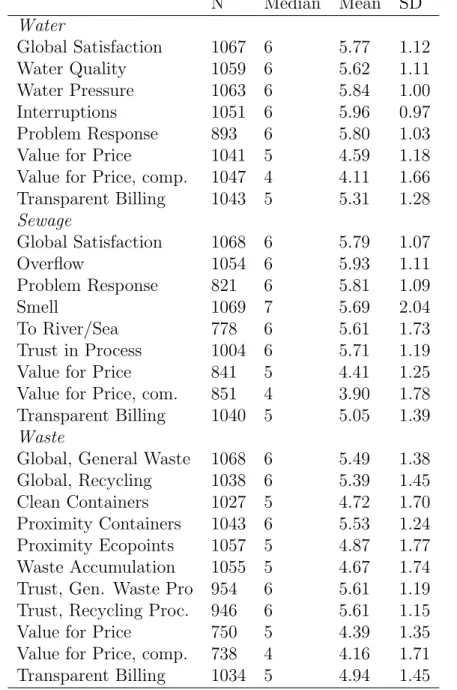
Table 1: Summary of Median, Mean and Standard Deviation Scores
N Median Mean SD
Water
Global Satisfaction 1067 6 5.77 1.12
Water Quality 1059 6 5.62 1.11
Water Pressure 1063 6 5.84 1.00
Interruptions 1051 6 5.96 0.97
Problem Response 893 6 5.80 1.03
Value for Price 1041 5 4.59 1.18
Value for Price, comp. 1047 4 4.11 1.66 Transparent Billing 1043 5 5.31 1.28
Sewage
Global Satisfaction 1068 6 5.79 1.07
Overflow 1054 6 5.93 1.11
Problem Response 821 6 5.81 1.09
Smell 1069 7 5.69 2.04
To River/Sea 778 6 5.61 1.73
Trust in Process 1004 6 5.71 1.19
Value for Price 841 5 4.41 1.25
Value for Price, com. 851 4 3.90 1.78 Transparent Billing 1040 5 5.05 1.39
Waste
Global, General Waste 1068 6 5.49 1.38 Global, Recycling 1038 6 5.39 1.45 Clean Containers 1027 5 4.72 1.70 Proximity Containers 1043 6 5.53 1.24 Proximity Ecopoints 1057 5 4.87 1.77 Waste Accumulation 1055 5 4.67 1.74 Trust, Gen. Waste Pro 954 6 5.61 1.19 Trust, Recycling Proc. 946 6 5.61 1.15
Value for Price 750 5 4.39 1.35
Table 2: Marginal Effects from Ordered Logit, Water
UNSATISFIED NEUTRAL SATISFIED
Marginal effects Marginal effects Marginal effects
Water Quality -0.00919*** -0.0103*** 0.0195***
(0.00321) (0.00365) (0.00632)
Water Pressure -0.00702** -0.00785** 0.0149**
(0.00328) (0.00365) (0.00662)
Interruptions -0.00931** -0.0104** 0.0197**
(0.00427) (0.00482) (0.00867)
Problem Response -0.00245 -0.00274 0.00519
(0.00351) (0.00394) (0.00742)
Value for Money -0.00665* -0.00744* 0.0141*
(0.00356) (0.00402) (0.00733)
Value for Money, compared -0.00403* -0.00451* 0.00854*
(0.00244) (0.00273) (0.00504)
Transparent Billing -0.00392 -0.00438 0.00830
(0.00256) (0.00287) (0.00531)
(0.0119) (0.0134) (0.0251)
Demographics YES YES YES
Regions YES YES YES
Table 3: Marginal Effects from Ordered Logit, Wastewater
UNSATISFIED NEUTRAL SATISFIED
Marginal effects Marginal effects Marginal effects
Flooding -0.00190 -0.00318 0.00509
(0.00272) (0.00449) (0.00714)
Problem Response -0.00394 -0.00659 0.0105
(0.00316) (0.00526) (0.00817)
Smell -0.00211 -0.00353 0.00564
(0.00147) (0.00234) (0.00365)
Contamination -2.96e-05 -4.95e-05 7.91e-05
(0.00163) (0.00274) (0.00437)
Trust -0.00805** -0.0135*** 0.0215***
(0.00333) (0.00515) (0.00742)
Value for Money -0.00319 -0.00535 0.00854
(0.00274) (0.00453) (0.00708)
Value for Money, compared -0.00310 -0.00520 0.00830*
(0.00199) (0.00321) (0.00495)
Transparent Billing -0.00389* -0.00652* 0.0104**
(0.00211) (0.00339) (0.00513)
Table 4: Marginal Effects from Ordered Logit, General Waste
UNSATISFIED NEUTRAL SATISFIED
Marginal effects Marginal effects Marginal effects Cleaning + Maintenance -0.0138*** -0.0277*** 0.0415***
(0.00337) (0.00599) (0.00800)
Proximity -0.00600** -0.0121** 0.0181**
(0.00296) (0.00581) (0.00850)
Waste Accumulation -0.00573** -0.0116** 0.0173**
(0.00247) (0.00478) (0.00696)
Trust -0.00906*** -0.0183*** 0.0273***
(0.00332) (0.00647) (0.00924)
Value for Money -0.00906** -0.0183** 0.0273***
(0.00371) (0.00716) (0.0104)
Value for Money, compared 0.00119 0.00241 -0.00360
(0.00257) (0.00516) (0.00772)
Transparent Billing -0.00313 -0.00630 0.00943
(0.00286) (0.00572) (0.00850)
Demographics YES YES YES
Table 5: Marginal Effects from Ordered Logit, Recycling Waste
UNSATISFIED NEUTRAL SATISFIED
Marginal effects Marginal effects Marginal effects Cleaning + Maintenance -0.0159*** -0.0196*** 0.0354***
(0.00388) (0.00473) (0.00737)
Proximity -0.0123*** -0.0152*** 0.0274***
(0.00319) (0.00386) (0.00614)
Waste Accumulation -0.00528* -0.00651* 0.0118*
(0.00290) (0.00356) (0.00628)
Trust -0.0109*** -0.0134*** 0.0243***
(0.00381) (0.00470) (0.00794)
Value for Money -0.00862** -0.0106** 0.0193**
(0.00421) (0.00515) (0.00904)
Value for Money, compared 0.00436 0.00538 -0.00975
(0.00306) (0.00378) (0.00673)
Transparent Billing -0.00734** -0.00905** 0.0164**
(0.00343) (0.00424) (0.00739)
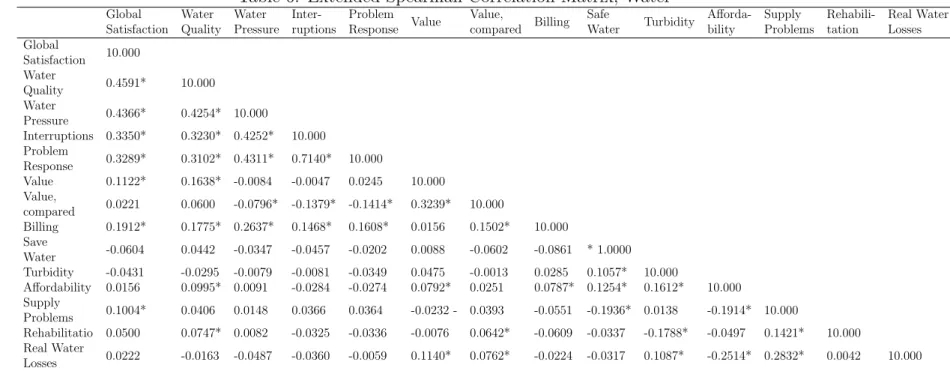
Table 6: Extended Spearman Correlation Matrix, Water Global Satisfaction Water Quality Water Pressure Inter-ruptions Problem Response Value Value, compared Billing Safe Water Turbidity Afforda-bility Supply Problems Rehabili-tation Real Water Losses Global Satisfaction 10.000 Water
Quality 0.4591* 10.000 Water
Pressure 0.4366* 0.4254* 10.000
Interruptions 0.3350* 0.3230* 0.4252* 10.000 Problem
Response 0.3289* 0.3102* 0.4311* 0.7140* 10.000
Value 0.1122* 0.1638* -0.0084 -0.0047 0.0245 10.000 Value,
compared 0.0221 0.0600 -0.0796* -0.1379* -0.1414* 0.3239* 10.000
Billing 0.1912* 0.1775* 0.2637* 0.1468* 0.1608* 0.0156 0.1502* 10.000 Save
Water -0.0604 0.0442 -0.0347 -0.0457 -0.0202 0.0088 -0.0602 -0.0861 * 1.0000 Turbidity -0.0431 -0.0295 -0.0079 -0.0081 -0.0349 0.0475 -0.0013 0.0285 0.1057* 10.000
Affordability 0.0156 0.0995* 0.0091 -0.0284 -0.0274 0.0792* 0.0251 0.0787* 0.1254* 0.1612* 10.000 Supply
Problems 0.1004* 0.0406 0.0148 0.0366 0.0364 -0.0232 - 0.0393 -0.0551 -0.1936* 0.0138 -0.1914* 10.000
Rehabilitatio 0.0500 0.0747* 0.0082 -0.0325 -0.0336 -0.0076 0.0642* -0.0609 -0.0337 -0.1788* -0.0497 0.1421* 10.000 Real Water
Losses 0.0222 -0.0163 -0.0487 -0.0360 -0.0059 0.1140* 0.0762* -0.0224 -0.0317 0.1087* -0.2514* 0.2832* 0.0042 10.000
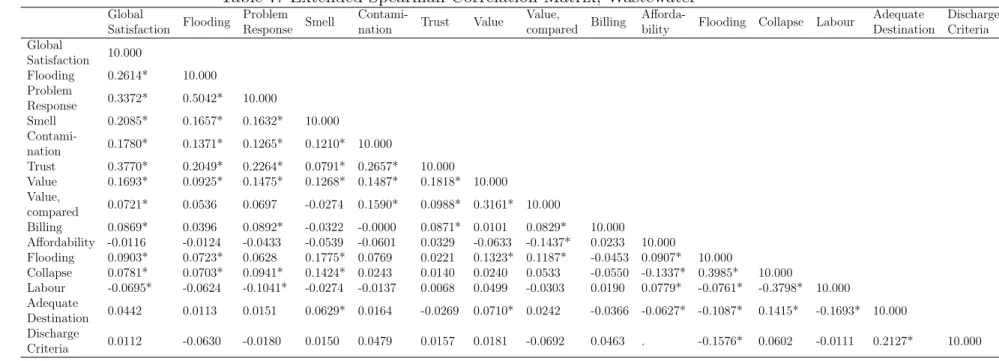
Table 7: Extended Spearman Correlation Matrix, Wastewater
Global
Satisfaction Flooding
Problem Response Smell
Contami-nation Trust Value
Value,
compared Billing
Afforda-bility Flooding Collapse Labour
Adequate Destination
Discharge Criteria Global
Satisfaction 10.000
Flooding 0.2614* 10.000 Problem
Response 0.3372* 0.5042* 10.000
Smell 0.2085* 0.1657* 0.1632* 10.000
Contami-nation 0.1780* 0.1371* 0.1265* 0.1210* 10.000
Trust 0.3770* 0.2049* 0.2264* 0.0791* 0.2657* 10.000
Value 0.1693* 0.0925* 0.1475* 0.1268* 0.1487* 0.1818* 10.000 Value,
compared 0.0721* 0.0536 0.0697 -0.0274 0.1590* 0.0988* 0.3161* 10.000
Billing 0.0869* 0.0396 0.0892* -0.0322 -0.0000 0.0871* 0.0101 0.0829* 10.000
Affordability -0.0116 -0.0124 -0.0433 -0.0539 -0.0601 0.0329 -0.0633 -0.1437* 0.0233 10.000
Flooding 0.0903* 0.0723* 0.0628 0.1775* 0.0769 0.0221 0.1323* 0.1187* -0.0453 0.0907* 10.000
Collapse 0.0781* 0.0703* 0.0941* 0.1424* 0.0243 0.0140 0.0240 0.0533 -0.0550 -0.1337* 0.3985* 10.000
Labour -0.0695* -0.0624 -0.1041* -0.0274 -0.0137 0.0068 0.0499 -0.0303 0.0190 0.0779* -0.0761* -0.3798* 10.000 Adequate
Destination 0.0442 0.0113 0.0151 0.0629* 0.0164 -0.0269 0.0710* 0.0242 -0.0366 -0.0627* -0.1087* 0.1415* -0.1693* 10.000 Discharge
Criteria 0.0112 -0.0630 -0.0180 0.0150 0.0479 0.0157 0.0181 -0.0692 0.0463 . -0.1576* 0.0602 -0.0111 0.2127* 10.000
Table 8: Extended Spearman Correlation Matrix, General Waste Global
Satisfaction
Cleaning/
Maintenance Proximity
Waste
Accumulation Trust Value
Value,
compared Billing
Accessi-bility
Clean Containers Global
Satisfaction 10.000
Cleaning/
Maintencance 0.4307* 10.000
Proximity 0.3160* 0.2635* 10.000
Waste
Accumulation 0.3300* 0.4100* 0.2349* 10.000
Trust 0.3315* 0.2974* 0.2761* 0.2565* 10.000
Value 0.2832* 0.2359* 0.1375* 0.0712 0.1593* 10.000
Value,
compared 0.2164* 0.2335* 0.1256* 0.0838* 0.1183* 0.4843* 10.000
Billing 0.1406* 0.1735* 0.1307* 0.1382* 0.1615* 0.0427 0.1842* 10.000
Accessibility -0.0628 -0.0462 -0.0674* -0.0818* -0.0551 0.0025 0.0226 -0.0691* 10.000
Clean
Containers -0.0155 -0.0053 -0.1037* -0.1356* -0.0543 0.0127 -0.0027 -0.0221 0.0560 10.000
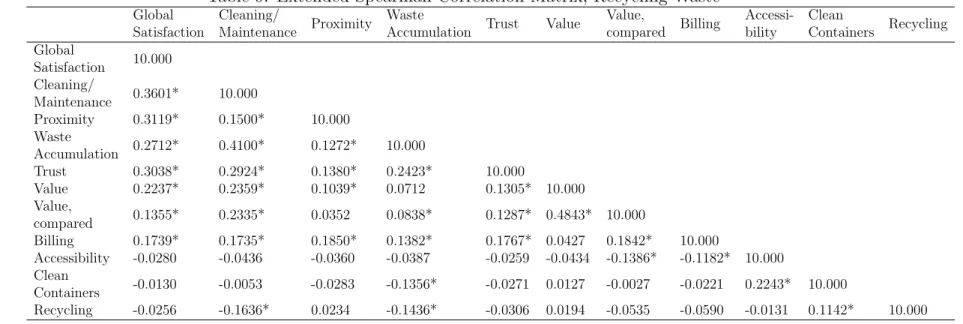
Table 9: Extended Spearman Correlation Matrix, Recycling Waste Global
Satisfaction
Cleaning/
Maintenance Proximity
Waste
Accumulation Trust Value
Value,
compared Billing
Accessi-bility
Clean
Containers Recycling
Global
Satisfaction 10.000
Cleaning/
Maintenance 0.3601* 10.000
Proximity 0.3119* 0.1500* 10.000
Waste
Accumulation 0.2712* 0.4100* 0.1272* 10.000
Trust 0.3038* 0.2924* 0.1380* 0.2423* 10.000
Value 0.2237* 0.2359* 0.1039* 0.0712 0.1305* 10.000
Value,
compared 0.1355* 0.2335* 0.0352 0.0838* 0.1287* 0.4843* 10.000
Billing 0.1739* 0.1735* 0.1850* 0.1382* 0.1767* 0.0427 0.1842* 10.000
Accessibility -0.0280 -0.0436 -0.0360 -0.0387 -0.0259 -0.0434 -0.1386* -0.1182* 10.000
Clean
Containers -0.0130 -0.0053 -0.0283 -0.1356* -0.0271 0.0127 -0.0027 -0.0221 0.2243* 10.000
Recycling -0.0256 -0.1636* 0.0234 -0.1436* -0.0306 0.0194 -0.0535 -0.0590 -0.0131 0.1142* 10.000