267
1. Ph.D.; Maternidade Odete Valadares/Fundação Hospitalar de MinasGerais (MOV/FHEMIG) and Hospital das Clínicas, Universidade Federal de Minas Gerais (UFMG), Belo Horizonte, MG, Brazil.
2. Ph.D.; Associate professor, Universidade Federal de Minas Gerais (UFMG), Belo Horizonte, MG, Brazil.
3. Associate professor, Department of Statistics, Institute of Exact Scien-ces, Universidade Federal de Minas Gerais (UFMG), Belo Horizonte, MG, Brazil.
Manuscript received Jan 26 2004, accepted for publication May 26 2004. Abstract
Objective: To assess the somatic growth of preterm newborns through growth curves during the first 12 weeks of life.
Method: A longitudinal and prospective study was carried out at two state operated maternity hospitals in the city of Belo Horizonte. Three hundred and forty preterm infants with birth weight less than 2,500 g were weekly evaluated in terms of body weight, head circumference, and height. Growth curves were constructed and adjusted to Counts model.
Results: Counts model clearly showed that the dynamics of loss, stabilization and gain of weight of all curves are graphically similar. The growth curve was characterized by weight loss during the 1st week (4-6 days) ranging from 5.9 to 9.7% (the greater the percentage, the lower the birth weight). For all curves, recovery of birth weight ranged from 16 to19 days, showing that these newborns took longer to recover their birth weight. After the 3rd week, the newborns maintained increasingly rates of weight gain. Head circumference and height curves are little affected by weight loss. However, newborns with low birth weight presented loss of head circumference and height, probably due to their lower gestational ages.
Conclusion: The dynamics of the preterm infants evaluated was similar to that of previous studies. The infants also presented growth deficit. However, it was also noted that the infants present a high potential to recover their growth.
J Pediatr (Rio J). 2004;80(4):267-76: Premature, growth curves, somatic growth.
Growth of preterm newborns
during the first 12 weeks of life
Lêni M. Anchieta,1 César C. Xavier,2 Enrico A. Colosimo3 Copyright © 2004 by Sociedade Brasileira de Pediatria
O
RIGINALA
RTICLEIntroduction
Growth monitoring in Pediatrics is widely used, especially by primary care professionals, who acknowledge the importance of using it as a routine practice and a criterion to assess good state of health. However, this practice is only applied at outpatient clinics, being totally neglected during hospital stay, which may sometimes be quite long. This aspect is particularly important in the case of preterm newborns, who, depending on the gestational age, need a long-term stay in the neonatal intensive care unit. Quite
often, the daily weight measurements made in these units are used to adjust fluid and nutritional requirements of newborns, but they are seldom interpreted based on different gestational ages, different birthweights, different clinical problems, and different corrected gestational ages. The use of growth curves for monitoring growth should also be a routine practice in neonatal units, considering that postnatal growth deficit in preterm newborns is still a serious problem.1,2 Moreover, this assessment is desirable and
necessary for the proper monitoring of children at primary care outpatient clinics.
However, assessing and interpreting the growth of preterm newborns is not an easy task, as there are several factors involved, such as nutrition, maturity, nutritional status at birth and clinical outcome.3-10
growth curves, using chronological age, based on the data obtained from 100 newborns. These curves are still used as reference for the evaluation of preterm newborns in current neonatal care. After this study,11 several other
growth curves using a similar methodology were published.12-21 All these references have methodological
differences and none of them can be regarded as ideal, as they show typical growth, given the current clinical care patterns, and not the ideal growth.
The specific aim of the present study is to assess the somatic growth of preterm newborns through a longitudinal and prospective analysis, from the moment of birth to 12 weeks of life, in the maternity wards of two public hospitals of Belo Horizonte.
Patients and methods
Singleton preterm newborns weighing less than 2,500 g, born at or admitted to the Odete Valadares maternity ward of Hospital Foundation of the State of Minas Gerais (MOV/FHEMIG) and at the Otto Cirne maternity ward of Hospital da Clínicas of Universidade Federal de Minas Gerais (HC/UFMG) were included in the study. Mothers or legal guardians agreed to participate in the study. The study protocol was approved by the Research Ethics Committee of Universidade Federal de Minas Gerais.
Three hundred newborns were assessed from January to December 1996, of whom 240 were appropriate-for-gestational age and 40 were small for appropriate-for-gestational age. Only the weight of appropriate-for-gestational-age newborns was assessed,22 resulting in a publication focused on the
weight growth of appropriate-for-gestational-age preterm newborns.21 Given the available database, we opted for
continuing this study;23 however the
for-gestational-age population of newborns was small, so another 40 small-for-gestational-age preterm newborns, weighing less than 2,500 g, were followed up from January to December 2000 in order to increase the sample size.
We carried out a prospective longitudinal study including all newborns who met the selection criteria. In 2000, only small for gestational age preterm newborns were assessed. Newborns with congenital infection and/or severe congenital malformations, severe neurological disorders, poor clinical outcome that interfered with the measurements or with parenteral and/or enteral nutrition, use of drugs or chemical substances by the mother, implementation of enteral nutrition after the first week of life and death during the study period, were excluded from the study.
Gestational age was calculated based on the information provided by mothers on the date of last menstruation, accepted as correct and confirmed by ultrasound examination before 20 weeks of gestation. If mothers were not sure about the date of last menstruation and ultrasound examination was not available, gestational age was confi rmed by cl i ni cal and neurol ogi cal evaluation,24 and in this case a two-week difference was
allowed. If this information could not be obtained, only the clinical and neurological evaluation was used.24
Intrauterine growth was assessed using the curve devised by Lubchenco et al.25 Newborns between the 10th and 90th
percentiles were regarded as appropriate-for-gestational-age (AGA) and those below the 10th percentile were considered small-for-gestational age (SGA).
A n t h r o p o m e t r i c m e a s u r e m e n t s ( w e i g h t , h e a d circumference and length) were made at the time of birth, on the third day, and after day 7 they were assessed weekly up to 84 days of life (12 weeks). The maximum time allowed for these measurements was of three hours of life at birth; ±1 day on the third and seventh day of life and ±2 days from the 14th to the 84th day. Clinical outcome, fluid and caloric intake were monitored using the same time intervals. Newborns were grouped according to their birthweight at intervals of 250 g, with a lower limit of 750 g included and an upper limit of 2,500 g excluded.
Nutritional counseling at both hospitals followed the routine nutritional care, and was aimed at meeting the caloric requirements of 120-130 kcal/kg/day and fluid requirements of 180-200 ml/kg/day, at the end of the second week of life. The infants were kept warm in incubators with or without a thermal tunnel, and with or without humidification, and heat loss was estimated, with appropriate adjustments of fluid rates. Parenteral nutrition, when indicated, was initiated on the third day of life the third day of life and suspended when enteral supply reached approximately 80 kcal/kg/day. Enteral nutrition was begun as soon as possible as minimal enteral nutrition, preferably using the mothers breastmilk. Standard diets used at the referred hospitals are: raw or pasteurized human milk, formulas for full-term and preterm newborns, and semi-elemental formulas for special cases. During the follow-up at the outpatient clinic, breastfeeding was always the first option, and relactation was attempted for high-risk newborns, who could not be breast-fed for a long period. If supplementation or use of artificial milk was necessary, the mothers were instructed to use full-term infant formula whenever possible.
Anthropometric measurements
Anthropometric measurements were made by a nurse or physician in charge of neonatal care at the time of birth. Other measurements were made by researchers in the morning, 1 hour before the first meal. At the outpatient clinic, measurements were made in the afternoon always at the same time.
R2A = 1 n 1 ( 1R2 )
n p
ì
î
ü
þ
1a. Second order polynomial:
y = b0 + b1 * time + b2 * time2
2 Logistic: y = p + alfa
1 + exp(b0 + b1* time)
3 Monomolecular (Jenss-Baykey):
y = alfa + p*time exp(b0 + b1* time)
4 Count:
y = alfa + p*time + b0 * LN (time+1) 1b. Third order polynomial:
y = b0 + b1 * time + b2 * time2+ b
3 * time3
The head circumference was measured with a non-stretchable, flexible steel tape, and the values were expressed in centimeters. The tape was fitted around the infants head, going from the supraorbital ridge to the occipital protuberance.
At the hospital and at the outpatient clinic, the newborns were measured with a neonatometer and caliper.26 For
length measurement, the newborn was placed on a length board in the supine position, the newborns head was held firmly against the headpiece, the legs were fully stretched and the feet were placed flat against the footpiece. The length was read on a millimetric ruler and the values were recorded in centimeters.
Statistical analysis
Epi Info, version 6.0, was used was used for weight, head circumference and length measurement analysis by calculating the mean, median and standard deviation.
Weight, head circumference and length data were submitted to statistical analysis so that mathematical models that could explain the behavior of longitudinal growth data were obtained. Hauspie27 published a review of some
mathematical models proposed in the literature to explain the behavior of growth curves. Bearing in mind simplicity and constant use in problems such as the ones shown below, we selected some models from this review:
where:
y corresponds to weight, head circumference and length (at each interval)
b0 , b1and b2are the estimated coefficients;
p is the number of parameters of the model.
The regression models were adjusted by the least squares method using the SPSS statistical software. Models 2 and 3 have nonlinear parameters and require special routines for their adjustment. Models 1a, 1b and 4 have linear parameters and the routines for their adjustments are available from all statistical softwares and Excel spreadsheets. Parameters were estimated considering all sampling values, as well as only the means of each recording
time. All predicted curves closely followed the observed curves. However, only Counts curve demonstrated a decrease in the second reading time (3 days).
The adjusted coefficient of determination (R2 A)28 is a
numerical criterion widely used to discriminate nonlinear regression models. The coefficient is expressed as follows:
where:
n: sample size;
p: number of model parameters;
R2: adjusted coefficient of determination by least squares. According to this criterion, Counts model showed the best behavior regarding the measurements of weight, head circumference and length.
Based on these results, we opted for Counts model, since it satisfactorily follows the behavior observed in growth curves, and it was the only model that decreased at the second recording time (3 days); it is easy to estimate because it has linear parameters; it has the best performance according to the numerical criterion (predicted value close to the observed value).
Results
We carried out a study with singleton preterm newborns weighing less than 2,500 g, born at the Odete Valadares/ FHEMIG maternity ward and at the Hospital das Clínicas/ UFMG. The study was conducted in two time periods, January to December 1996 and January to December 2000, after the parents agreed to participate. We determined the gestational age and assessed intrauterine growth, and excluded those patients who did not meet the inclusion criteria. In 1996, we followed up 300 newborns, 260 of whom were appropriate-for-gestational-age and 40 were small-for-gestational-age. In 2000, we assessed 40 small for gestational age newborns, in order to increase the sample size.
After determining the gestational age and classifying the newborns into appropriate for gestational age or small for gestational age, we excluded 149 newborns by using the pre-established criteria.
The sample therefore consisted of 358 (270 AGA and 88 SGA) singleton preterm newborns weighing less than 2,500 g. There was a loss of 18 newborns (5%) 10 (3.7%) AGA and eight (9.1%) SGA (five in 1996 and three in 2000). Of 340 newborns, 238 (70%) were born at the MOV/FHEMIG.
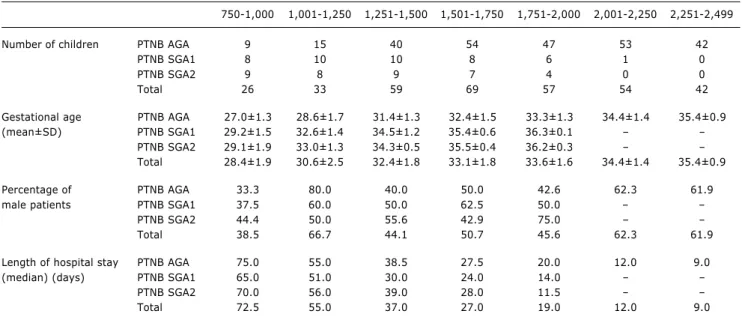
750-1,000 1,001-1,250 1,251-1,500 1,501-1,750 1,751-2,000 2,001-2,250 2,251-2,499
Number of children PTNB AGA 9 15 40 54 47 53 42
PTNB SGA1 8 10 10 8 6 1 0
PTNB SGA2 9 8 9 7 4 0 0
Total 26 33 59 69 57 54 42
Gestational age PTNB AGA 27.0±1.3 28.6±1.7 31.4±1.3 32.4±1.5 33.3±1.3 34.4±1.4 35.4±0.9 (mean±SD) PTNB SGA1 29.2±1.5 32.6±1.4 34.5±1.2 35.4±0.6 36.3±0.1
PTNB SGA2 29.1±1.9 33.0±1.3 34.3±0.5 35.5±0.4 36.2±0.3 Total 28.4±1.9 30.6±2.5 32.4±1.8 33.1±1.8 33.6±1.6 34.4±1.4 35.4±0.9
Percentage of PTNB AGA 33.3 80.0 40.0 50.0 42.6 62.3 61.9
male patients PTNB SGA1 37.5 60.0 50.0 62.5 50.0
PTNB SGA2 44.4 50.0 55.6 42.9 75.0
Total 38.5 66.7 44.1 50.7 45.6 62.3 61.9
Length of hospital stay PTNB AGA 75.0 55.0 38.5 27.5 20.0 12.0 9.0
(median) (days) PTNB SGA1 65.0 51.0 30.0 24.0 14.0
PTNB SGA2 70.0 56.0 39.0 28.0 11.5
Total 72.5 55.0 37.0 27.0 19.0 12.0 9.0
PTNB AGA = preterm newborn appropriate for gestational age; PTNB SGA1 = preterm newborn small for gestational age followed-up in the first period; PTNB SGA2 = preterm newborn small for gestational age followed-up in the second period; SD = standard deviation.
Table 1 - Some characteristics of the studied population according to birth weight
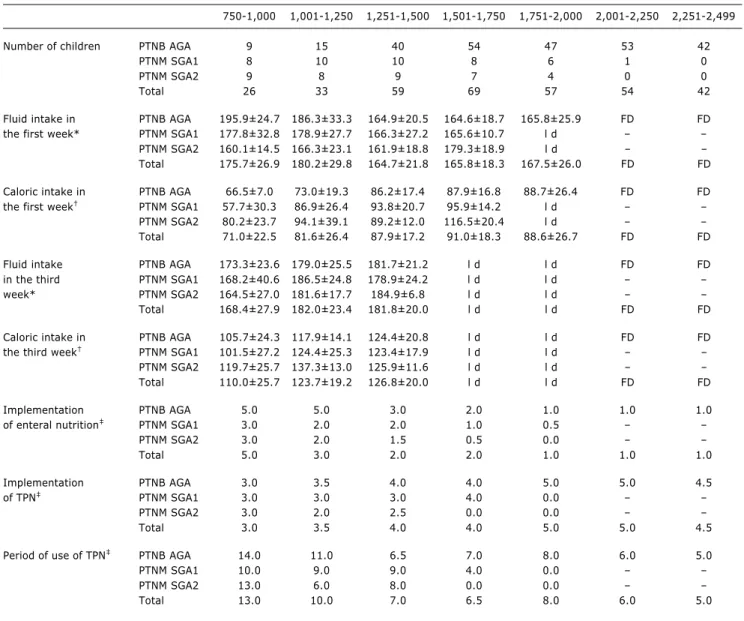
than 120 kcal/kg/day is only obtained after the third week of life, and the lower the birth weight, the later the implementation of enteral nutrition.
Among AGA newborns, exclusive breastfeeding predominates only up to the 14th day (46.2% of newborns). From the 21st day, exclusive breastfeeding (35.4%) combined with mixed feeding, that is, breastfeeding plus milk formula (21.1%), predominate over artificial feeding, designated here as exclusive use of milk formulas or cows milk in natura combined or not with sugar and flour (43.5%). At the end of the study period (84 days of life), 41 (35%) of the newborns were receiving exclusive breastfeeding; 22 (18.8%) were receiving breastmilk and milk formula and 54 (46.2%) were receiving artificial feeding.
Among SGA newborns (1996), exclusive breastfeeding also predominated only up to the 14th day (43.6%), and exclusive breastfeeding (28.2%) combined with mixed feeding (28.2%) predominated from the 21st day. At 84 days of life, 30.8% were receiving exclusive breastfeeding, 34.6% were receiving mixed feeding and 34.6% were receiving artificial feeding. It should be noted that the percentage of SGA newborns assessed in 1996 is quite similar to the percentage of SGA newborns assessed in 2000 as far as the type of nutrition is concerned. Therefore, at 14 days of life, 42.1% were receiving exclusive breastfeeding; at 21 days, 25% were receiving exclusive breastfeeding and 25% were receiving mixed feeding, w h e r e a s a t 8 4 d a y s , 3 2 . 4 % w e r e o n e x c l u s i v e breastfeeding, 32.4% on mixed feeding and 35.1% on artificial feeding.
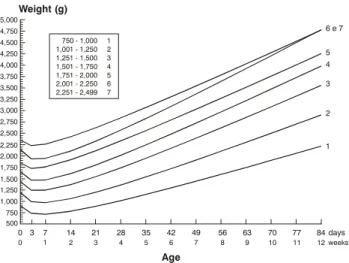
The number of newborns varied throughout the study period (Figure 1).
Figure 1 - Number of newborns according to birth weight category
80
No. of children in this study
75 70 65 60 55 50 45 40 35 30 25 20 15 10 5 0 0
0
0
1
14
2
21
3
28
4
35
5
42
Age 6
49
7
56
8
63
9
70
10
77
11
84 days
3 750 - 1,000 1,001 - 1,250 1,251 - 1,500 1,501 - 1,750 1,751 - 2,000 2,001 - 2,250 2,251 - 2,499
1 2 3 4 5 6 7
4
2 5 1
6 7
12 weeks
Table 2 - Some nutritional aspects according to the birth weight category
750-1,000 1,001-1,250 1,251-1,500 1,501-1,750 1,751-2,000 2,001-2,250 2,251-2,499
Number of children PTNB AGA 9 15 40 54 47 53 42
PTNM SGA1 8 10 10 8 6 1 0
PTNM SGA2 9 8 9 7 4 0 0
Total 26 33 59 69 57 54 42
Fluid intake in PTNB AGA 195.9±24.7 186.3±33.3 164.9±20.5 164.6±18.7 165.8±25.9 FD FD the first week* PTNM SGA1 177.8±32.8 178.9±27.7 166.3±27.2 165.6±10.7 l d
PTNM SGA2 160.1±14.5 166.3±23.1 161.9±18.8 179.3±18.9 l d Total 175.7±26.9 180.2±29.8 164.7±21.8 165.8±18.3 167.5±26.0 FD FD
Caloric intake in PTNB AGA 66.5±7.0 73.0±19.3 86.2±17.4 87.9±16.8 88.7±26.4 FD FD the first week PTNM SGA1 57.7±30.3 86.9±26.4 93.8±20.7 95.9±14.2 l d
PTNM SGA2 80.2±23.7 94.1±39.1 89.2±12.0 116.5±20.4 l d Total 71.0±22.5 81.6±26.4 87.9±17.2 91.0±18.3 88.6±26.7 FD FD
Fluid intake PTNB AGA 173.3±23.6 179.0±25.5 181.7±21.2 l d l d FD FD in the third PTNM SGA1 168.2±40.6 186.5±24.8 178.9±24.2 l d l d
week* PTNM SGA2 164.5±27.0 181.6±17.7 184.9±6.8 l d l d
Total 168.4±27.9 182.0±23.4 181.8±20.0 l d l d FD FD
Caloric intake in PTNB AGA 105.7±24.3 117.9±14.1 124.4±20.8 l d l d FD FD the third week PTNM SGA1 101.5±27.2 124.4±25.3 123.4±17.9 l d l d
PTNM SGA2 119.7±25.7 137.3±13.0 125.9±11.6 l d l d
Total 110.0±25.7 123.7±19.2 126.8±20.0 l d l d FD FD
Implementation PTNB AGA 5.0 5.0 3.0 2.0 1.0 1.0 1.0
of enteral nutrition PTNM SGA1 3.0 2.0 2.0 1.0 0.5
PTNM SGA2 3.0 2.0 1.5 0.5 0.0
Total 5.0 3.0 2.0 2.0 1.0 1.0 1.0
Implementation PTNB AGA 3.0 3.5 4.0 4.0 5.0 5.0 4.5
of TPN PTNM SGA1 3.0 3.0 3.0 4.0 0.0
PTNM SGA2 3.0 2.0 2.5 0.0 0.0
Total 3.0 3.5 4.0 4.0 5.0 5.0 4.5
Period of use of TPN PTNB AGA 14.0 11.0 6.5 7.0 8.0 6.0 5.0
PTNM SGA1 10.0 9.0 9.0 4.0 0.0
PTNM SGA2 13.0 6.0 8.0 0.0 0.0
Total 13.0 10.0 7.0 6.5 8.0 6.0 5.0
PTNB AGA = preterm newborn appropriate for gestational age; PTNB SGA1 = preterm newborn small for gestational age followed-up in the first period; PTNB SGA2 = preterm newborn small for gestational age followed-up in the second period; TPN = total parenteral nutrition; FD = free demand.
* Fluid intake in ml/kg/day (mean±standard deviation).
† Caloric intake in kcal/kg/day (mean±standard deviation). ‡ Age at implementation in days (median).
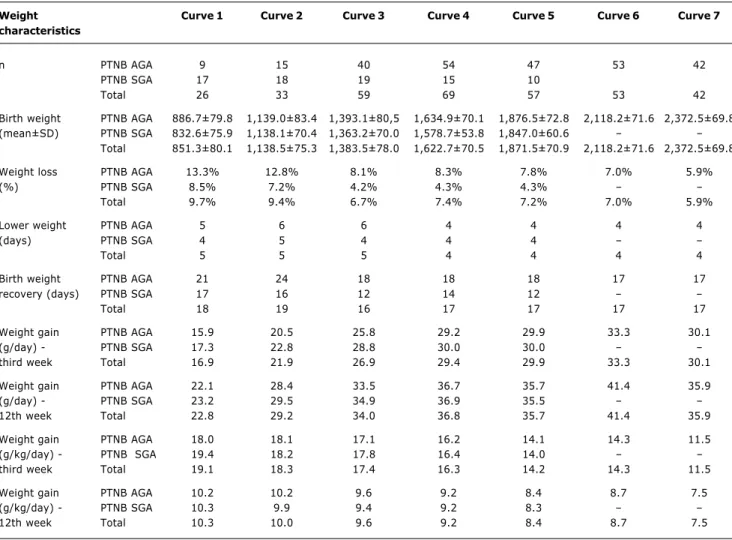
Growth dynamics is shown in a clear-cut manner. Figure 2 shows the classic biphasic curve, with initial weight loss and subsequent weight gain in all birth weight categories. Weight loss and weight gain are inversely proportional to birth weight, that is, smaller newborns lose more weight and take longer to recover it than do larger newborns (Table 3). The subsequent weight gain is proportional to birth weight when expressed in g/day and inversely proportional to birth weight if expressed in g/kg/day.
In Figure 3, differently from what occurred with weight, the decrease in head circumference at the second recording
time (3 days) is only evident for low birth weight newborns, especially for newborns in growth curves 1, 2 and 3, and less evident in curve 4. Growth curves 5, 6 and 7 do not demonstrate such decrease, being similar to a straight line. Gain in head circumference is inversely proportional to birth weight.
Figure 2 - Preterm newborns means of weight according to birth weight category, using Counts model
Figure 3 - Preterm newborns means of head circumference according to birth weight category, using Counts model
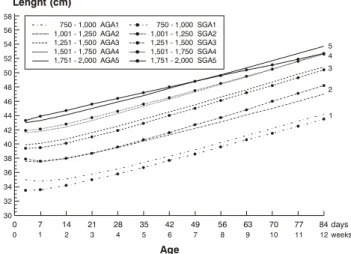
Figure 4 - Preterm newborns means of length according to birth weight category, using Counts model
0 3 0 7 1 14 2 21 3 28 4 35 5 42 Age 6 49 7 56 8 63 9 70 10 77 11 84 days 12 weeks Weight (g) 5,000 4,750 4,500 4,250 4,000 3,750 3,500 3,250 3,000 2,750 2,500 2,250 2,000 1,750 1,500 1,250 1,000 750 500
750 - 1,000 1,001 - 1,250 1,251 - 1,500 1,501 - 1,750 1,751 - 2,000 2,001 - 2,250 2,251 - 2,499
1 2 3 4 5 6 7
6 e 7
5 4 3 2 1 0 3 0 7 1 14 2 21 3 28 4 35 5 42 Age 6 49 7 56 8 63 9 70 10 77 11 84 days 12 weeks 40 38 36 34 32 30 28 26 24 22
750 - 1,000 1,001 - 1,250 1,251 - 1,500 1,501 - 1,750 1,751 - 2,000 2,001 - 2,250 2,251 - 2,499
1 2 3 4 5 6 7 Head circumference (cm)
6 e 5 7 4 3 2 1 0 3 0 7 1 14 2 21 3 28 4 35 5 42 Age 6 49 7 56 8 63 9 70 10 77 11 84 days 12 weeks 58 56 54 52 50 48 46 44 42 40 38 36 34 32 30
750 - 1,000 1,001 - 1,250 1,251 - 1,500 1,501 - 1,750 1,751 - 2,000 2,001 - 2,250 2,251 - 2,499
1 2 3 4 5 6 7 Lenght (cm) 5 6 7 4 3 2 1
We compared the growth of AGA and SGA newborns considering their weight, head circumference and length, as shown in Figures 5, 6 and 7, respectively. The growth of newborns was quite similar, although SGA newborns lose less weight, recover it more quickly and have larger head circumference mean values than AGA newborns. Somatic growth in length is quite similar between AGA and SGA newborns.
Discussion
The two hospitals where the study was conducted are considered referral maternity wards for high-risk deliveries and important centers for teaching, research and assistance. Although the data on SGA newborns were collected at two different time periods, the characteristics of both samples were similar (Tables 1 and 2), allowing us to analyze them together.
An interesting methodological aspect was the use of Counts model, initially described by Anchieta22 and later
reassessed by Ornelas.29 With special regard to weight,21
Counts model reliably shows the changes that occur during the growth of preterm newborns:30 weight loss,
which occurs in the first week of life (range of 4 to 5 days) in all curves; birth weight recovery, which occurs between the second and third weeks (range of 16 to 19 days) and weight gain. Somatic growth dynamics is graphically similar for all birth weight categories. Weight growth of newborns in the present study was similar to that described by most authors11-21 for preterm newborns. The different
results shown in several studies are not related to the weight growth model, but to the duration and velocity of growth in each phase of postnatal growth.
As for head circumference, there is an initial loss, shown by Counts model in curves 1, 2 and 3, which is possibly related to fluid loss (head shrinkage).31,32 These curves
Figure 5 - Means of weight of appropriate for gestational age (AGA) and small for gestational age (SGA) newborns according to birth weight category, using Counts model 0 3 0 7 1 14 2 21 3 28 4 35 5 42 Age 6 49 7 56 8 63 9 70 10 77 11 84 days 12 weeks 4,750 4,500 4,000 4,250 3,750 3,500 3,250 3,000 2,750 2,500 2,250 2,000 1,750 1,500 1,250 1,000 750 500 Weight (g)
750 - 1,000 1,001 - 1,250 1,251 - 1,500 1,501 - 1,750 1,751 - 2,000
750 - 1,000 1,001 - 1,250 1,251 - 1,500 1,501 - 1,750 1,751 - 2,000 AGA1 AGA2 AGA3 AGA4 AGA5 SGA1 2 3 4 5 SGA SGA SGA SGA 5 4 3 2 1
Table 3 - Distribution of characteristics of the dynamics of preterm newborns weight according to birth weight category
Weight Curve 1 Curve 2 Curve 3 Curve 4 Curve 5 Curve 6 Curve 7 characteristics
n PTNB AGA 9 15 40 54 47 53 42
PTNB SGA 17 18 19 15 10
Total 26 33 59 69 57 53 42
Birth weight PTNB AGA 886.7±79.8 1,139.0±83.4 1,393.1±80,5 1,634.9±70.1 1,876.5±72.8 2,118.2±71.6 2,372.5±69.8 (mean±SD) PTNB SGA 832.6±75.9 1,138.1±70.4 1,363.2±70.0 1,578.7±53.8 1,847.0±60.6
Total 851.3±80.1 1,138.5±75.3 1,383.5±78.0 1,622.7±70.5 1,871.5±70.9 2,118.2±71.6 2,372.5±69.8
Weight loss PTNB AGA 13.3% 12.8% 8.1% 8.3% 7.8% 7.0% 5.9%
(%) PTNB SGA 8.5% 7.2% 4.2% 4.3% 4.3%
Total 9.7% 9.4% 6.7% 7.4% 7.2% 7.0% 5.9%
Lower weight PTNB AGA 5 6 6 4 4 4 4
(days) PTNB SGA 4 5 4 4 4
Total 5 5 5 4 4 4 4
Birth weight PTNB AGA 21 24 18 18 18 17 17
recovery (days) PTNB SGA 17 16 12 14 12
Total 18 19 16 17 17 17 17
Weight gain PTNB AGA 15.9 20.5 25.8 29.2 29.9 33.3 30.1
(g/day) - PTNB SGA 17.3 22.8 28.8 30.0 30.0
third week Total 16.9 21.9 26.9 29.4 29.9 33.3 30.1
Weight gain PTNB AGA 22.1 28.4 33.5 36.7 35.7 41.4 35.9
(g/day) - PTNB SGA 23.2 29.5 34.9 36.9 35.5
12th week Total 22.8 29.2 34.0 36.8 35.7 41.4 35.9
Weight gain PTNB AGA 18.0 18.1 17.1 16.2 14.1 14.3 11.5
(g/kg/day) - PTNB SGA 19.4 18.2 17.8 16.4 14.0
third week Total 19.1 18.3 17.4 16.3 14.2 14.3 11.5
Weight gain PTNB AGA 10.2 10.2 9.6 9.2 8.4 8.7 7.5
(g/kg/day) - PTNB SGA 10.3 9.9 9.4 9.2 8.3
12th week Total 10.3 10.0 9.6 9.2 8.4 8.7 7.5
PTNB AGA = preterm newborn appropriate for gestational age; PTNB SGA = preterm newborn small for gestational age; SD = standard deviation.
Figure 6 - Means of head circumference of appropriate for gestational age (AGA) and small for gestational age (SGA) newborns according to birth weight category, using Counts model
0 0 7 1 14 2 21 3 28 4 35 5 42 Age 6 49 7 56 8 63 9 70 10 77 11 84 days 12weeks 40 38 36 34 32 30 28 26 24 22
Head circumference (cm)
5 4 3
2
1
750 - 1,000 1,001 - 1,250 1,251 - 1,500 1,501 - 1,750 1,751 - 2,000
Figure 7 - Means of length of appropriate for gestational age (AGA) and small for gestational age (SGA) newborns according to birth weight category, using Counts model
0
0
7
1
14
2
21
3
28
4
35
5
42
Age 6
49
7
56
8
63
9
70
10
77
11
84 days
12 weeks 58
56 54 52
50 48 46 44
42 40 38 36
34 32 30
Lenght (cm)
750 - 1,000 1,001 - 1,250 1,251 - 1,500 1,501 - 1,750 1,751 - 2,000
750 - 1,000 1,001 - 1,250 1,251 - 1,500 1,501 - 1,750 1,751 - 2,000 AGA1
AGA2 AGA3 AGA4 AGA5
SGA1 2 3 4 5 SGA SGA SGA SGA
5 4 3
2
1
As for length, similarly to head circumference, curves 1, 2 and 3 also have a steeper slope, revealing a larger increase in length for these newborns. However, the slope of these curves, compared to that of head circumference curves, is much smaller, probably due to the poor increase in length in relation to head circumference. Curves 4, 5, 6 and 7 show a linear growth. The mean lengths for large and small newborns (e.g.: curves 7 and 1), differently from head circumference, show the same variation at the beginning and at the end of the study period, that is, smaller newborns will continue to be smaller. In order to assess the recovery in length growth we need to have a longer follow-up period. Low birth weight newborns showed a decrease in length between the third and seventh days, which is possibly related to fluid loss (change in body fluids).
The separate analysis of growth curves for AGA and SGA preterm newborns does not allow us to detect differences between these two groups in terms of increase in weight, head circumference and length throughout the study period.
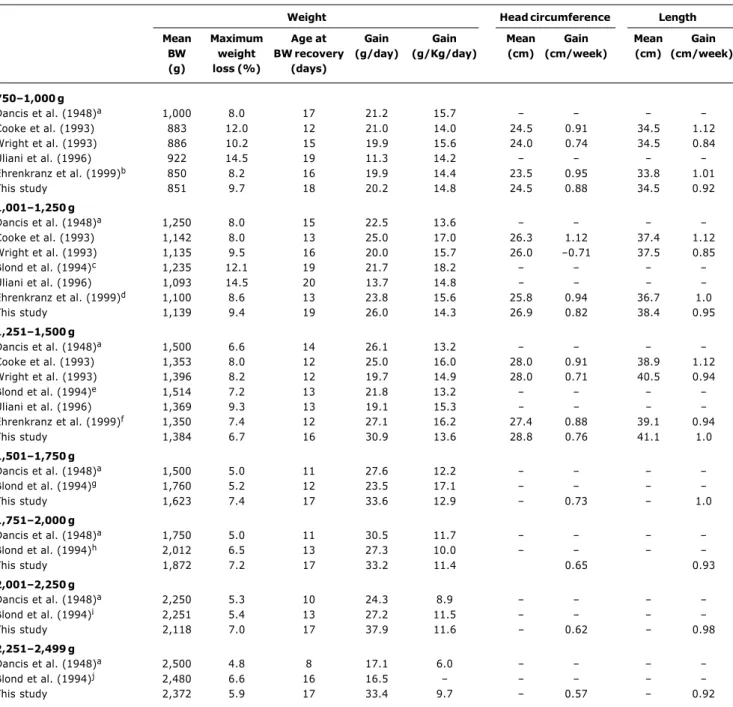
The growth of preterm newborns was assessed by observing the dynamics of increase and decrease in weight, head circumference and length. These results were compared with those obtained in other studies whose methodology is similar to the one used in the present study (Table 4). However, it should be highlighted that there are methodological differences between this study and other studies, which hamper the comparison of results, especially with regard to the different populations of newborns.
In the present study, although newborns weighing between 750 and 1,500 g have a rate of weight loss close to that observed by other authors, they take longer to recover their birth weight, but once they do it, they maintain a satisfactory weight gain. Possibly, fluid intake was responsible for a weight loss similar to that found by other authors for the first days of life (first week), but later, in the early neonatal period, there is a low caloric intake, which may delay birth weight recovery. It is at this stage that the clinical conditions of newborns are more unstable and thus hinder nutritional management.
Newborns weighing between 1,501-1,750 g and 1,751-2,000 g, differently from newborns of previous categories, did not receive a higher fluid intake, and therefore showed a more pronounced weight loss. Nevertheless, caloric intake between the first and second weeks was low, showing an inadequate nutritional support.
For newborns weighing between 2,000-2,250 g and 2,250-2,500 g, although the rate of weight loss is similar to that seen in other studies, the mean time to reach the birth weight was longer than in other studies. After the first week of life, these newborns were fed on demand, that is, they controlled food intake themselves. The duration of severe intercurrent complications in this category possibly interfered with birth weight recovery, together with other uncontrollable environmental factors.
Table 4 - Characteristics of weight, head circumference, length and gestational age according to birth weight category compared to other studies
Weight Head circumference Length
Mean Maximum Age at Gain Gain Mean Gain Mean Gain BW weight BW recovery (g/day) (g/Kg/day) (cm) (cm/week) (cm) (cm/week) (g) loss (%) (days)
7501,000 g
Dancis et al. (1948)a 1,000 8.0 17 21.2 15.7
Cooke et al. (1993) 883 12.0 12 21.0 14.0 24.5 0.91 34.5 1.12
Wright et al. (1993) 886 10.2 15 19.9 15.6 24.0 0.74 34.5 0.84
Uliani et al. (1996) 922 14.5 19 11.3 14.2
Ehrenkranz et al. (1999)b 850 8.2 16 19.9 14.4 23.5 0.95 33.8 1.01
This study 851 9.7 18 20.2 14.8 24.5 0.88 34.5 0.92
1,0011,250 g
Dancis et al. (1948)a 1,250 8.0 15 22.5 13.6
Cooke et al. (1993) 1,142 8.0 13 25.0 17.0 26.3 1.12 37.4 1.12
Wright et al. (1993) 1,135 9.5 16 20.0 15.7 26.0 0.71 37.5 0.85
Blond et al. (1994)c 1,235 12.1 19 21.7 18.2
Uliani et al. (1996) 1,093 14.5 20 13.7 14.8
Ehrenkranz et al. (1999)d 1,100 8.6 13 23.8 15.6 25.8 0.94 36.7 1.0
This study 1,139 9.4 19 26.0 14.3 26.9 0.82 38.4 0.95
1,2511,500 g
Dancis et al. (1948)a 1,500 6.6 14 26.1 13.2
Cooke et al. (1993) 1,353 8.0 12 25.0 16.0 28.0 0.91 38.9 1.12
Wright et al. (1993) 1,396 8.2 12 19.7 14.9 28.0 0.71 40.5 0.94
Blond et al. (1994)e 1,514 7.2 13 21.8 13.2
Uliani et al. (1996) 1,369 9.3 13 19.1 15.3
Ehrenkranz et al. (1999)f 1,350 7.4 12 27.1 16.2 27.4 0.88 39.1 0.94
This study 1,384 6.7 16 30.9 13.6 28.8 0.76 41.1 1.0
1,5011,750 g
Dancis et al. (1948)a 1,500 5.0 11 27.6 12.2
Blond et al. (1994)g 1,760 5.2 12 23.5 17.1
This study 1,623 7.4 17 33.6 12.9 0.73 1.0
1,7512,000 g
Dancis et al. (1948)a 1,750 5.0 11 30.5 11.7
Blond et al. (1994)h 2,012 6.5 13 27.3 10.0
This study 1,872 7.2 17 33.2 11.4 0.65 0.93
2,0012,250 g
Dancis et al. (1948)a 2,250 5.3 10 24.3 8.9
Blond et al. (1994)i 2,251 5.4 13 27.2 11.5
This study 2,118 7.0 17 37.9 11.6 0.62 0.98
2,2512,499 g
Dancis et al. (1948)a 2,500 4.8 8 17.1 6.0
Blond et al. (1994)j 2,480 6.6 16 16.5
This study 2,372 5.9 17 33.4 9.7 0.57 0.92
BW = birth weight. a Results obtained from graphics; b weight curve 701-1,000 g; c weight curve 1,125-1,375 g; d weight curve 1,001-1,200 g; and weight curve
1,375-1,625 g; f weight curve 1,201-1,500 g; g weight curve 1,625-1,875 g; h weight curve 1,875-2,125 g; i weight curve 2,125-2,375 g; j weight curve 2,375-2,625 g.
References
1. Ehrenkranz RA. Growth outcomes of very low-birth weight infants in the newborn intensive care unit. Clin Perinatol. 2000;27:325-45.
2. Lemons JA, Bauer CR, Oh W, Korones SB, Papile LA, Stoll BJ, et al. Very low birth weight outcomes of the National Institute of Child Health and human development neonatal research network, January 1995 through December 1996. NICHD Neonatal Research Network. Pediatrics. 2001;107(1):E1.
3. Berry MA, Abrahamowicz M, Usher RH. Factors associated with growth of extremely premature infants during initial hospitalization. Pediatrics. 1997;100:640-46.
4. Carlson SJ, Ziegler EE. Nutrient intakes and growth of very low birth weight infants. J Perinatol. 1998;18:252-8.
5. Thureen PJ. Early aggressive nutrition in the neonate. Pediatr Rev. 1999;20(9):e45-e55.
6. Premer DM, Georgieff MK. Nutrition for ill neonates. Pediatr Rev. 1999;20(9):e56-e62.
7. Cooke RJ, Embleton ND. Feeding issues in preterm infants. Arch Dis Child Fetal Ed. 2000;83(3):F215-18.
Corresponding author: Lêni Márcia Anchieta Rua Tupis, 426/1104
CEP 30190-060 - Belo Horizonte, MG, Brazil Tel.: +55 (31) 3222.1524
E-mail: [email protected] 9. Mamelle N, Cochet V, Claris O. Definition of fetal growth
restriction according to constitutional growth potential. Biol Neonate. 2001;80:277-85.
10. Steward DK, Pridham KF. Growth patterns of extremely low birth weight hospitalized preterm infants. J Obstet Gynecol Neonatal Nurses. 2002;31:57-65.
11. Dancis J, OConnell JR, Holt LE. A grid for recording the weight of premature infants. J Pediatr. 1948;33:570-2.
12. Brosius KK, Ritter DA, Kenny JD. Postnatal growth curve of the infant with extremely low birth weight who was fed enterally. Pediatrics. 1984;74:778-82.
13. Fenton TR, McMillan DD, Sauve RS. Nutrition and growth analysis of very low birth weight infants. Pediatrics. 1990;86: 378-83.
14. Cooke RJ, Ford A, Werkman, S, Conner C, Watson D. Postnatal growth in infants born between 700 and 1,500 g. J Pediatr Gastroenterol Nutr. 1993;16:130-5.
15. Wrigth K, Dawson JP, Fallis D, Vogt E, Lorch V. New postnatal growth grids for very low weight infants. Pediatrics. 1993;91: 922-6.
16. Itabashi K, Takeuchi T, Hayashi T, Okuyama K, Kuriya N, Otani Y. Postnatal reference growth curves for very low birth weight infants. Early Hum Dev. 1994;37:151-60.
17. Blond MH, Gold F, Kadiry LA, Rondeau C, Marchand S, Guérois M. Croissance pondérale post natale du prématuré: on peut continuer à utilisier les courbes de référence de Dancis (1948). Arch Pédiatr. 1994;1:1079-84.
18. Uliani ACCA, Carvalho R, Barros Filho AA. Evolução ponderal de recém-nascidos de muito baixo peso. J Pediatr (Rio J). 1996;72:388-93.
19. Pauls J, Bauer K, Versmold H. Postnatal body weight curves for infants below 1000 g birth weight receiving enteral and parenteral nutrition. Eur J Pediatr. 1998;157:416-21.
20. Ehrenkranz RA, Younes N, Lemons JA, Fanaroff AA, Donovan EF, Wright LL, et al. Longitudinal growth of hospitalized very low birth weight infants. Pediatrics. 1999;104:280-9.
21. Anchieta LM, Xavier CC, Colosimo EA, Souza MF. Ponderal development of preterm newborns during the first twelve weeks of life. Braz J Med Biol Res. 2003;36:761-70.
22. Anchieta LM. Evolução ponderal de recém-nascidos pré-termo adequados para a idade gestacional nas primeiras doze semanas de vida. MOV/FHEMIG-HC/UFMG, 1996-1997 [dissertação]. Belo Horizonte (MG): Faculdade de Medicina da Universidade Federal de Minas Gerais; 1998.
23. Anchieta LM. Crescimento de recém-nascidos pré-termo nas primeiras doze semanas de vida. [tese]. Belo Horizonte (MG): Faculdade de Medicina da Universidade Federal de Minas Gerais; 2003.
24. Ballard JL, Khoury JC, Wedig K, Wang L, Eilers-Walsman BL, Lipp R. New Ballard score, expanded to include extremely premature infants. J Pediatr. 1991;119:417-23.
25. Lubchenco LO, Hansman C, Dressler M, Boyd E. Intrauterine growth as estimated from liveborn birth-weight data at 24 to 42 weeks of gestation. Pediatrics. 1963;32:793-800.
26. Xavier CC. Crescimento de recém-nascidos pré-termo com idade gestacional de 26 a 36 semanas ao nascer até a 42ª semana de idade pós-menstrual corrigida. HCFMRP/USP-HCUFU-HCUFMG, 1989-1990 [tese]. Ribeirão Preto (SP): Faculdade de Medicina de Ribeirão Preto, Universidade de São Paulo; 1991. 27. Hauspie RC. Mathematical models for the study of individual growth patterns. Rev Epidemiol Sante Publique. 1989;37:461-76. 28. Draper NR, Smith H. Applied regression analysis. 2nd ed. New
York: Wiley; 1981.
29. Ornelas SL, Xavier CC, Colosimo EA. Crescimento de recém-nascidos pré-termo pequenos para a idade gestacional. J Pediatr (Rio J). 2002;78:230-6.
30. Gairdner D, Pearson J. A growth chart for premature and other infants. Arch Dis Child. 1971;46(250):783-87.
31. Williams J, Hirsch NJ, Corbet AJS, Rudolpfh AJ. Postnatal head shrinkage in small infants. Pediatrics. 1977;59:619-22. 32. Volpe JJ. Head growth, transilumination, neurophysiological