productivity of subnational entities in Brazil after the Fiscal
Responsibility Law
Paulo Rogério Faustino Matos
Universidade Federal do Ceará / Pós-Graduação em Economia (Caen/UFC) Fortaleza / CE — Brazil
We use panel data envelopment analysis on a sample that aims to model the process of social welfare generation by federation units. he irst innovation is the use of input sources associated with traditional revenues, such as transfers and taxes, as well as alternative sources of funding via national credit and paradiplomacy. As a result of this process, the State provides goods and services associated with socioeconomic variables such as, health, violence, demographics, study, and basic infrastructure. Only seven units, Bahia, Ceará, Maranhão, Minas Gerais, Pará, Paraná, and São Paulo, were entirely eicient in the decade studied (2004 to 2013). he incorporation of credit sources as inputs signiicantly inluences eiciency gains and changes to national ranking. he level of eiciency of some states might be compromised by excessive debt. In terms of public policy, the use of eiciency as a meritocracy metric in tax reform is suggested. Keywords: eiciency and productivity; credit and paradiplomacy; federative subnational entities; social welfare; debt.
Análise do impacto das fontes alternativas de financiamento na eficiência e na produtividade dos entes federativos subnacionais no Brasil após a Lei de Responsabilidade Fiscal
Este artigo faz uso da técnica de análise envoltória de dados em painel, para uma amostra balanceada com dados anuais de 2004 a 2013, visando modelar o processo de geração de bem-estar social por parte das unidades da federação. Uma primeira inovação está no uso de fontes de insumos associados às receitas tradicionais, como transferências e tributos, e de fontes alternativas de inanciamento, via crédito nacional e via paradiplomacia. Como resultado desse processo, o Estado proporciona produtos e serviços associados a variáveis de natureza socioeco-nômica, de saúde, de violência, de demograia, de estudo e de infraestrutura básica. Apenas sete unidades foram plenamente eicientes na década em questão: Bahia, Ceará, Maranhão, Minas Gerais, Pará, Paraná e São Paulo. A incorporação das fontes de crédito com insumos aumenta a eiciência dos estados, alterando o ranking nacional. O nível de eiciência de alguns estados pode vir a ser comprometido pelo endividamento excessivo. Em termos de política pública, sugere-se o uso da eiciência como métrica de meritocracia na reforma tributária.
Palavras-chave: eiciência e produtividade; crédito e paradiplomacia; entes federativos subnacionais; bem-estar social; endividamento.
Análisis de impacto de otras fuentes de financiación en la eficiencia y productividad de las entidades federadas subnacionales en Brasil Después de la Ley de Responsabilidad Fiscal
Este artículo utiliza envolvente de datos panel de la técnica de análisis de una muestra equilibrada de los datos anuales de 2004 a 2013, con el objetivo de modelar el proceso de generación de bienestar social por las unidades de la federación. La primera innovación es el uso de fuentes de entradas asociadas con recetas tradicionales, como las transferencias y los impuestos, así como fuentes alternativas de inanciación a través de crédito nacional y por medio de la paradiplomacia. Como resultado de este proceso, el Estado proporciona bienes y servicios asociados a variables de carácter socioeconómico, la salud, la violencia, la demografía, el estudio y la infraestructura básica. Sólo siete unidades eran totalmente eiciente en la década en cuestión, Bahía, Ceará, Maranhão, Minas Gerais, Pará, Paraná y Sao Paulo. La incorporación de fuentes de crédito con entradas inluye signiicativamente en la eiciencia y en el ranking nacional. El nivel de la eiciencia de algunos estados podría verse comprometido por la deuda excesiva. En términos de políticas públicas, se sugiere el uso de la eiciencia como métrica meritocracia en la reforma iscal. Palabras clave: eiciencia y productividad; crédito y paradiplomacia; las entidades federativas subnacionales; bienestar social; deuda.
DOI: http://dx.doi.org/10.1590/0034-7612162769
Article received on April 19, 2016 and accepted on September 20, 2016.
[Translated version] Note: All quotes in English translated by this article’s translator.
1. INTRODUCTION
he concept of eiciency is recurrent in international theoretical and empirical literature comparing countries, regions, states or municipalities on the allocation of resources and generation of social welfare. In this literature, it is common to observe the measurement of eiciency at the macro level — limited to modelling broad governmental items, such as health, education, income — as well as at the micro level, which is more speciic and focused in certain issues, such as ighting dengue virus.
he value added in modelling the eiciency of public management lies in the attempt to measure the level of satisfaction of the population regarding the ongoing management. here are also interna-tional institutions, such as the Internainterna-tional Monetary Fund (IMF) and the World Bank, which publicly express concern about national or subnational managements characterized as ineicient. However, despite the relevance, it seems there is not an extensive literature applied to Brazil, possibly due to the complexity of measuring eiciency (see Tanzi (1974) for a deeper understanding of limitations in conducting eiciency exercises).
In a didactic way, this complexity in measurement is due to the extraction of a wide and represen-tative set of inputs and products and service, since that many variables are latent or not observable
in Brazil and because measurement must allow ex post comparison between the objects of study. In
the case of public management and social welfare, there is a greater complexity: How can one deine a vector of weights for public services that is compatible or equivalent to the latent vector of social priorities? In short, what is the optimal form for products and services to be ofered by the state to society?
In this broad context of discussion about eiciency of the public institutions, this article aims to provide the most comprehensive and recent study on the eiciency of the 27 Brazilian states (including the federal district), ater the implementation of the Fiscal Responsibility Law (Supplementary Law No. 101 of May 4, 2000).
he study adopts a nonparametric linear mathematical programming technique, called data en-velopment analysis (DEA), for a balanced panel with annual data from 2004 to 2013. he study does not use the expenditures by budget items, because these tend to present a homogeneous pattern as the states tend to respect the Fiscal Responsibility Law (FRL), observing the limits and keeping to the base percentage of total revenues in most of the obligatory items. his article makes use of actual monetary values of revenues as input and of classic indicators as a proxy of the service provided by the state, following previous contributions, such as Afonso, Schuknecht and Tanzi (2005) and Maciel, Piza and Penof (2009).
More speciically, in terms of inputs from the process of social welfare generation, the study used ive revenue variables, including traditional revenues associated with taxes and transfers, as well as revenues obtained from credit operations contracted with national institutions and via paradiplomacy. As for the social welfare generated, the study uses 10 observable and measurable variables related to health, violence, demography, education, socioeconomic conditions and basic infrastructure.
broader and more representative than those used in previous analogous studies, this study contributes
when it compares such data with evidence obtained for ex ante periods of the FRL.
Unlike all other correlated studies, this article considers the relevance of the proactive efort of each Brazilian state to seek alternative funding sources. In addition to the traditional revenues, the states use credits ofered by national banks or negotiated between the state and international inancial and development agencies.
his main innovation of the article enables the discussion on the need, relevance and eiciency of
alternative sources of revenue for Brazilian states. It also allows inferring ex post impacts associated
with debt services contracted in local and foreign currency. Moreover, it is possible to deal with the intertemporal issue of the consolidated net debt stock, which today prevents states from honoring their commitments, as well as being part of the conditions in the relationship between the federal and state government, in the renegotiations of the debts of the states.
Methodologically, the study uses the DEA, as suggested by Charnes, Cooper and Rhodes (1978), but incorporates an indispensable extension: the Malmquist indexes, which allow inferring about the change of productivity of each ‘productive unit’ over time. his model, described in Fare and partners (1994), makes it possible to measure changes over time in terms of technology and in terms of total factor productivity.
Finally, the main purposes of this study are: (i) to infer about the eiciency levels of each state per year; (ii) aggregate this result into a single average and propose a ranking of the entire decade, comparing the results of technical eiciency (total, pure and in scale) with and without the incorporation of credit revenues as inputs; (iii) aggregate via Malmquist index and infer about gains and losses of diferent types of productivity; (iv) identify fully eicient states that can serve as reference for the ineicient; and (v) infer about patterns of the use of inputs and social welfare services generation. Speciically, in terms of public policies, the purposes are: (i) to analyze whether eiciency may be compromised in the future due to the debts contracted; and (ii) motivate the discussion of meritocracy through eiciency in controversial issues of interests of policy makers and society, such as tax reform.
he article is structured in ive sections: following this introduction, the next section presents a brief empiric literature review. he third and four sections present the methodology and the discussion of results, respectively. he ith and last section presents the conclusion.
2. EMPIRICAL LITERATURE REVIEW
Non-parametric linear mathematical programming techniques consist of tools of wide application on empirical studies in social sciences, with the purpose to measure eiciency and productivity of organizations that can be characterized as units with comparable production process. Gattoui and partners (2004) list more than 1,800 published examples using such techniques. It is possible to list their application on a variety of cases from the Brazilian inancial market, as presented by Matos and partners (2015), to speciic areas such as the eiciency in the public system of renal transplant, as presented by Costa and partners (2014).
industrialized countries, combining public expenditures that should be able to provide a given set of socioeconomic indicators. In Gupta and Verhoeven (2001), non-parametric mathematical frame-works are used to model the eiciency of 37 African governments in education and health. Clements (2002) measures the eiciency of education in the European Union. Afonso, Schuknecht and Tanzi (2005) analyze the eiciency in the public expenditure of countries of the Organization for Economic Cooperation and Development (OECD).
Studies closely related to the empirical exercise presented in this article include the work de-veloped by Machado Júnior, Iri and Benegas (2011), focusing on the municipalities of Ceará; the work by Schull, Feitósa and Hein (2014) about public safety in Brazil; and the work by Benegas and Da Silva (2014) applying the techniques to measure the eiciency of the national health system (SUS) in the Brazilian states. Finally, the most aligned empirical exercise to this study consists of Maciel, Piza and Penof (2009), who use data envelopment analysis (DEA) to discuss the eiciencies of Brazilian states from 1990 to 2000, but from a much more restricted set of variables than that proposed in this study.
3. METHODOLOGY
his article considers the 27 Brazilian states (including as “state” the federal district) as welfare producers, which are comparable to each other when it comes to inputs and services generated. It is assumed that the states are operating in an optimal scale, suggesting, in this case, the adoption of technical assumption of constant return of scale (CRS).
It is also assumed that the process of welfare generation from a variety of revenues as inputs can be modeled through DEA, a technique that aims, in the simplest way, at establishing what could be the limit of relative eiciency. he use of DEA is adequate, even if there are bad outputs (undesir-able services), because these outputs are translated through metrics, which can be normalized and transformed into desirable services, only for the purposes of DEA estimation. As an example, the poverty indicator given by the percentage of poor people is undesirable – in the sense of the greater the number, the worse is poverty. However, it is possible to work using the technique with the per-centage of non-poor.
his same normalization is used for all the bad outputs used in this work, so it is possible to use the characteristics of the DEA vis-a-vis the Directional Distance Function (DDF). hat is, each state generates only desirable public services and products, based on tax revenues, transfers, or other reg-ular revenues and revenues from national and international credit.
his normalization procedure simpliies the implementation of the concepts associated to the Malmquist index, useful for understanding the evolution of states over time. Formally, the outputs are deined by and the inputs by . hus, in a Brazilian state indexed by , the representative vector of this modeling will be given by and the set of production possibilities is represented by
P(x) = {(y)∈ℝM
+ | x can produce (y)} (1)
set. In this case, the limit of production for a Brazilian state i, modeled as a Decision Making Unit (DMU), can be given by
P(x)={(y)∈ℝM
+ | S
N
i=1 λixi ≤ x; S
N
i=1 λi yi ≥ y;λi ≥ 0; i = 1,2,...,N} (2)
In this relationship (2), is a constant of intensity, used for linear combinations of all the 27 states. he problem of maximizing the eiciency of the state subject to the constraints that all eiciencies oscillate between 0 and 1 can be rewritten in an equivalent way, in terms of envelopment, as follows:
minθ,λ θ
subject to
–yi + Yλ ≥ 0 (3)
θxi – Xλ ≥ 0
λ ≥ 0
In this enveloping problem that uses fewer constraints than the original form of the problem, λ is
a vector Nx1 composed of the intensity constants λi, while the value of θ endogenously measures the
ineiciency of the analyzed state, so that a null value would imply a state at its eiciency limit. his problem is solved N times, one for each state. Ater solving this problem T times, one for each panel period, Fare and partners (1994) specify an index that measures the change in Malmquist productivity between the periods t + 1, which is given by the following relationship, which consists of a geometric mean of the distance functions in t + 1:
m(yt+1, xt+1, yt, xt) =
[
dt(xt+1,yt+1) .dt+1(xt+1,yt+1)]
1/2
(4)
dt(x
t,yt) dt+1(xt,yt)
In case of assuming a value greater than 1, there is an increase in productivity over time, and the opposite is true: a value less than 1 implies a fall in productivity. Variations of this Malmquist index, as well as the derivation of the optimization problem, can be seen in Coelli (2008).
4. EMPIRICAL EXERCISE
4.1 DATABASE
4.1.1 INPUTS OF BRAZILIAN STATES
Regarding the inputs, it is observed that the main revenue sources are taxes and transfers. here are also other revenues such as those gained over assets, socioeconomic contribution, as well as con-tributions from the economic sectors. Aiming at establishing a more parsimonious framework, the irst inputs were grouped as tax revenues, transfer revenues and other revenues.
he main theoretical innovation of this study is the inclusion of items that capture the efort of each state to ind other funding sources, except those already listed, associated to credit operations. First, the internal credit contract operations, mostly contracted in local currency, usually obtained from Banco do Brasil, the National Social Development Bank (BNDES), Banco do Nordeste and other public banks. Second, by exploring the paradiplomatic ability of states, there are contractual foreign credit operations, all expressed in foreign currencies (US Dollar, Euro, Special Drawing Right or Japanese Yen), linked to foreign development agencies.
he credit activity of subnational entities does not consist of a recent phenomenon, as observed in Maia and Saraiva (2012), who presented and detailed operations with international organiza-tions developed during the time known as República Velha in Brazil, i.e., more than one century ago. However, in recent years there has been a more frequent experience of obtaining alternative sources from national public and private banks, as well as from paradiplomatic experience, both in developed countries and in emerging economies, which has attracted the attention of scientiic literature.
he practice of obtaining national credit is more common and well known, oten associated with speciic social programs or linked to Public-Private Partnerships (PPP). Paradiplomacy, on the other hand, seems to be less common, due to (among other things) the confusion of the use of this term. Considering the diversity of opinions and the diferent use of terms aimed at cap-turing the meaning of the paradiplomatic phenomenon, the word “paradiplomacy” was not the irst to be used to designate the international activities of subnational entities. As emphasized in Matos and Bessa (2014) the term “microdiplomacy” was used irst, in Paquin (2004) and Farias (2000). his expression was brought to the academic debate by Soldatos (1990) with the intention of designating the diplomatic activity developed between non-central political entities located in diferent states.
As a practical and recent example, the state of Ceará, whose paradiplomacy is the object of study in the work of Matos and Bessa (2014), contracted at the end of 2013 a credit operation with the World Bank of US $ 350 million, having a focus on results, in order to inance the Project to Support Economic Growth in Reducing Inequalities and Environmental Sustainability of Ceará — Program for Results (PforR Ceará).
All ive series of revenues were collected from the National Treasury Secretariat (STN). he
amounts were originally expressed in the national currency (Real R$), with the exception of the series
Continue
revenues are calculated in per capita terms, based on the annual population provided by the Brazilian Institute of Geography and Statistics (IBGE).
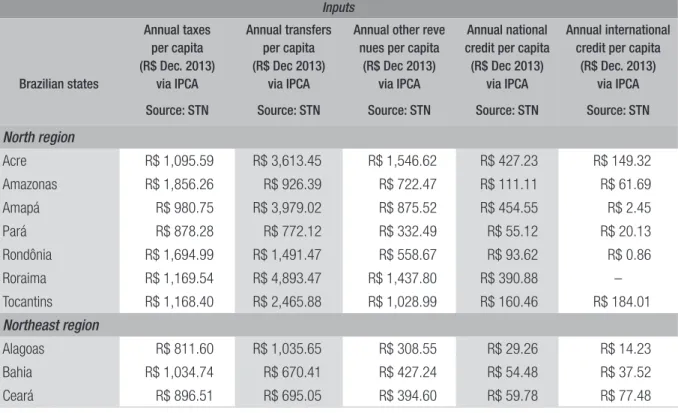
he real and per capita series of these ive revenue variables are the process inputs, whose average values per state in each region are reported in table 1.
he values presented in table 1 suggests that the items ‘other revenues’ and ‘credit’ are not negligible compared to traditional revenues. As for the proportion of each item in the total revenue, the states in the South and Southeast showed more than 60% of the total revenue coming from tax collection, while in the North, with the exception of the state of Amazonas, this participation ranged between 18% and 45%. Except in the case of Rio de Janeiro, the share of ‘other revenues’ in the states’ total revenue ranged from 14% to 28%.
Although it is not considered as an item to form the total revenues according to the public ac-counting that guides the preparation of the balance sheet of Brazilian states, the relationship between national credit and total revenue portrays an interesting picture. he states in the North region stood out with the highest average percentages, 5%, while in the other regions this level did not exceed 3%, except in Goiás (state in Central-West region). Regarding the relative volume associated with paradiplomatic activity of the states, the majority ranged between 0% and 2%. It is important to highlight the states of Ceará and Tocantins, which presented volumes over 4% of their total revenues related with paradiplomatic activity.
TABLE 1 ANNUAL AVERAGE AMOUNT OF THE CONSIDERED INPUTS (PERIOD: 2004-13)
Inputs
Brazilian states
Annual taxes per capita (R$ Dec. 2013)
via IPCA
Annual transfers per capita (R$ Dec 2013)
via IPCA
Annual other reve nues per capita (R$ Dec 2013)
via IPCA
Annual national credit per capita (R$ Dec 2013)
via IPCA
Annual international credit per capita
(R$ Dec. 2013) via IPCA
Source: STN Source: STN Source: STN Source: STN Source: STN
North region
Acre R$ 1,095.59 R$ 3,613.45 R$ 1,546.62 R$ 427.23 R$ 149.32
Amazonas R$ 1,856.26 R$ 926.39 R$ 722.47 R$ 111.11 R$ 61.69
Amapá R$ 980.75 R$ 3,979.02 R$ 875.52 R$ 454.55 R$ 2.45
Pará R$ 878.28 R$ 772.12 R$ 332.49 R$ 55.12 R$ 20.13
Rondônia R$ 1,694.99 R$ 1,491.47 R$ 558.67 R$ 93.62 R$ 0.86
Roraima R$ 1,169.54 R$ 4,893.47 R$ 1,437.80 R$ 390.88 –
Tocantins R$ 1,168.40 R$ 2,465.88 R$ 1,028.99 R$ 160.46 R$ 184.01
Northeast region
Alagoas R$ 811.60 R$ 1,035.65 R$ 308.55 R$ 29.26 R$ 14.23
Bahia R$ 1,034.74 R$ 670.41 R$ 427.24 R$ 54.48 R$ 37.52
Inputs
Brazilian states
Annual taxes per capita (R$ Dec. 2013)
via IPCA
Annual transfers per capita (R$ Dec 2013)
via IPCA
Annual other reve nues per capita (R$ Dec 2013)
via IPCA
Annual national credit per capita (R$ Dec 2013)
via IPCA
Annual international credit per capita
(R$ Dec. 2013) via IPCA
Source: STN Source: STN Source: STN Source: STN Source: STN
Maranhão R$ 586.28 R$ 864.95 R$ 241.07 R$ 77.13 R$ 27.49
Paraíba R$ 886.36 R$ 994.31 R$ 412.56 R$ 76.68 R$ 10.23
Pernambuco R$ 1,170.50 R$ 799.51 R$ 602.74 R$ 94.56 R$ 55.68
Piauí R$ 705.04 R$ 1,116.05 R$ 463.59 R$ 110.97 R$ 27.19
Rio Grande do Norte R$ 1,215.29 R$ 1,180.24 R$ 444.84 R$ 83.01 R$ 29.22
Sergipe R$ 1,123.91 R$ 1,560.99 R$ 770.85 R$ 122.34 R$ 34.51
Central-West region
Distrito Federal R$ 3,713.12 R$ 1,069.54 R$ 1,255.64 R$ 144.54 R$ 61.07
Goiás R$ 1,820.21 R$ 607.33 R$ 673.84 R$ 213.60 R$ 0.37
Mato Grosso do Sul R$ 2,415.65 R$ 820.30 R$ 885.86 R$ 52.00 R$ 31.29
Mato Grosso R$ 2,149.11 R$ 977.32 R$ 1,214.45 R$ 122.84 R$ 35.60
Southeast region
Espírito Santo R$ 2,681.70 R$ 792.30 R$ 943.65 R$ 142.03 R$ 23.91
Minas Gerais R$ 1,780.54 R$ 534.17 R$ 678.47 R$ 40.88 R$ 48.30
Rio de Janeiro R$ 2,053.19 R$ 517.77 R$ 1,134.73 R$ 109.29 R$ 53.67
São Paulo R$ 2,709.55 R$ 323.41 R$ 768.09 R$ 38.84 R$ 40.81
South region
Paraná R$ 1,789.31 R$ 613.33 R$ 327.15 R$ 18.00 R$ 7.38
Rio Grande do Sul R$ 2,143.61 R$ 588.46 R$ 813.55 R$ 23.37 R$ 41.70
Santa Catarina R$ 1,957.71 R$ 678.50 R$ 604.94 R$ 96.66 R$ 47.93
Source: Elaborated by the author.
4.1.2 BAD OUTPUTS OF BRAZILIAN STATES
he choice of measurable variables during the period 2004-13 for all states implies a dilemma, since
many variables that are a priori intuitive and interesting, do not satisfy this criterion because they are
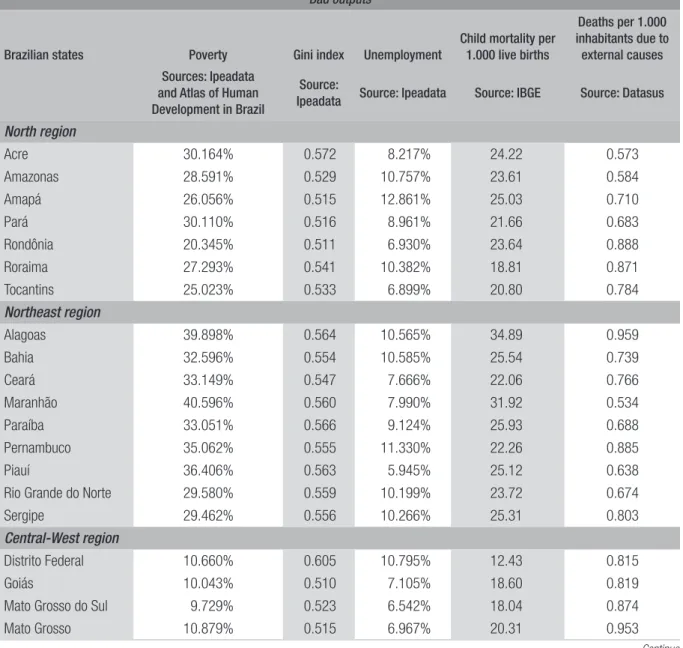
not accessible. hus, the variables associated with environmental, institutional, cultural, citizenship, communication and urbanism/transport issues are not considered. Observing diferent sources of data, the representative base of bad outputs is composed of social, safety, health and unemployment variables that can be considered of extreme relevance, whose average values are shown in table 2.
Continue
he degree of income inequality measured by the Gini Index assumes values between 0 (perfect equality in income distribution) and 1 (maximum inequality). Gini index presented little variation among the states and indicated a high concentration of income in the whole country in the period analyzed. A commonly reported pattern in the literature is that poorer regions or states are also more unequal, which was also observed in this study, except for the Distrito Federal, which had the lowest poverty indicator and the highest inequality indicator.
As for unemployment, there is heterogeneity even within the regions themselves. In the case of the Northeast, the state of Piauí, for instance, presented 5.94% unemployment rate whereas the neighbor state of Pernambuco showed 11.33%. In the South, the unemployment rate was more homogeneous with less than 6.10%.
TABLE 2 ANNUAL AVERAGE VALUE OF THE BAD OUTPUTS GENERATED (PERIOD: 2004-13)
Bad outputs
Brazilian states Poverty Gini index Unemployment
Child mortality per 1.000 live births
Deaths per 1.000 inhabitants due to
external causes
Sources: Ipeadata and Atlas of Human Development in Brazil
Source:
Ipeadata Source: Ipeadata Source: IBGE Source: Datasus
North region
Acre 30.164% 0.572 8.217% 24.22 0.573
Amazonas 28.591% 0.529 10.757% 23.61 0.584
Amapá 26.056% 0.515 12.861% 25.03 0.710
Pará 30.110% 0.516 8.961% 21.66 0.683
Rondônia 20.345% 0.511 6.930% 23.64 0.888
Roraima 27.293% 0.541 10.382% 18.81 0.871
Tocantins 25.023% 0.533 6.899% 20.80 0.784
Northeast region
Alagoas 39.898% 0.564 10.565% 34.89 0.959
Bahia 32.596% 0.554 10.585% 25.54 0.739
Ceará 33.149% 0.547 7.666% 22.06 0.766
Maranhão 40.596% 0.560 7.990% 31.92 0.534
Paraíba 33.051% 0.566 9.124% 25.93 0.688
Pernambuco 35.062% 0.555 11.330% 22.26 0.885
Piauí 36.406% 0.563 5.945% 25.12 0.638
Rio Grande do Norte 29.580% 0.559 10.199% 23.72 0.674
Sergipe 29.462% 0.556 10.266% 25.31 0.803
Central-West region
Distrito Federal 10.660% 0.605 10.795% 12.43 0.815
Goiás 10.043% 0.510 7.105% 18.60 0.819
Mato Grosso do Sul 9.729% 0.523 6.542% 18.04 0.874
Bad outputs
Brazilian states Poverty Gini index Unemployment
Child mortality per 1.000 live births
Deaths per 1.000 inhabitants due to
external causes
Sources: Ipeadata and Atlas of Human Development in Brazil
Source:
Ipeadata Source: Ipeadata Source: IBGE Source: Datasus
Southeast region
Espírito Santo 10.272% 0.523 7.869% 13.43 1.079
Minas Gerais 10.438% 0.514 7.707% 16.09 0.654
Rio de Janeiro 11.653% 0.543 9.684% 14.88 0.906
São Paulo 9.092% 0.505 8.880% 12.71 0.602
South region
Paraná 10.582% 0.504 5.906% 13.01 0.856
Rio Grande do Sul 10.703% 0.500 6.070% 11.96 0.662
Santa Catarina 5.660% 0.452 4.046% 11.85 0.657
Source: Elaborated by the author.
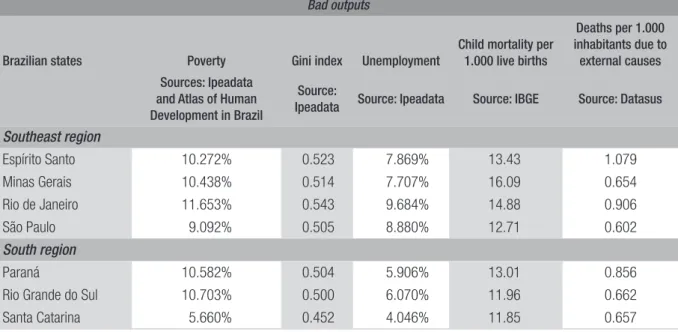
Regarding health, the choice of using the indicator ‘child mortality per 1,000 live births’ provided by the Brazilian Institute of Geography and Statistics (IBGE) is based on Afonso, Schuknecht and Tanzi (2005), who suggest that this information is minimally representative of the complex panorama of health as a whole. While the disparity in average terms was three times when it comes to income, or even four times in the case of credit, in health — based on child mortality per 1,000 live births — it was observed that mortality ranged from 22 to almost 35 deaths per 1,000 live births in the Northeast, while in the South this igure was 13 at most. In average terms, there was a ratio of child mortality approximately twice as high in the Northeast as in the South.
In terms of security, by the asymmetry of standards and information among states’ public safety secretariats, the information homogeneously collected and made available in Datasus on deaths from external causes per thousand inhabitants is a standard proxy for capturing the wide and difuse sense of safety in society (Jorge et al., 2007).
Here, there is a very diferent pattern from the other indicators analyzed. he Northeast and North no longer appeared as the regions with the worst indicators. he Central-West region presented the worst indicators, followed by states from the Southeast region. he igures close to one death per thousand inhabitants observed in the average in Mato Grosso and Espírito Santo were almost double the igures observed in states of the North and Northeast regions.
4.1.3 GOOD OUTPUTS OF BRAZILIAN STATES
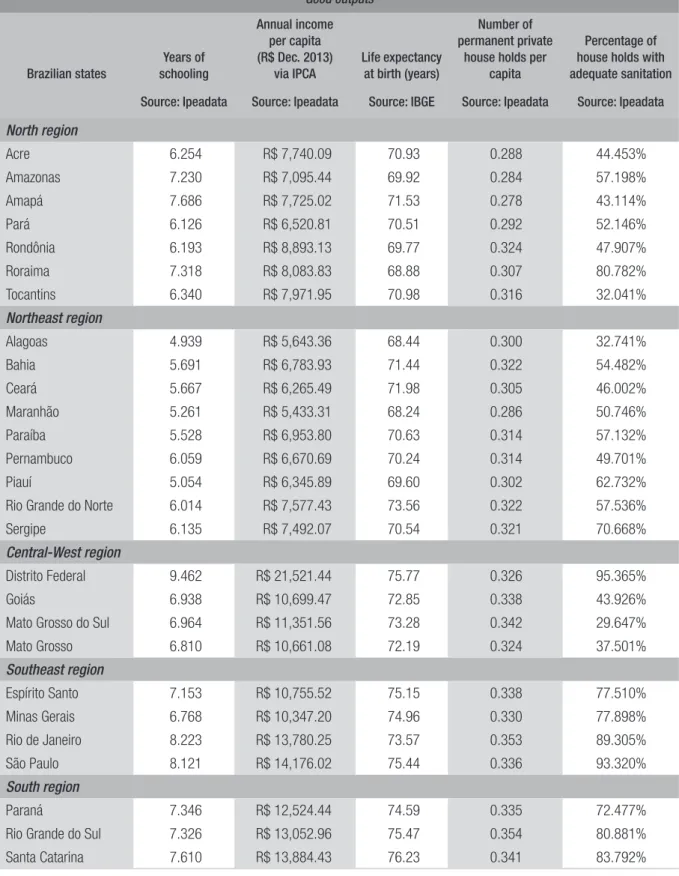
Table 3 shows the average value of good outputs provided by the state such as relevant variables on macroeconomics, demographics, human capital and infrastructure.
TABLE 3 AVERAGE VALUE OF GOOD OUTPUTS GENERATED (PERIOD: 2004-2013)
Good outputs
Brazilian states
Years of schooling
Annual income per capita (R$ Dec. 2013)
via IPCA
Life expectancy at birth (years)
Number of permanent private
house holds per capita
Percentage of house holds with adequate sanitation
Source: Ipeadata Source: Ipeadata Source: IBGE Source: Ipeadata Source: Ipeadata
North region
Acre 6.254 R$ 7,740.09 70.93 0.288 44.453%
Amazonas 7.230 R$ 7,095.44 69.92 0.284 57.198%
Amapá 7.686 R$ 7,725.02 71.53 0.278 43.114%
Pará 6.126 R$ 6,520.81 70.51 0.292 52.146%
Rondônia 6.193 R$ 8,893.13 69.77 0.324 47.907%
Roraima 7.318 R$ 8,083.83 68.88 0.307 80.782%
Tocantins 6.340 R$ 7,971.95 70.98 0.316 32.041%
Northeast region
Alagoas 4.939 R$ 5,643.36 68.44 0.300 32.741%
Bahia 5.691 R$ 6,783.93 71.44 0.322 54.482%
Ceará 5.667 R$ 6,265.49 71.98 0.305 46.002%
Maranhão 5.261 R$ 5,433.31 68.24 0.286 50.746%
Paraíba 5.528 R$ 6,953.80 70.63 0.314 57.132%
Pernambuco 6.059 R$ 6,670.69 70.24 0.314 49.701%
Piauí 5.054 R$ 6,345.89 69.60 0.302 62.732%
Rio Grande do Norte 6.014 R$ 7,577.43 73.56 0.322 57.536%
Sergipe 6.135 R$ 7,492.07 70.54 0.321 70.668%
Central-West region
Distrito Federal 9.462 R$ 21,521.44 75.77 0.326 95.365%
Goiás 6.938 R$ 10,699.47 72.85 0.338 43.926%
Mato Grosso do Sul 6.964 R$ 11,351.56 73.28 0.342 29.647%
Mato Grosso 6.810 R$ 10,661.08 72.19 0.324 37.501%
Southeast region
Espírito Santo 7.153 R$ 10,755.52 75.15 0.338 77.510%
Minas Gerais 6.768 R$ 10,347.20 74.96 0.330 77.898%
Rio de Janeiro 8.223 R$ 13,780.25 73.57 0.353 89.305%
São Paulo 8.121 R$ 14,176.02 75.44 0.336 93.320%
South region
Paraná 7.346 R$ 12,524.44 74.59 0.335 72.477%
Rio Grande do Sul 7.326 R$ 13,052.96 75.47 0.354 80.881%
Santa Catarina 7.610 R$ 13,884.43 76.23 0.341 83.792%
he variable ‘annual income per capita’ presented strong inequality, evidence quite common in the literature. he highest average amounts of income were in Distrito Federal, with over R$ 21,000, followed by São Paulo and Santa Catarina, with amounts close to R$ 14,000. At the other end, with lower average incomes, were the states of Maranhão and Alagoas in the Northeast, with values close to R$ 5,500. his context suggests a relection: if human and inancial capital are fundamental to in-come convergence and subsequent reduction of inequality between the rich and the poor, the strong heterogeneity of all variables, such as credit and education, when comparing Northeast and North versus South and Southeast, suggests that these capital vectors can be increasing divergences, rather than reducing them.
Regarding the demographic variable ‘life expectancy at birth’, it relects in a single metric the inluences of several others variables of social and economic (among others) dimensions. his variable is an unusual indicator of social welfare, but relevant in this analysis. Again, the regional disparity was evidenced, as shown in table 3. It was clear that, considering the North and North-east regions, only Rio Grande do Norte had expectations comparable to the expectations of the states in the other regions. In terms of the average, the expectation in these two most unassisted regions was approximately 70.5 years, much lower than the average in the South, for example, 75.5 years old.
Taking into account the realities of the societies in each state in terms of social infrastructure (housing, represented by the indicator ‘number of private households per capita’ or living condi-tions, expressed by the indicator ‘percentage of households with adequate sanitation’), the disparity among the regions was clear. For instance, the state with fewer private households per capita in the Central-West, South and Southeast regions was Mato Grosso, with 0.324. his number was equiva-lent to that registered in Rondônia and Sergipe, states that presented the highest number of private households per capita in the other regions.
his situation was exacerbated by the fact that these houses in the North, Northeast and also Central-West regions, with exceptions of Distrito Federal, Roraima and Sergipe, were characterized by a lack of adequate sanitation in very high percentages. While in São Paulo and the Distrito Federal, more than 90% of the homes had adequate sanitation, in Tocantins and Alagoas, just over 30% had this basic condition of decent housing. On average, in the most deprived areas, less than 55% of the homes had sewage, whereas in the South and Southeast the average values exceeded 80%.
4.3 RESULTS OF EFFICIENCY DISAGGREGATED OVER TIME
GRAPH 1 DEVELOPMENT OF TECHNICAL EFFICIENCY OF STATES IN BRAZIL’S NORTH REGION (PERIOD: 2004-13)
100.00%
95.00%
90.00%
85.00%
80.00%
75.00%
70.00%
65.00%
60.00%
55.00%
AC AM AP PA RO RR TO
2004 2005 2006 2007 2008 2009 2010 2011 2012 2013
Source: Elaborated by the author.
he Northeast region had the most technically 100% eicient states in each of the 10 analyzed years: Bahia, Ceará and Maranhão. States such as Alagoas, Paraíba and Piauí had correlated oscil-lations characterized by ineiciencies higher than 10% between 2007 and 2010 and, consequently, full and robust eiciency in the years following (2011-2013). With a very idiosyncratic pattern, the state of Pernambuco had an average eiciency of 92.49%, higher than Rio Grande do Norte and Sergipe, whose ineiciencies above 25% in 2008 led to average eiciencies of around 80%, as shown in graph 2.
GRAPH 2 DEVELOPMENT OF TECHNICAL EFFICIENCY OF STATES IN BRAZIL’S NORTHEAST REGION (PERIOD: 2004-13)
100.00%
95.00%
90.00%
85.00%
80.00%
75.00%
70.00%
65.00%
AL BA CE MA PB PE PI RN SE
2004 2005 2006 2007 2008 2009 2010 2011 2012 2013 Source: Elaborated by the author.
GRAPH 3 DEVELOPMENT OF TECHNICAL EFFICIENCY OF STATES IN BRAZIL’S CENTRAL-WEST
REGION (PERIOD: 2004-13)
In the Southeast, except for the state of Espírito Santo that presented a behavior characterized by strong ineiciency as of 2005, the other states were 100% eicient. In the case of São Paulo and Minas Gerais, 100% eicient at all times, and in the case of Rio de Janeiro during the latter years, as shown in graph 4.
GRAPH 4 DEVELOPMENT OF TECHNICAL EFFICIENCY OF STATES IN BRAZIL’S SOUTHEAST
REGION (PERIOD: 2004-13)
Source: Elaborated by the author.
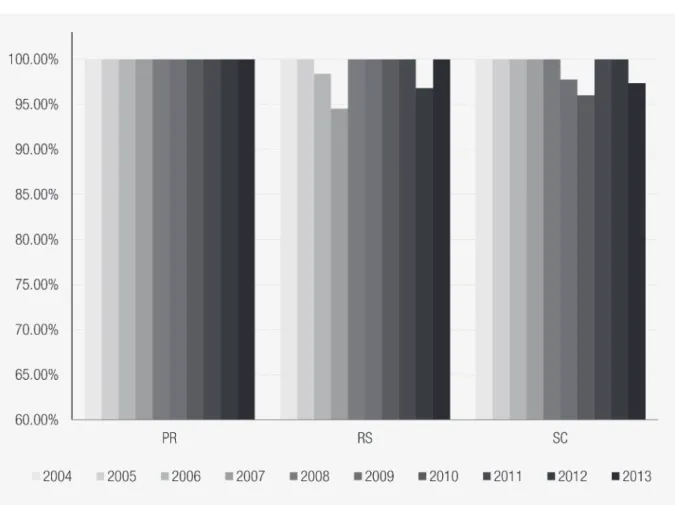
GRAPH 5 DEVELOPMENT OF TECHNICAL EFFICIENCY OF STATES IN BRAZIL’S SOUTH REGION (PERIOD: 2004-13)
Source: Elaborated by the author.
4.3 RESULTS OF EFFICIENCY AGGREGATED OVER TIME
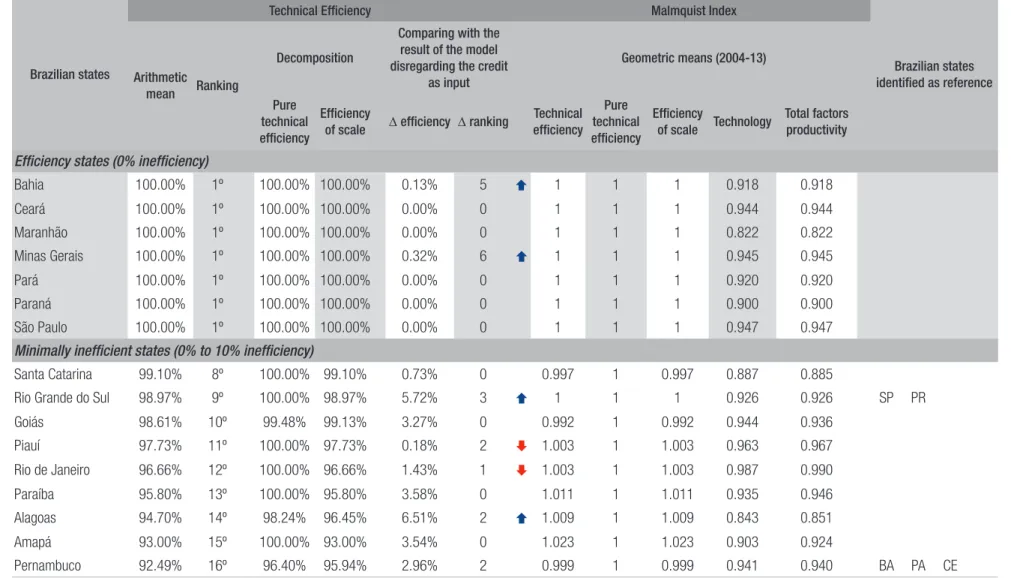
Table 4 shows the average total eiciency in the second column. he following columns show the decompositions into pure technical eiciency and scale eiciency.
Regarding the second objective of this article, in order to provide better visualization and strat-iication, the states were segmented and characterized in groups according to their eiciency. he states were categorized according to their eiciency throughout the decade (seven in total): the least ineicient (eiciency superior to 90% on average); the moderately eicient (eiciency ranges from 80% to 90%); and the very ineicient (eiciency level is less than 80%).
he elaborated ranking also allows comparing the eiciency of the states over these two decades, and it is possible to identify a considerable change before and ater the Fiscal Responsibility Law. It is important to emphasize that these diferences are also due to the sets of inputs and outputs used in both studies, which are very diferent. In Maciel, Piza and Penof (2009), two inputs and two outputs were used, whereas in this work there were ive inputs and 10 outputs.
In this set of variables, one of the innovations proposed is the incorporation of revenues associ-ated with the proactivity of state governments in seeking external funding through credit operations contracted with national or foreign inancial agencies. In order to measure whether the efect of this additional source as input in the DEA was a diferential for the results, the diferentials in ranking and aggregate technical eiciency are shown in columns 6 and 7 of table 4. he table considers the reported result (using credit as input) and the unreported result that is based only on the three tra-ditional inputs in terms of revenue sources.
Initially, there was no reduction of eiciency when considering the revenues of national or in-ternational credit operations in any of the states, with an average eiciency gain of 3.61%. Clearly, the most eicient states with credit remain the most eicient states without credit as input. In the results considering credit, only Bahia and Minas Gerais came to full eiciency, making up the group previously formed by only ive states when credit was not considered.
Changes in the ranking when considering credits were more intense for the less eicient states. In this new context of analysis, Bahia, Minas Gerais, Rio Grande do Sul, Alagoas, Sergipe, Acre and Rondônia got a better position in the ranking. States with downward arrows in red, such as Rio de Janeiro and Piauí, despite the eiciency gains, had — in relative terms — worsened in the ranking that takes into account the input ‘credit’ in the data envelopment analysis.
Regarding the third objective of this article, columns 8 to 12 of table 3 show the average produc-tivity indexes over the decade 2004-13 (value higher than 1 suggests producproduc-tivity gain). It is possible to show that, unlike the results for the decade from 1991 to 2000 (Maciel, Piza and Penof, 2009), in which productivity was gained for all states, this article identiied that states such as Santa Catarina, Goiás, Pernambuco, Amazonas and Espírito Santo presented loss of productivity in terms of total technical eiciency, even in small percentages, ranging from 0.1% in Pernambuco to 1.4% in Espírito Santo, considering the whole decade 2004-13.
he fully eicient states did not show an evolution in productivity and the others had a gain ranging from 0.3% in Piauí and Rio de Janeiro to 4.3% in Acre. hese values, except for the states characterized as very ineicient, are all associated with eiciency gain via scale and not via pure technical eiciency.
BRAZILIAN JOURNAL OF PUBLIC ADMINISTRA TION | R io d e J a n e iro 51( 4) :482-508, July - Aug. 2 0 17 RAP |
Alternative funding sources’ impact on efficiency and productivity of subnational entities in Br
azil after the Fiscal Responsibility Law
499
Continue
TABLE 4 AGGREGATE RESULTS OVER TIME (PERIOD: 2004-13)
Brazilian states
Technical Eficiency Malmquist Index
Brazilian states identiied as reference Arithmetic
mean Ranking
Decomposition
Comparing with the result of the model disregarding the credit
as input
Geometric means (2004-13)
Pure technical eficiency
Eficiency
of scale D eficiency D ranking
Technical eficiency Pure technical eficiency Eficiency
of scale Technology
Total factors productivity
Efficiency states (0% inefficiency)
Bahia 100.00% 1º 100.00% 100.00% 0.13% 5 1 1 1 0.918 0.918
Ceará 100.00% 1º 100.00% 100.00% 0.00% 0 1 1 1 0.944 0.944 Maranhão 100.00% 1º 100.00% 100.00% 0.00% 0 1 1 1 0.822 0.822 Minas Gerais 100.00% 1º 100.00% 100.00% 0.32% 6 1 1 1 0.945 0.945 Pará 100.00% 1º 100.00% 100.00% 0.00% 0 1 1 1 0.920 0.920 Paraná 100.00% 1º 100.00% 100.00% 0.00% 0 1 1 1 0.900 0.900 São Paulo 100.00% 1º 100.00% 100.00% 0.00% 0 1 1 1 0.947 0.947 Minimally inefficient states (0% to 10% inefficiency)
Santa Catarina 99.10% 8º 100.00% 99.10% 0.73% 0 0.997 1 0.997 0.887 0.885
Rio Grande do Sul 98.97% 9º 100.00% 98.97% 5.72% 3 1 1 1 0.926 0.926 SP PR
Goiás 98.61% 10º 99.48% 99.13% 3.27% 0 0.992 1 0.992 0.944 0.936 Piauí 97.73% 11º 100.00% 97.73% 0.18% 2 1.003 1 1.003 0.963 0.967 Rio de Janeiro 96.66% 12º 100.00% 96.66% 1.43% 1 1.003 1 1.003 0.987 0.990
Paraíba 95.80% 13º 100.00% 95.80% 3.58% 0 1.011 1 1.011 0.935 0.946 Alagoas 94.70% 14º 98.24% 96.45% 6.51% 2 1.009 1 1.009 0.843 0.851
Amapá 93.00% 15º 100.00% 93.00% 3.54% 0 1.023 1 1.023 0.903 0.924
BRAZILIAN JOURNAL OF PUBLIC ADMINISTRA TION | R io d e J a n e iro 51( 4) :482-508, July - Aug. 2 0 17 RAP |
Alternative funding sources’ impact on efficiency and productivity of subnational entities in Br
azil after the Fiscal Responsibility Law
500
Brazilian states
Technical Eficiency Malmquist Index
Brazilian states identiied as reference Arithmetic
mean Ranking
Decomposition
Comparing with the result of the model disregarding the credit
as input
Geometric means (2004-13)
Pure technical eficiency
Eficiency
of scale D eficiency D ranking
Technical eficiency Pure technical eficiency Eficiency
of scale Technology
Total factors productivity
Moderately inefficient states (10% to 20% inefficiency)
Distrito Federal 87.77% 17º 100.00% 87.77% 4.92% 0 1.006 1 1.006 0.936 0.942 SP PR Roraima 86.90% 18º 100.00% 86.90% 8.00% 0 1.011 1 1.011 0.931 0.942
Sergipe 85.28% 19º 98.97% 86.15% 8.67% 1 1.004 0.997 1.007 0.932 0.936 PR MA
Rio Grande do Norte 82.97% 20º 99.58% 83.27% 4.95% 1 1.022 1 1.022 0.835 0.854 PR MA
Very inefficient states (20% to 30% inefficiency)
Acre 79.08% 21º 99.06% 79.73% 7.54% 3 1.043 1.011 1.032 0.996 1.039 MA
Mato Grosso do Sul 78.54% 22º 91.38% 86.99% 5.92% 0 1.011 1.022 0.989 0.852 0.861 BA PR SP MG Amazonas 77.69% 23º 98.10% 79.36% 2.96% 2 0.997 1 0.997 0.973 0.970 PA PR
Espírito Santo 77.58% 24º 89.40% 87.47% 4.96% 1 0.986 1.008 0.978 0.923 0.910 PR MG SP Rondônia 77.22% 25º 94.76% 81.25% 9.00% 2 1.039 1.003 1.036 0.898 0.933
Tocantins 76.46% 26º 97.99% 77.92% 6.94% 0 1.032 1 1.032 0.948 0.979 MA
Mato Grosso 75.19% 27º 81.13% 93.15% 5.30% 2 1.039 1.032 1.006 0.976 1.014 PA PR MG
Extreme examples were Maranhão where it was observed a total productivity loss of almost 18% and Rio Grande do Norte, which lost 16.5% in terms of technology.
Taking into account the fourth main objective of the article, table 4 identiies the fully eicient states considered the benchmarks for the ineicient ones, and the peer states able to serve as a punctual example. In order to summarize this result for the decade, these results were obtained from a single stage DEA having as inputs and outputs the average values from 2004 to 2013.
Considering the ith main objective, what can be learned from the most eicient states in Brazil in the decade of 2004 to 2013? Is there something to learn from states classiied as very ineicient during that decade? What are the patterns?
A irst lesson learned is on the intense use of inputs as something quite punitive in the eicien-cy, as it could be observed in Distrito Federal, despite the good relative performance in terms of social welfare. In a similar trend of thought, with the exception of the state of Pará and Amazonas, the others in the North region may have their ineiciency associated with the high levels of real transfer per capita, to the point that Rondônia presented a level of about 10 times the one observed in Rio de Janeiro.
Focusing on the good examples, what has possibly led the state of Maranhão to a maximum level of eiciency, despite the well-known low social indicators in comparison to other states in the country, was the very low use of inputs, mainly in the item of taxes and other sources of revenue. he revenues of the other very eicient states of the Northeast, Bahia and Ceará, as well as Pará, can be synthesized by the average use of inputs and average generation of outputs (good or bad), i.e., a fairly balanced recipe.
Taking into account the igures presented in the research, the states of Paraná and Minas Gerais used minimally comparable revenues in order to provide better indicators of social and economic variables than most of the eicient states, but at the cost of a more intense use of revenues. Finally, the incomparable state of São Paulo made intense use of resources obtained through taxes and it was not one of the most favored with resources coming from federal government transfers. With this balance, the state generated excellent levels of good outputs and high levels of bad outputs, with the exception of unemployment.
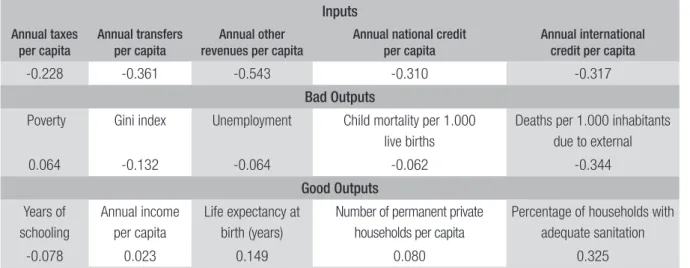
TABLE 5 CORRELATION BETWEEN EFFICIENCY AND INPUTS AND OUTPUTS (PERIOD: 2004-13)
Inputs
Annual taxes per capita
Annual transfers per capita
Annual other revenues per capita
Annual national credit per capita
Annual international credit per capita
-0.228 -0.361 -0.543 -0.310 -0.317
Bad Outputs
Poverty Gini index Unemployment Child mortality per 1.000 live births
Deaths per 1.000 inhabitants due to external
0.064 -0.132 -0.064 -0.062 -0.344
Good Outputs
Years of schooling
Annual income per capita
Life expectancy at birth (years)
Number of permanent private households per capita
Percentage of households with adequate sanitation
-0.078 0.023 0.149 0.080 0.325
Source: Elaborated by the author.
4.4 DISCUSSION ON THE ROLE OF EXTERNAL FUNDING SOURCES
A inal result, in view of the irst speciic objective, is the sustainability of eiciency levels given the levels of indebtedness. he Fiscal Responsibility Law (Complementary Law No. 101, of May 4, 2000) aims at establishing nationwide guidelines regarding public expenditure of each state. he law imposes budgetary restrictions that preserve the iscal situation of the states, according to their annual balance sheets, maintaining the inancial health of the states over time. his law establishes lower and higher limits to the most relevant budget items, as well as limiting states’ indebtedness.
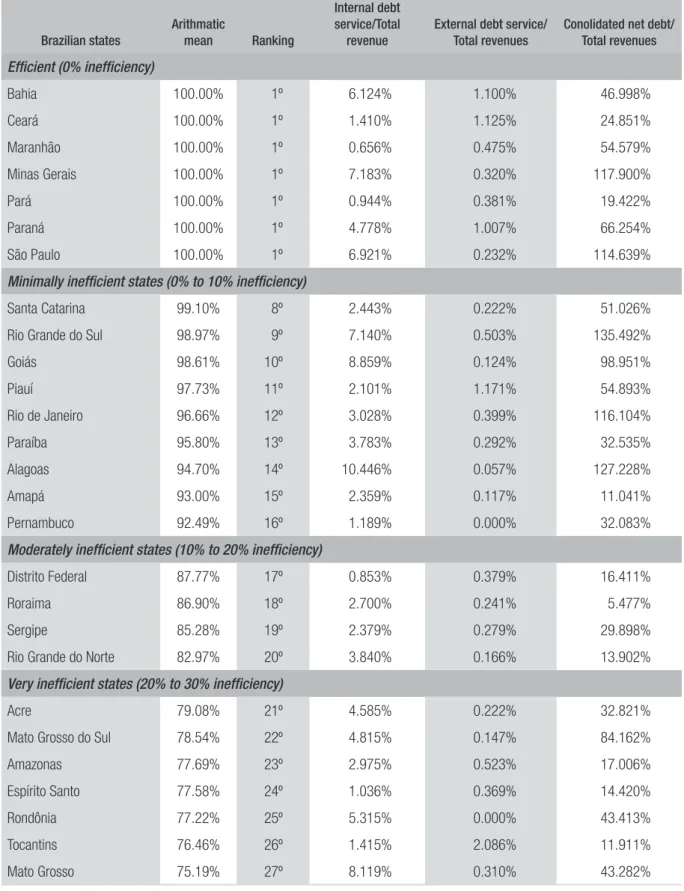
In this context, an analysis of the debt service reported in the annual balance sheets of the states (available from the Secretariat of National Treasury), as well as an analysis of the consolidated net debt (CND) in relation to the total revenue levels, may be useful in order to indicate whether the states were or were not promoting eiciency in the analyzed decade at the cost of excessive indebtedness, which would compromise the continuity of this desired eiciency.
Table 6 reports some relevant igures. Observing the correlation between average total technical eiciency in the decade and each of the items listed, it is possible to identify that the services of in-ternal and exin-ternal debt correlated positively, but with low values (0.094 and 0.054 respectively). his suggests that the debt services during the analyzed decade did not seem to compromise eiciency so much — evidence corroborated by the order of magnitude, lower than the level of 6% for most states, with concerning exceptions in the states of Alagoas, Goiás and Mato Grosso.
TABLE 6 RELATIONSHIP BETWEEN EFFICIENCY AND DEBT (PERIOD: 2004-13)
Brazilian states
Arithmatic
mean Ranking
Internal debt service/Total
revenue
External debt service/ Total revenues
Conolidated net debt/ Total revenues
Efficient (0% inefficiency)
Bahia 100.00% 1º 6.124% 1.100% 46.998%
Ceará 100.00% 1º 1.410% 1.125% 24.851%
Maranhão 100.00% 1º 0.656% 0.475% 54.579%
Minas Gerais 100.00% 1º 7.183% 0.320% 117.900%
Pará 100.00% 1º 0.944% 0.381% 19.422%
Paraná 100.00% 1º 4.778% 1.007% 66.254%
São Paulo 100.00% 1º 6.921% 0.232% 114.639%
Minimally inefficient states (0% to 10% inefficiency)
Santa Catarina 99.10% 8º 2.443% 0.222% 51.026%
Rio Grande do Sul 98.97% 9º 7.140% 0.503% 135.492%
Goiás 98.61% 10º 8.859% 0.124% 98.951%
Piauí 97.73% 11º 2.101% 1.171% 54.893%
Rio de Janeiro 96.66% 12º 3.028% 0.399% 116.104%
Paraíba 95.80% 13º 3.783% 0.292% 32.535%
Alagoas 94.70% 14º 10.446% 0.057% 127.228%
Amapá 93.00% 15º 2.359% 0.117% 11.041%
Pernambuco 92.49% 16º 1.189% 0.000% 32.083%
Moderately inefficient states (10% to 20% inefficiency)
Distrito Federal 87.77% 17º 0.853% 0.379% 16.411%
Roraima 86.90% 18º 2.700% 0.241% 5.477%
Sergipe 85.28% 19º 2.379% 0.279% 29.898%
Rio Grande do Norte 82.97% 20º 3.840% 0.166% 13.902%
Very inefficient states (20% to 30% inefficiency)
Acre 79.08% 21º 4.585% 0.222% 32.821%
Mato Grosso do Sul 78.54% 22º 4.815% 0.147% 84.162%
Amazonas 77.69% 23º 2.975% 0.523% 17.006%
Espírito Santo 77.58% 24º 1.036% 0.369% 14.420%
Rondônia 77.22% 25º 5.315% 0.000% 43.413%
Tocantins 76.46% 26º 1.415% 2.086% 11.911%
Mato Grosso 75.19% 27º 8.119% 0.310% 43.282%
his may be the case for São Paulo, Minas Gerais, Rio Grande do Sul, Rio de Janeiro, and Alagoas, whose ratios of average real consolidated net debt to average real total revenue in December 2013 exceeded the threshold of 100%. Even more concerning is the case of Mato Grosso do Sul, whose ratio is 84%, without the desirable counterpart of high eiciency, with the ineiciency of 21.46% being one of the highest in Brazil. Graph 6 reports the dispersion between the series in the cross section of eiciency and CND/Total revenue ratio.
GRAPH 6 CROSS SECTION DISPERSION OF BRAZILIAN STATES ON EFFICIENCY AND CND/TOTAL
REVENUE RATIO (PERIOD: 2004-13)
Technical Efficiency ( Panel DEA)
Consolidate net debt/Total revenue (R$ Dec. 2013) Dispersion: Brazilian states (2004 to 2013)
Source: Elaborated by the author.
Corroborating the evidence associated with the correlation of 0.460, a comfortable scenario was observed for the states that managed to use the resources obtained from indebtedness in order to promote eiciency, while others in the lower right quadrant associated high levels of indebtedness with low eiciency. It should be noted that this indebtedness measured by the CND/Total revenue ratio was not solely due to the credit operations contracted in the intersection analyzed here, from 2004 to 2013, and there were remnants of older operations.
4.5 DISCUSSION ON TAX COLLECTION, EFFICIENCY AND TAX REFORM
Regarding the second speciic objective of this article, there is an ongoing discussion started perhaps around 2003 about tax reform. Common with most of the various proposals to change Brazilian tax legislation is the uniication of the Tax on Circulation of Goods and Services (ICMS) for all states and the uniication of taxes such as the Contribution to the Financing of Social Security (Coins) and the Social Integration Program (PIS).
Other elements of this discussion around the reform are certainly secondary, since this revenue is an important part of the inancial budget of all states, being the highest tax collected nationwide. he key question is how to compensate for the states impaired by a change in the tax law, and the poorer states, which adopt policies of tax reduction as their main tool to promote local development. here are numerous compensatory ideas, such as the creation of a new tax on services, or the creation of a Regional Development Fund that would allow states to continue with budgetary and inancial resources to support investments.
he clear impression on the discussion around the measures ater tax reform is to compensate each of the impaired states, so that they return to a level close to previous revenue status, before the reform, as if the current situation was fair and eicient management was being employed.
he present article allows to point out a scenario of imbalances of eiciency and possible sources of mismanagement, as well as it shows states that serve as examples for others, an instrument that should be fundamental in trying to conciliate the interests of states. More precisely, tax reform cannot ignore the conclusions drawn from the analysis of linear input-orientated programming reported, and it is necessary to promote this debate by observing inputs in terms of sources of revenue.
As discussed previously in subsection 4.1 on the patterns of inputs of Brazilian states, it is clear that states in the South and Southeast regions had more than 60% of their total revenue from tax collection, while in the North (except for the state of Amazonas) tax revenues oscillated between 18% and 45%. In the North region the percentage was 31% on average, half of the average 62% obtained for the South and Southeast. he Northeast and Central-West regions showed average percentages of 41% and 57%, respectively.
However, the relationship between national credit and total revenue suggests an interesting scenario, where the states in the North stood out with the highest percentages, with national credit volume averaging 5% of total revenue, while in other regions this level did not exceeded 3% (except the state of Goiás, in the Central-West region). As for the relative volume associated with the states’ paradiplomatic activity, the majority presented igures between 0% and 2%. It is worth highlighting the states Ceará and Tocantins, whose volumes contracted with foreign institutions exceeded 4% of their total revenues.
With such a disparity in the revenue framework, the iscal challenge for the states is observed not only by the adoption of exaggerated practices in the competition among each other in order to attract private investments, disregarding the National Council of Finance Policy (Confaz). his challenge is also observed in the eforts of each state government to obtain debt relief (partial or total cancella-tion) from the federal government, as well as the eforts to at least maintain the level of tax collection through the state tax ICMS or compensation.
not have primary revenue to contribute to such a Regional Development Fund, the government may ofer debt issues as it has done with public banks. It is estimated an amount of approximately R$300 billion over 20 years — these measures simply ignore any meritocracy in the management of states. his may give signs that the mismanagement of public resources and consequent indebtedness, even at unsustainable levels as is the case of the ive states whose ratio of consolidated net debt/total reve-nue exceeded 100%, are not considered by the federal government in the future as an instrument of negotiation, punishment or incentive.
In sum, perhaps the most concerning issue regarding inequality is not income, credit, or human capital, all of which are already observed in Brazil and commonly mentioned by policy makers. he most concerning issue is the per capita tax revenue and the consequent heterogeneity of states manage-ment eiciency. Even more concerning, these serious heterogeneities of revenue and eiciency do not seem to worry the federal government at all. More complex still: the summary of these discrepancies translated into the social welfare provided to citizens in each state is probably not being analyzed and used for some purpose, since there are no reliable historical series with consolidated methodology on the satisfaction of the society with certain services provided by the state.
5. CONCLUSION
he main concern of this study is the measurement of the relative eiciencies of the Brazilian states, analyzing the evolution over the decade ater the Fiscal Responsibility Law came into action, and pro-posing comparisons over time and between states. However, in terms of the implementation of public policies, the aim is to promote the discussion in the context of tax reform and debt renegotiation. By showing a scenario of eiciency imbalance and possible sources of mismanagement and by identifying states that serve as examples for others, the evidence reported here can serve as a fundamental tool in attempting to conciliate the interests of states.
point is that despite the relevance that society and international institutions attribute to the ei-ciency in resource management and the consequent generation of social welfare by public institutions, the clear impression is that the discussion on measures ater the tax reform analyzed here is focused on compensating each impaired state. he states then return to a level close to the previous revenue
status, ex ante reform, as if the current situation was fair and eicient management was being employed.
It is suggested that the tax reform should not ignore the conclusions reported here and other evidence reported in the literature on the eiciency of the public institutions in Brazil. he political management has so far ignored any meritocracy regarding the states management, indicating that the poor administration of public resources and the consequent indebtedness, even at unsustainable levels, are not considered by the federal government in the future as an instrument of negotiation, punishment or incentive.
REFERÊNCIAS
AFONSO, António, SCHUKNECHT, Ludger; TAN-ZI, Vito. Public sector eiciency: an international comparison. Public Choice, v. 123, n. 3, p. 321-347, 2005.
BANKER, Rajiv, CHARNES, Abraham, COOPER, William. Some models for estimating technical and scale ineiciencies in data envelopment analysis.
Management Science, v. 30, n. 9, p. 1078-1092, 1984.
BENEGAS, Mauricio; DA SILVA, Francisco. Es-timação da eiciência técnica do SUS nos estados brasileiros na presença de insumos não discricio-nários. Revista Brasileira de Economia, v. 68, n. 2, p. 171-196, 2014.
CHARNES, Abraham; COOPER, William; RHO-DES, Edwardo. Measuring the eiciency of decision making units. European Journal of Operational
Re-search, v. 2, n. 6, p. 429-444, 1978.
CLEMENTS, Benedict. How eicient is education spending in Europe? European Review of Economics
and Finance, v. 1, n.1, p. 3-26, 2002.
COELLI, Tim. A guide to Deap version 2.1: a data envelopment analysis (computer) program. CEPA
Working Paper 96/08, 2008.
COSTA, Cassia; BALBINOTTO NETO, Giácomo; SAMPAIO, Luciano. Eiciência dos estados bra-sileiros e do Distrito Federal no sistema público de transplante renal: uma análise usando método DEA (análise envoltória de dados) e índice de Malmquist. Cadernos de Saúde Pública, v. 30, n.8, p. 1667-1679, 2014.
FARE, Rolf; GROSSKOPF, Shawna; LOVELL, Knox.
Production frontiers. Cambridge University Press,
1994.
FARIAS, Deborah. Federalismo e relações inter-nacionais. Dissertação (mestrado em relações internacionais) — Departamento de Relações Internacionais, Universidade de Brasília, Brasília, 2000.
GATTOUFI, Said; ORAL, Muhittin; REISMAN, Arnold. Data envelopment analysis literature: a bibliography update (1951-2001). Socio-Economic
Planning Sciences, v. 38, n. 2, p. 159-229, 2004.
GUPTA, Sanjeev; VERHOEVEN, Marijn. he ef-iciency of government expenditure: experiences
from Africa. Journal of Policy Modeling, v. 23, n. 4, p. 433-467, 2001.
JORGE, Maria; KOIZUMI, Maria; TONO, Vanessa. Causas externas: o que são, como afetam o setor saúde, sua medida e alguns subsídios para a sua prevenção. Revista Saúde, v. 1, n. 1, p. 37-47, 2007.
MACHADO JUNIOR, Sáris; IRFFI, Guilherme; BENEGAS, Mauricio. Análise da eiciência técnica dos gastos com educação, saúde e assistência social dos municípios cearenses. Planejamento e Políticas
Públicas, n. 36, p. 87-113, 2011.
MACIEL, Vladimir; PIZA, Caio; PENOFF, Roberto. Desigualdades regionais e bem-estar no brasil: quão eiciente tem sido a atividade tributária dos estados para a sociedade? Planejamento e Políticas Públicas, n. 33, p. 291-318, 2009.
MAIA, José. A paradiplomacia inanceira dos estados brasileiros: evolução, fatores determinantes, impac-tos e perspectivas. Tese (doutorado) — Programa de Doutorado em Relações Internacionais, Universida-de Universida-de Brasília, Brasília, 2012.
MAIA, José; SARAIVA, José. A paradiplomacia inanceira no Brasil da República Velha, 1890-1930.
Revista Brasileira de Política Internacional, v. 55,
n. 1, p. 106-134, 2012.
MATOS, Paulo; BESSA, Ricardo. Determinantes da captação de recursos junto a órgãos internacionais pelo estado do Ceará. Revista de Economia do Nor-deste, v. 45, n. 1, p. 6-18, 2014.
MATOS, Paulo; PADILHA, Guilherme; BENEGAS, Mauricio. On the management eiciency of Brazilian stock mutual funds. Operational Research, v. 1, n. 1, p. 1-35, 2015.
PAQUIN, Stéphane. La paradiplomatie identitaire: le Québec, la Catalogne et la Flandre en relations internationales. Politique et Sociétés, Quebec, v. 23, n. 2-3, p. 203-237, 2004.
PARK, Kang; WEBER, William. A note on eicien-cy and productivity growth in the Korean banking industry, 1992-2002. Journal of Banking & Finance, v. 30, n. 8, p. 2371-2386, 2006.
envoltória de dados (DEA). Revista Capital Cientíico
— Eletrônica, v. 12, n. 3, p. 1-15, 2014.
SOLDATOS, Panayotis. An explanatory framework for the study of federated states as foreign-policy actors. In: MICHELMANN, Hans J.; SOLDATOS, Panayotis (Ed.). Federalism and international
relations: the role of subnational Units. Oxford:
Clarendon Press, 1990. p. 34-53.
TANZI, Vito. Redistribution of income through the budget in Latin America. Banca Nazionale
del Lavoro Quarterly Review, v. 27, n. 108, p.
65-87, 1974.
TANZI, Vito; SCHUKNECHT, Ludger. Public
spending in the 20th century: a global perspective.
Cambridge: Cambridge University Press, 2000.
TANZI, Vito; SCHUKNECHT, Ludger. Reconside-ring the iscal role of government: the international perspective. he American Economic Review, v. 87, n. 2, p. 164-168, 1997.
Paulo Rogério Faustino Matos