The Competitive Structure and Strategic Positioning of
the Bank Industry in the Face of Major Environmental
Disturbances: A Study of Brazilian Banks
Gisele Walczak Galilea†
FGV/EAESP
William Eid JuniorΩ
FGV/EAESP
1. INTRODUCTION
The conduct and performance of irms and industries are topics that have aroused considerable scientiic interest for some time. A logical understanding with regard to the operating methods of the irms and industries was originally the prime objective of literature on Industrial Organization (IO).
The theory then based on the paradigm of “structure-conduct-performance” posited that for a particular sector there would be an ideal strategy to be followed and therefore, variances in the proitability of the companies would be the result of a scale economy (Mason, 1949 and Bain, 1959). However, Hunt’s observations in 1972 showed the presence of groups in the same sector with diferent strategies and thus a new line of investigation was born.
The treatment of the strategic groups provided a new characterization of the facts. This work is focused on this treatment. Questions such as the dynamics of the competitive structure and strategic positioning of the irms and industries are of great academic interest. However, the analysis on the conduct of strategic groups over time seems to be a suitable vehicle for a look into the history and evolution of a market.
Empirical studies by Cool (1985), Cool & Schendel (1987), Fiegenbaum (1987), Mascarenhas (1989) and Fiegenbaum & Thomas’s (1990), looked into the basic questions with regard to the composition of strategic groups, their evolution and the kinds of change to which they had been subjected from a dynamic perspective. These works gave rise to a series of similar studies during the 1990s.
This article has a Creative Commons License - Attribution 3.0 Not Adapted.
Corresponding author:
† FGV/EAESP
E-mail: [email protected]
Ω FGV/EAESP
E-mail: [email protected]
Received: 07/28/2015. Revised: 11/10/2015. Accepted: 03/21/2016. Published Online: 02/01/2017.
DOI: http://dx.doi.org/10.15728/bbr.2017.14.4.1
ABSTRACT
his work looks into the dynamics of the competitive structure and strategic positioning of Brazilian banks. Over the eighteen years covered by the study, we saw periods of strategic instability in this industry and difering structures of strategic groups, with regard to not only their number, but also their composition. Our study therefore provides empirical evidence that we will hardly ind periods of full strategic stability. hese indings denote that, at some moment, there is a change in the strategic positioning of these irms and provides insight with regard to the competitive patterns of an industry over the period.
BBR
14,4
369
However, some restrictions should be highlighted, as pointed out by Zúñiga et al (2004), with regard to these studies, that on the one hand, in their analysis, the majority covered a period characterized by stability in the environmental conditions, and on the other hand made use of stable samples of companies, these being comprised of the largest companies in the industry.
In line with the Zúñiga et al (2004) study, we examined, by means of statistical analysis, the dynamics of the competitive structure and strategic rank of a speciic industry, the Brazilian banking market. Over the period analyzed, the irms in this industry were subject to continual environmental disruptions and furthermore, this is an industry characterized by changes in its composition (bankruptcies, mergers, takeovers and privatizations).
Although our study is clearly in line with the research of Zúñiga et al (2004), the diferences relate to the variables that characterize current strategic activities. One of the gaps in the Zúñiga et al (2004) study is in the research into the strategic rank of Spanish banks by means of the variables that only characterize this strategic rank at business level (types of consumers and products), whereas our study ills in these gaps by expanding the research to the operational level (decisions with regard to the commitment of resources) by using data on the capital equity structure and the results of the banks. According to Amel & Rhoades (1988) the commitment of resources (raising of capital policies and investment of funds) and the business environment (type of consumer, products and risks) is relected in these structural decisions.
This work is organized in ive sections. The next section shows a review of the literature on research that contributes to the understanding of the ield of the study and other aspects connected to our study. In section 3, we detail the study variables and methodology used in the analysis of the data. In section 4, we show and discuss the results and evidence obtained. Finally, in section 5 we conclude our work.
2. THE LITERATURE OF THE STRATEGIC GROUPS
The treatment of the strategic groups arises from an attempt to ill in the existing gaps in the industrial organization theory with regard to the paradigm “structure-conduct-performance”. The term “strategic group” was originally coined by Hunt (1972), who identiied the strategic diferences between irms in American industry, which divided white goods into four groups on the basis of three strategy sizes (asymmetries existing in that industry).
These groups were called strategic groups and deined by the author as being irms in the same industry that are highly symmetrical with regard to their cost structure, degree of vertical integration, degree of product diferentiation, formal organization, control systems, management remuneration and sanctions, and lastly their personal views and preferences with regard to the various possible results.
The concept of strategic groups was developed from two points of view, the irst emanating from the industrial organization school (Hunt, 1972; Newman, 1973; Porter, 1973; Caves & Porter, 1977; Newman, 1978 and Oster, 1982), and the second from the school of strategic management (Hatten, 1974; Patton, 1976 and Cool, 1985).
From the perspectives of the industrial organization school, measures such as the size of the irm (Porter, 1973 and 1979), the number of agents in an industry (Porter 1976, Oster 1982) and the degree of vertical integration (Newman, 1973) were taken as proxies for the strategy and therefore related to the performance to thus explain the existing diferences.
BBR
14,4
370
linked to the strategy so as to identify the strategic groups in one particular industry (Hatten, 1974; Patton, 1976 and Cool, 1985).
By the mid 80’s, a new phase of research now focused on matters such as the exploration of mobility barriers (McGee & Thomas, 1986 and Mascarenhas & Aaker, 1989) and the stability of the strategic groups (Oster, 1982; Cool, 1985; Cool & Schendel, 1987; Cool & Schendel, 1988; Fiegenbaum, 1987; Mascarenhas, 1989 and Fiegenbaum & Thomas, 1990).
Although the dynamics of the strategic groups had been repeatedly documented in longitudinal studies of the conduct of groups, signiicant methodological diferences were observed in said empirical studies.
There are works in which the method of deining the time period during which the group structures do not undergo signiicant changes is subjective, these periods being determined a priori by means of knowledge of the sector being analyzed (Amel & Rhoades, 1988 and 1992; Ketchen, Thomas & Snow, 1993) in addition to studies in which technical statistics (among which are of Hotelling’s T2 test and the Box’s M test) are used to objectively deine the periods of strategic stability (Cool & Schendel, 1987 and 1988; Fiegenbaum & Thomas, 1990 and 1993; Fiegenbaum et al, 1990; Flavián &
It is worth highlighting that the Amel & Rhoades’ (1988) study, although it deines the periods of strategic stability subjectively, deserves attention because it brings in as an innovation, the use of inancial statement data as variables that characterize the strategic activity of the irm.
In line with the works that objectively deine the time period in which the group structures do not undergo any signiicant changes, researches can be seen that also turn their attention to the circumstances that afect the classiication of the irms (Mascarenhas, 1989; Bogner, 1991 and Zúñiga et al. 2004).
The study Mascarenhas (1989), a dynamic analysis of the strategic groups in the petroleum industry, had already provided data with regard to a connection between the mobility of strategic groups and environmental changes. For his part, Bogner (1991) studied the dynamics of strategic groups in the American pharmaceutical industry and tested various hypotheses as to why irms changed their strategic rank and under what circumstances this occurred. Within the set of questions explored by the author, some pondered the possibility of changes in the irms in the strategic groups during periods of instability.
Contrary to what was expected, the empirical results obtained by Bogner (1991) showed changes at various times and not only during times of upheaval. The work of Zúñiga et al (2004) backed up these results. One of the assumptions in this study is that at some point in time almost all industries show irms that move from one strategic group to another when the total number of companies in the industry is considered.
The authors recognize that the existence of periods of strategic stability shown in previous studies is linked to the sample now selected by researchers (the largest companies in an industry) and empirically show that, taking into account a population of companies that have over time been subject to environmental disturbances and largely made up of small units, there is no strategic stability since, at some time or another, these companies move from one strategic group to another, contradicting other studies among which is that of Cool & Schendel (1987).
BBR
14,4
371
3. DATA AND METHODOLOGY
The identiication and speciication of the variables that best relect the strategic rank of a irm depend on the selected industry (Cool & Schendel, 1987). For the selected population in this study, the strategic activity was linked to decisions within the irm environment (type of consumers, products and risks) and decisions with regard to the commitment of resources (resources and investment of funds policies), since the selection of the variables that characterize this strategic activity are based on a review of the literature on the strategic groups in the Brazilian banking industry.
With the purpose of examining the relation between the upheaval in the environmental conditions and the changes that took place over the period in the competitive structure of the Brazilian banks, we used variables similar to those of the Gonzalez; Savoia & Gouvêa (2008) study, which are described in Table 1. These variables were selected from the balance of these inancial organizations. The balance composition of these inancial irms may be a very good indication of the diferent inancial products and services that each banking irm competes with in their diferent market segments and their use made it possible to eliminate potential arbitrariness in the choice of the variables that characterize strategic activity (Amel & Rhoades, 1988).
Table 1. Work study variables VARIÁVEL DESCRIPTION
DI.A Interbank investments and Cash Equivalents / Total Assets.
TVM.A Securities (TVM) and Derivative Financial Instruments / Total Assets. CRED.A Total Credit and Commercial Lease Transactions / Total Assets. DEP.P Total Deposits / Total Liabilities.
EMPR.P Loan and Transfer Liabilities and Funds from the Acceptance and Issuance of Securities / Total Liabilities.
DI.R Income from Interbank Investments and Cash Equivalents / Total Income. TVM.R Income from Securities and Derivative Financial Instruments / Total Income. SERV.R Income from the Provision of Services / Total Income.
CRED.R Income from Credit and Commercial Lease Transactions / Total Income.
This study uses 18 years of data from 533 diferent banks the period from 1994 to 2011. These banks represented the complete population of Brazilian banking institutions during this period (non-banking institutions and credit cooperatives are not considered). The basic information used for the strategic variables was taken from the yearly reports published by the Brazilian Central Bank. These reports provided detailed balance data, we use all the annual reports from December 1994 to December 2011.
From the study variables thus shown, we made a speciic description of the methods for deining the strategic stability periods and strategic groups. Our study, like other works (Fiegenbaum & Thomas, 1990 and 1993; Fiegenbaum et al, 1990; Flavián & Polo, 1998; Más, 1999; Zúñiga et al, 2004), followed a similar methodology as that of Fiegenbaum et al (1987). The periods of strategic stability are deined as those which meet the dual condition that the variance-covariance matrix, as well as the average vector of the strategic variables remains relatively stable.
BBR
14,4
372
the Hotelling’s T2 test is therefore used to test the second criteria, i.e., the equality of the average strategic variable vectors.
Box’s M test is deined as follows: H0: ∑1 = ∑2
H1: ∑1 ≠ ∑2,
where ∑ represents the variance-covariance matrix associated with strategic variables in a certain period.
In case the null hypothesis is not rejected, these two periods are regarded jointly and create a new covariance matrix ∑12. Then a third period is included and the null and alternative hypotheses are reformulated as follows:
H0: ∑12 = ∑3 H0: ∑1 = ∑23
H1: all ∑ are not equal,
where ∑12 and ∑23 are the variance-covariance matrices of strategic variables jointly considered in the two irst periods and the two last periods.
In case both null hypotheses are accepted, the three periods are regarded as one period of strategic stability and they are grouped together. The next steps in the evaluation of periods of strategic stability will follow the same logic.
Hotelling’s T2 test is important for the situation in which the mean values of strategic variables may change, as it indicates a new strategic positioning without altering the values in the variance-covariance matrix of strategic variables. The logic of this test is similar to the one described in Box’s M test.
The strategic instability means that Brazilian banks have changed their strategic position annually in terms of the decisions within the irm environment (type of consumers, products and risks) and decisions with regard to the commitment of resources (resources and investment of funds policies), i.e. in terms of the nine strategic decision variables of Table 1.
For the building of the strategic groups, or clusters, one of the most frequently used methods is the hierarchical model-based clustering method developed by Banield & Raftery (1993). This method enables the investigation of the heterogeneity of a population by means of a inite mixture model in which each grouping is described by a diferent probability density function so that:
x is a inite mixture of g components (each mixture component is a distinct cluster) with a probability density function deined in accordance with the formula (1);
πk are the proportions or weights of the mixture, i.e., consist of the is the probability that an observation comes from the kth mixture component;
f1 (.), … , fg (.) are called mixture density components and represent any distribution.
However, considering fk (x) = fk (x) | θk ) for k = 1, 2, …, g, i.e., the density components of the mixture belonging to a parametric family, θk being a vector of unknown parameters of the kth density component of the mixture, the formula (1) can be re-written as follows:
BBR
14,4
373
The vector containing all unknown parameters, θk, is estimated by applying the maximum likelihood method using the EM (Expectation-Maximization) algorithm. The likelihood function is built starting from formula (2), thus:
the vector xi = xi1, xi2, …, xin for i = 1, 2, …, n.
In this study, for building the strategic groups or clusters, we followed Zúñiga et al (2004), who used the Model-based Clustering (Mclust) computer model. By means of this model, it is possible to make an analysis of the clusters using the hierarchical model-based clustering method posited by Banield & Raftery (1993).
The Mclust therefore, makes it possible to obtain the best possible solution that does not refer to the number of clusters, thus the choice of this number does not depend on the subjective judgment of the researcher as seen in cases where traditional hierarchic and non-hierarchic models are used. In Mclust, each cluster is described by a probability density function Φk of a normal multivariate distribution parameterized by the average vectors μk and the covariance matrix Σk:
the vector xi = xi1, xi2, …, xin for i = 1, 2, …, n.
k is the full number that identiies a particular cluster, (xi - μk)T is a transposed matrix,
Σk.-1 is an inverse matrix.
The parameters πk,μk and Σk are estimated by means of the likelihood function shown in formula (5) by applying the maximum likelihood method using the EM ( Expectation-Maximization) algorithm.
It should be emphasized that the characteristics of a cluster expressed by means of the Σk covariance matrix can vary and therefore it is possible to build several models for diferent parameterizations of this matrix. Another aspect has to do with the number of components that make up the population. Insofar as this number is unknown it is necessary to use a selection technique of the models to estimate the number of components. Thus, in order to choose the best model and determine the number of components (groups) of the mixture,
the Bayesian Information Criterion (BIC) is used. This criterion, shown in formula (6), consists of a close estimate of the integral likelihood. In the end, the greater the value of the BIC statistic, the stronger is the evidence in favor of the corresponding model.
Λ is the maximum log-likelihood on model M, k is its complexity, i.e., the number of parameters, n is the size of the sample.
BBR
14,4
374
As the changes are already arranged in the groups (the number of members of the groups), they are studied in each period by means of a mobility rate, this being the calculation of the probability that a irm moves around in strategic groups in consecutive periods in accordance with the procedure developed by Sudharshan et al (1991). Finally, the changes in the number of strategic groups in the Brazilian banking industry are gathered, observing increases and decreases in groups for each period.
4. RESULTS
Empirical studies on the dynamics of strategic groups state that, when there is a sudden change in environmental conditions, it is possible to observe a period of strategic instability in an industry. However, there are some diferences among these studies regarding the efect of such environmental disturbance on the competitive structure and strategic positioning of irms. In order to empirically show that, taking into account a population which is subject to continuous changes in environmental conditions, there are signiicant alterations in the competitive strategy of strategic groups (changes in groups’ competitive standards) and instability in such groups (variation in the number of groups), it is necessary to identify which are the periods of strategic stability (i.e. periods of homogeneity and similarity in the competitive behavior of irms) and the strategic groups in each period.
In order to deine the time period when the structure of the strategic groups was not subject to signiicant changes, we carried out the Box’s M test and the Hotelling’s T2 test. However, Cool & Schendel (1987) state that the determination of the strategic transition points may be afected by the composition of the sample being used, a supplementary analysis being required to verify the sensitivity of the results to the composition of the sample.
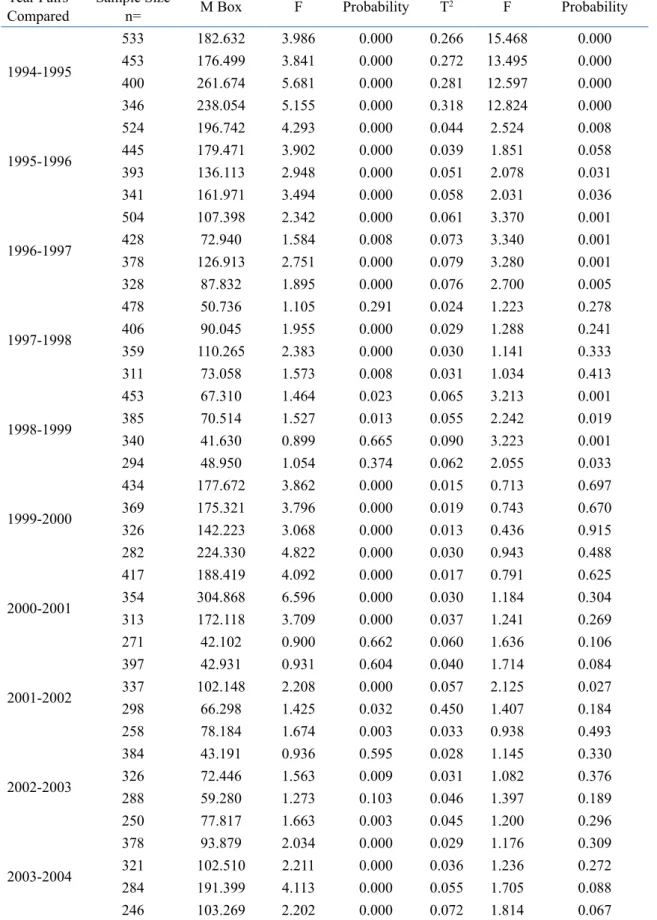
The approach suggested by the authors consists in determining the strategic transition points on a “q” sample of companies where “q<n” and repeat this analysis several times, adding companies until the total “n” of the sample is obtained. We followed this approach and repeated the aforementioned tests for randomly selected bank samples, the results obtained being shown in Table 2.
The existence of strategic instability can be inferred from the violation, for any of the randomly selected samples of banks, of one of the following conditions: (i) the variance-covariance matrix remains relatively stable; (ii) the vector of the mean of strategic variables remains relatively stable.
We observe that in almost all studied years, for at least one of the randomly selected samples of banks, the null hypothesis about the equality between the covariance matrices (Box’s M test) or the vectors of the mean of strategic variables (Hotelling’s T2 test) is rejected. Except for the years 1994 and 1995, there is high strategic instability. A possible explanation for such high level of strategic instability are the continuous environmental changes to which the irms of this industry have been subject.
A series of events – the main ones are chronologically presented in Table 3 – had an efect on the Brazilian banking industry throughout history. Such environmental disturbances may be considered as explanations for disruptions to strategic stability, i.e. they have resulted in the need for Brazilian banks to reformulate their strategies in order to adapt to the new conditions imposed by the environment.
The results shown here are in line with the work of Zúñiga et al (2004). Taking into account that each year is associated to a transition point of competitive standards of banks, we will test our explanation for the high level of strategic instability through the identiication of strategic groups in each analyzed year.
BBR
14,4
375
Table 2. Tests of the equality of the variance-covariance matrix and the average vector of the variables
Year Pairs
Compared Sample Size n= M Box F Probability T2 F Probability
1994-1995
533 182.632 3.986 0.000 0.266 15.468 0.000
453 176.499 3.841 0.000 0.272 13.495 0.000
400 261.674 5.681 0.000 0.281 12.597 0.000
346 238.054 5.155 0.000 0.318 12.824 0.000
1995-1996
524 196.742 4.293 0.000 0.044 2.524 0.008
445 179.471 3.902 0.000 0.039 1.851 0.058
393 136.113 2.948 0.000 0.051 2.078 0.031
341 161.971 3.494 0.000 0.058 2.031 0.036
1996-1997
504 107.398 2.342 0.000 0.061 3.370 0.001
428 72.940 1.584 0.008 0.073 3.340 0.001
378 126.913 2.751 0.000 0.079 3.280 0.001
328 87.832 1.895 0.000 0.076 2.700 0.005
1997-1998
478 50.736 1.105 0.291 0.024 1.223 0.278
406 90.045 1.955 0.000 0.029 1.288 0.241
359 110.265 2.383 0.000 0.030 1.141 0.333
311 73.058 1.573 0.008 0.031 1.034 0.413
1998-1999
453 67.310 1.464 0.023 0.065 3.213 0.001
385 70.514 1.527 0.013 0.055 2.242 0.019
340 41.630 0.899 0.665 0.090 3.223 0.001
294 48.950 1.054 0.374 0.062 2.055 0.033
1999-2000
434 177.672 3.862 0.000 0.015 0.713 0.697
369 175.321 3.796 0.000 0.019 0.743 0.670
326 142.223 3.068 0.000 0.013 0.436 0.915
282 224.330 4.822 0.000 0.030 0.943 0.488
2000-2001
417 188.419 4.092 0.000 0.017 0.791 0.625
354 304.868 6.596 0.000 0.030 1.184 0.304
313 172.118 3.709 0.000 0.037 1.241 0.269
271 42.102 0.900 0.662 0.060 1.636 0.106
2001-2002
397 42.931 0.931 0.604 0.040 1.714 0.084
337 102.148 2.208 0.000 0.057 2.125 0.027
298 66.298 1.425 0.032 0.450 1.407 0.184
258 78.184 1.674 0.003 0.033 0.938 0.493
2002-2003
384 43.191 0.936 0.595 0.028 1.145 0.330
326 72.446 1.563 0.009 0.031 1.082 0.376
288 59.280 1.273 0.103 0.046 1.397 0.189
250 77.817 1.663 0.003 0.045 1.200 0.296
2003-2004
378 93.879 2.034 0.000 0.029 1.176 0.309
321 102.510 2.211 0.000 0.036 1.236 0.272
284 191.399 4.113 0.000 0.055 1.705 0.088
BBR
14,4
376
2004-2005
372 55.285 1.197 0.171 0.009 0.369 0.949
316 71.810 1.549 0.011 0.014 0.486 0.883
279 80.696 1.728 0.002 0.030 0.834 0.585
242 76.471 1.629 0.005 0.017 0.417 0.925
2005-2006
363 15.073 0.326 1.000 0.018 0.720 0.690
309 24.226 0.522 0.997 0.038 1.253 0.262
272 74.965 1.601 0.006 0.062 1.606 0.114
236 52.771 1.124 0.262 0.074 1.820 0.066
2006-2007
356 32.368 0.700 0.936 0.026 1.007 0.434
303 43.887 0.945 0.578 0.029 0.951 0.481
267 66.131 1.416 0.034 0.052 1.462 0.162
231 91.062 1.937 0.000 0.066 1.562 0.128
2007-2008
356 38.503 0.833 0.780 0.030 1.142 0.332
303 48.520 1.044 0.392 0.040 1.263 0.257
267 51.151 1.097 0.303 0.037 1.090 0.370
231 81.343 1.730 0.002 0.039 0.923 0.506
2008-2009
357 41.514 0.898 0.667 0.071 2.720 0.004
303 45.854 0.988 0.495 0.081 2.728 0.005
268 73.321 1.569 0.009 0.081 2.252 0.019
232 61.349 1.305 0.082 0.089 2.135 0.028
2009-2010
356 43.850 0.948 0.571 0.041 1.564 0.125
303 56.260 1.208 0.159 0.061 1.864 0.057
267 62.827 1.344 0.062 0.053 1.423 0.179
231 97.610 2.081 0.000 0.092 2.292 0.018
2010-2011
357 28.610 0.619 0.979 0.016 0.621 0.779
303 74.133 1.595 0.007 0.029 0.919 0.509
268 85.274 1.825 0.001 0.050 1.384 0.196
232 67.151 1.424 0.032 0.045 1.003 0.439
Source: Brazilian Central Bank – BACEN (data used by the authors)
Note: Adjustments used – tests carried out for several random samples of banks obtained by means of a syntax that selected a single random sample that represented a percentage of cases available on the IBM® SPSS®.
conditions imposed on them, and as a result there were bankruptcies, mergers, takeovers and privatizations. From these indings, it is expected that diferent structures of the strategic groups in terms of the number of groups and their composition will take place over the time window deined for this study.
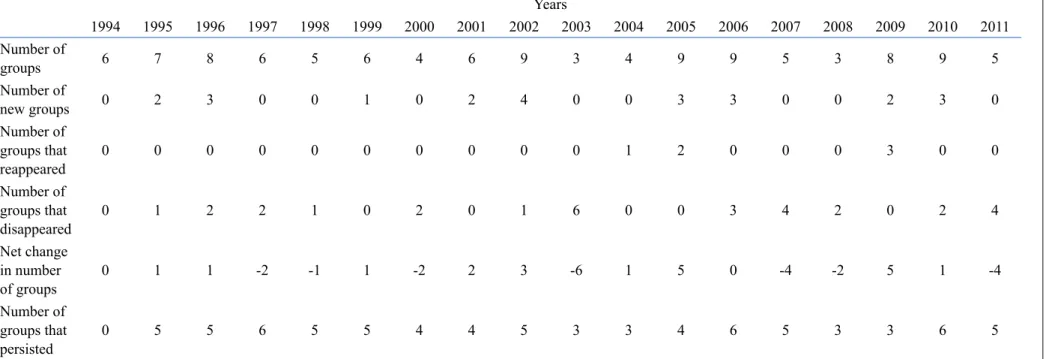
We have identiied the strategic groups in each analyzed year through the Model-Based Clustering or MCLUST MCLUST (Banield and Rafteri, 1993).This cluster technique enables researchers to get the best possible solution (number of clusters) through iterative EM (expectation-maximization) methods for maximum likelihood clustering with parameterised Gaussian mixture models. The procedure used to determine the optimal number of clusters was the Bayesian Information Criterion (BIC). Table 4 summarizes the number of strategic groups identiied in each of the years considered in the study, the number of new strategic groups, those which disappeared, reappeared and persisted as well as the net change taking place with time.
BBR
14,4
377
Table 3. Possible environmental cause of break in the stable time periods
Date Environmental Disturbances
1994
Implementation of Plano Real (Real Plan) and process of price stabilization: revenues deriving from inlation fell and banks started to earn income by increasing credit and charging fees for banking services. Brazil’s adoption of Basel Accords and demand for a minimum capital to be kept by banks in relation to the risk of their active operations.
1995
Restrictive monetary and credit policy and increase in the insolvency level: rise in the reserve requirement ratio, introduction of other means of control over credit creation and increase in the basic interest rates in order to reduce liquidity in the system. The crisis of two big banks – Econômico and Nacional – became the trigger for a systemic crisis which resulted in a process of inancial deregulation, openness to foreign capital linked to the acquisition of banks in trouble and the institution of Proer with the aim of ensuring liquidity and solvency in the system.
1996 Privatization of state banks: by means of Proes, the state government inanced the restructuring of state banks. Out of the 35 institutions that existed back then, 10 became extinct, 6 were privatized, 7 became federal banks for posterior privatization and 5 were restructured.
1997 to 1999
External crises due to contagion of Russian and Asiatic crises: banks adjusted their equity structure by increasing the participation in the asset composition of investments in currency-linked government bonds and overnight rate. This change provided a currency hedge against the currency devaluation in 1999
2000 The dot-com bubble: a speculative bubble during which there was a rapid rise in equity markets fueled by investments in internet-based companies.
2001
Adaptation of public banks: due to the establishment of Proef, public national inancial institutions became capitalized as well as subject to the same discipline (regulation) to which private banks must comply, thus they would become more ‘transparent’;
The world trade center terrorist attack: The efects arising from this attack were initial shock causing global stock markets to drop sharply.
2002 and 2003
Turbulence in the Latin American inancial market and global risk aversion: downturn in the expansion of foreign banks in Brazil. Some foreign banks (such as Sudameris do Brasil and BBV Banco) that could not create suicient scale to compete in the retail sector sold their assets in the country.
2004 and 2005
Perspective of stabilization of internal prices and exchange rates: there was a new expansive cycle in credit focused especially on inancing for households. Big retail banks invested in the acquisition/creation of investment, inancing and credit societies and entered into partnerships with retail chains. Small-sized and medium-sized conglomerates started to sign agreements with municipal, state and federal public entities and with privately held companies with the purpose of providing payroll-linked loans.
2008 and 2009
Subprime crisis: the external crisis constricted Brazilian banks and irms’ access to external lines of credit and also afected the capital and foreign exchange markets in the country. The government and the Central Bank tried to minimize the impact of such crisis in the Brazilian inancial sector by means of a series of measures among which were the reduction of the reserve requirement. However, banks lost value due to the conidence crisis that troubled worldwide inancial markets.
2011 Crisis in the Eurozone: Brazilian subsidiaries of European banks started to present the need for capitalization given the exclusion of the international market for fundraising.
instance 2002 and 2003, when there have been economic disturbances in South American countries, including Brazil. These indings may be considered an indication that banks change their competitive strategies in response to changes in environmental conditions.
BBR
14,4
378
banks and the time window of the study) in line with the Zúñiga et all (2004) study in which 24 (twenty-four) strategic groups were identiied in the Spanish banking industry.
We emphasize that only 4 (four) of these strategic groups last over practically the whole time window of the study, thus around 23 (twenty-three) of these may be considered as transitory groups and we will detail this deinition further on in this section.
In order to identify the strategies that distinguish one group from another, following the procedure used by Amel & Rhoades (1988), we compared the average values of the strategic variables of each group with the industry average.
From the total groups thus identiied, around 6 (six) of these described in Table 5, can be considered as basic models of strategic conduct of Brazilian banks (four remain over the time window of the study and two disappear in one particular year and reappear the following year). The other groups appear and disappear over the years and therefore can be seen as transitory competitive patterns (or transitory strategic groups).
With regard to the banks taken as basic models of strategic conduct, the retail banks, credit and treasury banks provide full banking services, whereas the interbank operating, business and transfer banks would be the intermediaries of banking intermediation, i.e., are intermediaries within the system, who aim to guarantee the liquidity of the others.
The banks taken as transitory, the justiication for said conduct is based on the Gonzalez; Savoia & Gouvêa (2008) study, where the authors emphasize that interbank operating are not a long-term proitable activity, since the donor bank incurs a high cost of maintaining a banking structure without the beneit of the ample margins of banking spreads.
Notice therefore, that some of the transitory groups (those who appear and disappear over the study time window) are comprised of these interbank operating banks that have recently increased their credit portfolio, but do not yet express credit income by virtue of the incipient maturity of the loans then granted.
A part of these transitory groups is also comprised of banks that have shown a meaningful credit portfolio in previous periods, i.e., were credit banks. However, they are at a review phase of their activity strategy, reducing their risk exposure in credit transactions, or by treasury and business banks in the process of increasing their credit portfolio.
In years of great environmental upheaval, an increase in these strategic groups followed by these decreases can be clearly seen. The years 2002 and 2003 were marked by economic upheavals in South American countries (Argentina and Brazil among them).
On the international scenario, the Nasdaq Crisis drove investors to an aversion to risk, thus the surge of the Argentine Crisis that culminated in devaluation and collapse of the State, had a negative efect on Brazil. Adding to the confused international context, the presidential election, in which the left-wing candidate, Luis Ignácio Lula da Silva, was leading the polls, triggered a negative reaction in the inancial market due to the fear that the future government might change the economic policy.
In the beginning of 2002, government bonds issued by the National Treasury and the Central Bank lost value and the reputation of Brazilian government debt was called into question in the face of the growth in the aversion to risk, and credit was rationed. This year, we saw an increase in the number of transitory groups that indicated a strategic repositioning of Brazilian banks. Thus in 2003, only three strategic groups are observed (interbank operating, treasury and retail banks), the strategic rank of these banks being in line with the context of credit rationing. There was also a retraction in the expansion of foreign banks in Brazil marked by the shutting down of activities in the country by some of those banks.
BBR
14,4
379
Table 4.The evolution of the number of strategic groups over time
Source: Brazilian Central Bank – BACEN (data used by the authors)
Years
1994 1995 1996 1997 1998 1999 2000 2001 2002 2003 2004 2005 2006 2007 2008 2009 2010 2011
Number of
groups 6 7 8 6 5 6 4 6 9 3 4 9 9 5 3 8 9 5
Number of
new groups 0 2 3 0 0 1 0 2 4 0 0 3 3 0 0 2 3 0
Number of groups that reappeared
0 0 0 0 0 0 0 0 0 0 1 2 0 0 0 3 0 0
Number of groups that
disappeared 0 1 2 2 1 0 2 0 1 6 0 0 3 4 2 0 2 4
Net change in number
of groups 0 1 1 -2 -1 1 -2 2 3 -6 1 5 0 -4 -2 5 1 -4
Number of groups that
BBR
14,4
380
Table 5.The most stable strategic groups and the frequency of disappearances
Period Strategic Group Main Strategic Characteristics Stable strategic groups with a lesser frequency of disappearance
1994 – 2011 Retail Banks Although they do not show any kind of evident specialization that afects their investments, in general, they are banks with a hybrid activity proile, both with regard to credit and treasury transactions. Their raising of capital is mainly by means of deposits presented, and therefore has a high leverage.
1994 – 2011 Interbank Operating Banks
With regard to their investments, they are specialized in interbank transactions, and their main revenues subdivided in interbank transactions and the provision of services. The main source of funds of these banks is their Own Capital, and they therefore are banks with a low leverage.
1994 – 2007 and
2009 – 2011 Treasury Banks These banks have signiicant investments and revenues in securities and inancial derivatives instruments. Therefore, like interbank transaction banks, their raising of capital is predominantly in Own Capital, and thus are also banks with a low leverage.
1994 – 2002 and
2004 – 2011 Credit Banks These are banks specialized in credit transactions, and therefore have signiicant investments and revenues in credits. They are high leverage banks when compared to other banks, and their raising of capital in mainly derived from deposits.
Stable strategic groups with a greater frequency of disappearance 1994 – 1999,
2001 – 2002, 2005 – 2007 and 2009 – 2011
Transfer Banks Like credit banks, these banks are specialized in credit transactions, although they are diferent from credit banks with regard to the origin of resources, once they do not derive their raising of capital from signiicant deposits, and their principal source of funds is in their obligation accounts due to loans and transfers (an account mainly made up by loans from the BNDES (Brazilian Development Bank) system. These are funds distributing banks that have neither the size nor the funds to maintain a branch structure.
2005 – 2006 and
2009 – 2010 Business Banks These are low leverage banks with high service revenues, and therefore show no preponderance in their asset accounts. These banks can adopt a strategy of interbank investment (DI) and in treasury, as an alternative to seasonal conditions or low demand for their services for the placement and issuance of private securities.
Source: Brazilian Central Bank – BACEN (data used by the authors)
are relected in the strategic rank of the banks in 2008, the year in which we observed three strategic groups (interbank operating, credit and retail banks), two of which are mainly orientated to the extending of credit.
In the light of the results shown so far, we may infer that the evolution of the Brazilian banking industry has been marked by periods of strategic instability. They have redirected their strategy to deal with the new environmental contexts. Some of the strategic groups seen are comprised of transitory groups made up of banks that are repositioning their competitive strategy toward a competitive pattern, i.e., they are making incremental changes in their strategy, reconiguring their asset base in order to compete under the new market conditions.
BBR
14,4
381
On comparing the strategic groups over consecutive periods, in cases where the same banks belonged to identical groups in both periods, we can state that there is no mobility, since there are no changes in the make up or structure of the groups in said periods. Mobility arises at the time that any bank difers from the group when there are signiicant diferences in the composition of the groups.
Our results show a mobility rate that oscillates between 0.455 and 0.745, indicating a relatively high level of mobility between the strategic groups. On average, according to Table 6, about 61.1% of the banks changed their strategic rank over the time window of this study.
Table 6. Mobility rate among strategic groups
Source: Brazilian Central Bank – BACEN (data used by the authors) Note: Mobility Rate = 0: there is no mobility, perfect strategic stability. Mobility Rate = 1: Full mobility, perfect strategic instability.
Years
94-95 95-96 96-97 97-98 98-99 99-00 00-01 01-02 02-03 03-04 04-05 05-06 06-07 07-08 08-09 09-10 10-11 Mobility
Rate 0.523 0.538 0.683 0.460 0.642 0.695 0.736 0.647 0.745 0.466 0.694 0.625 0.556 0.455 0.669 0.584 0.664
This level of mobility evidences greater instability in the strategic patterns of an industry represented by a population of companies, also made up of small irms as is the case of the Brazilian banking market.
Moreover, our indings that there is a reduction in the number of strategic groups in years when there are changes in environmental conditions may be related to the fact that groups whose strategic standard is viable (apparently those whose strategy would make them successful) tend towards growing as they attract other banks in their direction; it is also corroborated by the literature on bank concentration. This literature suggests that crises are less likely to happen in economies in which there is bank concentration. It also suggests that this concentration provides irms with more proits than normal. Therefore, market concentration increases market power and also bank proits, as it enables them to raise the interest rate (Becker et al 2006).
5. CONCLUSIONS
From the restrictions shown by Zúñiga et al (2004) with regard to the empirical studies that looked into (from a dynamic perspective) the basic questions about the make up of strategic groups, their evolution and types of changes to which they have sufered, our study looked into questions such as the dynamics of the competitive structure and the competitive ranking of the irms and the Brazilian banking industry. For this analysis, we considered a period characterized by instability in the environmental conditions, as well as an unstable sample of banks (they “are born” and disappear over the period of the study time window), these being comprised not only of the largest banks in the industry, but also of small banks.
Initially we recognized by means of statistical techniques (among them the Box’s M and Hotelling’s T2 tests), the existence of periods of great strategic instability in the Brazilian banking industry. One of the reasons now attributed for said existence would be strictly related to continuous environmental upheavals that took place in the sector over the period.
BBR
14,4
382
upheavals. From these irst indings, we began to look into the occurrence of diferent strategic group structures in terms of the number of groups and their composition by means of the identiication of these groups over the time window deined for this study.
Over the 18 years covered by this study, various strategic group structures, in terms of group numbers, have been observed. Several empirical studies (Cool, 1985; Cool & Schendel, 1987; Fiegenbaum, 1987; Mascarenhas, 1989; Fiegenbaum & Thomas, 1990) provide strong evidence with regard to the existence of periods of strategic stability, in addition to a certain stability not only in the number of strategic groups identiied, as well as the pattern of competitive conduct of each group and low mobility among the strategic groups in the long run. This study, for its part, conirms the work of Zúñiga et al (2004), providing empirical evidence that from a sample of large and small irms that have been subject to the instability of environmental conditions over time, it was hard to ind a period of complete strategic stability.
This inding means that at some time, there is a change in the strategic rank of these irms that enables an understanding of the evolution of the competitive patterns of an industry over time.
Individually, the banks also change their competitive rank. The average mobility rate of the Brazilian industry was high (on average around 61.1% of the banks changed their strategic rank) in relation to other empirical studies and very close to the results of Zúñiga et al (2004) on the Spanish banking industry.
We highlight that this result must be considered with caution, since the probability of changes in the individual strategic rank of banks measured by means of the mobility rate of the Brazilian banking industry was very diferent for each year considered. A possible justiication for this could be related to the fact that the people who manage each bank react diferently to each environmental change. It would be worthwhile to look into the existence of mimicry whenever a new strategy emerges. In this context, the good performance of some members of a particular dominant group would also be observed in the others, in the long run.
6. REFERENCES
AMEL, D. ; RHOADES, S. A. Strategic groups in banking. The Review of Economics and Statistics, v. 70, p. 685-689, 1988.
AMEL, D. ; RHOADES, S. A. The performance efects of strategic groups in banking. The Antitrust Bulletin, v. 37, p. 171-186, 1992.
BANCO CENTRAL DO BRASIL. Informações Contábeis: Balancetes, available at www.bcb.gov.br. BECK, T.; DE JONGHE, O.; SCHEPENS, G. (2013). Bank competition and stability: cross-country
heterogeneity. Journal of inancial Intermediation,22(2), 218-244.
BECK, T.; DEMIRGÜÇ-KUNT, A.; LEVINE, R. (2006). Bank concentration, competition, and crises: First results. Journal of Banking & Finance, 30(5), 1581-1603.
BOGNER, W. C. Patterns of intra-industry competition: A dynamic analysis of theoretical foundations of strategic groups.Doctoral Thesis, University of Illinois at Urban-Champaign, 1991.
CAVES, R. E.; PORTER, M. From entry barriers to mobility barriers: conjectural decisions and contrived deterrence to new competition. Quarterly Journal of Economics, v. 91, p. 241-26, 1977.
COOL, K. Strategic group formation and strategic group shifts: a longitudinal analysis of the U.S. Pharmaceutical.Doctoral Thesis, Purdue University, 1985.
COOL, K.; SCHENDEL, D. Strategic group formation and performance: the case of the U.S. pharmaceutical industry, 1963-82. Management Science, v. 33, p. 1102-1124, 1987.
COOL, K.; SCHENDEL, D. Performance Diferences Among Strategic Group Members. Strategic Management Journal, v. 9, p. 207-223, 1988.
BBR
14,4
383
FIEGENBAUM, A.; THOMAS, H. Strategic Groups and Performance: The U.S. Insurance Industry, 1970-84. Strategic Management Journal, v. 11, p. 197-215, 1990.
FIEGENBAUM, A.; THOMAS, H. Industry and Strategic Group Dynamics: Competitive Strategy in the Insurance Industry, 1970–84. Journal of Management Studies, v. 30, p. 69-105, 1993.
FIEGENBAUM, A.; THOMAS, H. Strategic groups as reference groups: theory, modeling and empirical examination of industry and competitive strategy. Strategic Management Journal, v. 16, p. 461-476, 1995. FIEGENBAUM, A.; SUDHARSHAN, D.; THOMAS, H. The concept of stable strategic time periods in
strategic groups research. Managerial and Decision Economics, v. 8, p. 139-148, 1987.
FIEGENBAUM, A.; SUDHARSHAN, D.; THOMAS, H. Strategic time periods and strategic groups research: concepts and an empirical example. Journal of Management Studies, v. 27, p. 133-148, 1990.
FLAVIÁN, C.; HABERBERG, A.; POLO, Y. Food retailing strategies in the European Union. A comparative analysis in the UK and Spain. Journal of Retailing and Consumer Services, v. 9, p. 125-138, 2002. FLAVIÁN, C.; POLO, Y. Competitive strategies in Southern Europe: the case of Spanish retailers. International
Journal of Retail & Distribution Management, v. 26, p. 13-28, 1998.
GARCÍA, M. T.; SANTOS, M. V.; VELLELADO, E. Grupos estratégicos en las cajas de ahorro españolas: dinámica temporal, consistencia interna y resultados. Cuadernos de Economía y Dirección de la Empresa, v. 10, p. 432-461, 2001.
GONZALEZ, R. B.; SAVOIA, J. R.; GOUVÊA, M. A. Grupos estratégicos bancários: uma abordagem transversal multivariada para o problema da segmentação dos bancos no Brasil. RAM – Revista de Administração Mackenzie, v. 9, n. 7, p. 11-40, 2008.
HATTEN, K. J. Strategic Models in the Brewing Industry. Doctoral Thesis, Purdue University, 1974. HATTEN, K. J.; HATTEN, M.L. Strategic Groups, Asymmetrical Mobility Barriers and Contestability.
Strategic Management Journal, v. 8, p. 329-342, 1987.
HUNT, M. Competition in the Major Home Appliance Industry, 1960-70. Doctoral Thesis, Harvard University, 1972.
KETCHEN, D. J.; THOMAS J. B.; SNOW C. C. Organizational Conigurations and Performance: A Comparison of Theoretical Approaches. Academy of Management Journal, v. 36, p. 1278-1313, 1993. MÁS, F. J. Dynamic analysis of competition in marketing: strategic groups in Spanish banking. International
Journal of Bank Marketing, v. 17, p. 233-250, 1999.
MÁS, F. J. Predicción de la estructura future de la indústria. La teoría de grupos estratégicos. Economía Indústrial, v. 311, p. 193-201, 1996.
MASCARENHAS, B. Strategic Groups Dynamics. Academy of Management Journal, v. 32, p. 333-352, 1989.
MASCARENHAS, B.; AAKER, D. A. Mobility Barriers and Strategic Groups. Strategic Management Journal, v. 10, p. 475-485, 1989.
MCGEE, J.; THOMAS, H. Strategic Groups: Theory, Research and Taxonomy. Strategic Management Journal, v. 7; p. 141-160, 1986.
NEWMAN, H. H. Strategic Groups and the Structure-Performance Relationship: A Study with Respect to the Chemical Process Industries.Doctoral Thesis, Harvard University, 1973.
NEWMAN H. H. Strategic groups and the structure-performance relationship. Review of Economics and Statistics, v. 60, p. 417-427, 1978.
OSTER, S. M. Intraindustry structure and the ease of strategic change. Review of Economics and Statistics, v. 64, p. 376-383, 1982.
PATTON, G. R. A Simultaneous Equation Model of Corporate Strategy: The Case of the U.S. Brewing Industry.Doctoral Thesis, Purdue University, 1976.
PORTER, M. E. Consumer Behavior, Retailer Power, and Manufacturer Strategy in Consumer Goods Industries. Doctoral Thesis, Harvard University, 1973.
PORTER, M. E. Interbrand Choice, Strategy and Bilateral Market Power. Cambridge: Harvard University Press, 1976.
PORTER, M. E. The structure within industries and companies performance. Review of Economics and Statistics, v. 61, p.214-227, 1979.
BBR
14,4
384
SUDHARSHAN, D.;THOMAS, H.; FEIGENBAUM, A. Assessing mobility barriers in dynamic strategic groups analysis. Journal of Management Studies, v. 28, p. 429-438, 1991.
TRIBUNAL DE CONTAS DA UNIÃO. Contas do Governo da República: Exercício de 2009, available at www.tcu.gov.br.