MARCEL VAILLANT
Universidad de la República, Montevideo – Uruguay.
ENRIQUE GILLES
Universidad EAN, Bogotá – Colombia.
To cite this paper: Vaillant, M., & Gilles, E. (2017). Incorporation of services in natural resource-intensive goods: description and measurement. Revista de Administração Mackenzie, 18(6), 15-46. doi 10.1590/1678-69712017/administracao.v18n6p15-46
ACKNOWLEDGEMENTS
We thank Guillermo Valles and Mina Mashayekhi from UNCTAD Trade Division for the support and the relevant comments in earlier versions of this paper. We also thank Nanno Mulder and other seminar participants at the V Con-ference of Redlas in 2016 in São Paulo, Brazil. All remaining errors are the responsibility of the authors.
INCORPORATION OF SERVICES IN
16
ABSTRACT
Purpose: To understand how services can add value to the production and exports of NRIGs, in which South American countries have comparative advantages.
Originality/value: South American countries play a key role in international markets of the so-called Natural Resource Intensive Goods (NRIGs), particularly, mining and food. It has been discussed that this specialization pattern has disadvantages in terms of economic development, and both policy makers and academia repeatedly sustain the need to search for new international insertion schemes. In this paper, we discuss that one such avenue could be based on these comparative advantages themselves, through Services and in a particular infrastructure.
Design/methodology/approach: To measure the relevance of economic infrastructure services on the competitiveness of NRIGs, we develop a sectoral approach using domestic input-output tables for six Latin American countries. In particular, we measure Services value added incorporated in NRIGs, and we also analyse the impacts of productivity changes in infrastructure services on NRIGs producer prices.
Findings: Results allow to identify which infrastructure services are more important to each NRIG in each country.
KEYWORDS
17
1. INTRODUCTION
The specialization pattern of South American countries is concentrated in NRIG (Vaillant, 2015), and the region’s insertion in the international economy is limited to a small set of goods: only 52 products account for 70%
of total exports.1 The region has actually the highest rate of concentration of
the first decile in the average period 2009-2012 compared to other regions of the global economy. Almost all goods in the first decile are NRIGs, the share of manufactured products is very low. Moreover, the set of products with revealed comparative advantage is also reduced: less than 500 products, which is much less than the world average of 800 products (Vaillant, 2015).
In other words, South American countries have economies with very low levels of export diversification. However, this long tradition also implies a huge accumulation and learning experience on how to intensify the exploitation of this type of resources in a sustainable way. In particular, the last stage of development, characterised by an important process of technical change in natural resources exploitation, has been very relevant. The market size provides a sufficient scale for incorporating service-related activities (specialised knowledge business services – KIBS) and through this mechanism, it creates new types of trade specialisation patterns.
The servicification process can be widely defined as a business strategy that entails a shift from pure manufacturing to the production of goods and services. The term can be tracked back to Vandermerwe and Rada (1988). One of the consequences of this phenomenon is for national systems of economics statistics: if manufacturing firms increasingly become service providers, then figures potentially involve errors and omissions. At firm level, many of them have been undertaking such a path, mainly as a response to increased competition in their original product markets. This is the case of IBM, for example, which turned from computer manufacturer to a supplier of a whole range of system business solutions (Ahamed, Inohara, & Kamoshida, 2013), or the case of Rolls Royce that changed from an airplane engine supplier to a supplier of “power-by-the-hour”, i.e., their customers sign a contract through which Rolls Royce ensures engines functioning all along the year by providing the proper maintenance. In Latin America, we also find evidence of servicification, where, by incorporating specialized services, some traditional natural resources may upgrade in value chains. In particular,
1
18
we can mention some examples of KIBS around seed innovation in Argentina and Brazil, the salmon industry in Chile or cattle traceability in Uruguay.
The incorporation of services into commodities is a complementary approach to their industrial processing, e.g. the more traditional use of logistics, transportation, communications, etc. in the production of goods. Both strategies yield simultaneous benefits in terms of job creation, techni-cal progress, product diversification and quality improvement. However, policy recommendations may be different for each of them. Indeed, while downstream, traditional services associated with the production of goods (infrastructure, logistics, communications, insurances, etc.) may have a role in job creation and overall economic activity, servicification may also define new paths of sustainable growth in a highly integrated world. As mentioned above, services also play a key role in the technological upgrading of value chains created in or around natural resources.
How can services add value to the production and exports of natural resource intensive goods? Incorporating services into the production of goods allows both differentiation and consolidation in accessing new markets, as well as to generate an increment in the domestic value added, with higher contents of skilled labour. This productive strategy can achieve similar results in terms of creating greater domestic employment compared to conventional alternatives that focus on increasing production levels and industrial processing. Increasing domestic value added through service incorporation is particularly relevant for natural resources-intensive goods (NRIG), as these products dominate the export baskets of Latin American countries, especially those in South America.
1.1. Review of the literature
The most recent phase of the globalization process has led to a deep transformation in the international economy. One of the main characteristics is the permanent increase in both the intensive and extensive margins over the tradability of economic activities (goods and services). One of the sources behind this phenomenon is the acceleration of technical change in information and communication technologies (ICTs), together with a general reduction in trade costs (transport costs and other distance-related costs, plus trade policy variables), facilitating the fragmentation of production at a world scale with an increase in trade specialization.
19 (GVC). A new international division of labor has emerged, that a new inter-national trade theory names as trade in tasks (Grossman & Rossi-Hansberg, 2006). This process started in the modern manufacturing sector (transport equipment, electronics, optic machines, chemicals, and pharmaceutics) but is now extended to other economic activities (in particular, services).
Trade in intermediate goods and business services was traditionally relevant in international trade (Sturgeon & Memedovic, 2010; Hummels & Klenow, 2005), and the same phenomenon happens with services oriented to satisfy a demand of inputs in the production process (production services). Trade in intermediates is also an important channel through which technology is transferred from developed to developing countries. Amiti and Konings (2007) show that imports of intermediates and capital goods may improve the firm productivity.
Services are at the core of these new fragmentation phenomena as they have incremented their participation in world trade. Nowadays, trade in commercial services – only considering current account Balance of Pay-ments data – represents more than 20% of the world trade; however, if the trade is measured in value added, this figure achieves half of the world trade (Escaith, 2008).
The conventional theoretical approach associates services to low rates of innovation and a low productivity path. In particular, this applies to services that satisfy final demand, which also gradually increases its weight in total expenditure. Examples of these services are typically haircuts, automotive repairs, travel, and tourism, or personal services such as day care, laundry or the like. This sustains the prediction of stagnation in total productivity (“Baumol disease” and Balassa-Samuelson effect). However, the changes described challenge this conclusion and give a very different picture (Francois & Hoekman, 2010). First, services associated with production as intermediate inputs increase its productivity and so the set of the others activities they are related to by intersectoral linkages. Second, many services associated with final demand changed positively their pattern of innovation and productivity, influenced by the same fundamentals, i.e. the ICT revolution.
20
1. Evidence of “premature deindustrialization” of many developing
economies2 in a context of good growth performance.
2. The tradability of services has progressively increased, and value chains of production have globally expanded.
3. High productivity gains are being experienced by certain service branches.
It is also important to differentiate between services associated with final consumption and services as intermediate inputs. The trade in tasks phenomenon is mainly associated with the latter, which are those demanded as inputs by other production processes. The fragmentation process requires an intensification in the use of services, mainly in the form of specialized services production. The fragmentation of production needs standardization and implies an intensive use of information technology, which is associated with the development of specialized production services.
The result is an increase in the intensity in the use of specialized production services that participate as an intermediate input in many different activities and types of firms. The empirical evidence goes from small firms to large multinationals, and from basic and food industries to the engineering industry. Three main factors explain this outcome in manufacturing (Lodefalk, 2015):
1. Service is a relevant factor to the increment in productivity, in particular through the use of services in logistics, management or engineering that save time, materials and improve coordination (Nordas cited by Lodefalk, 2015). Furthermore, these services are more intense in the use of skilled labour, which means the ability to absorb technical change is higher than in other sectors, with positive effects in terms of productivity. 2. Adding services to goods can also be a profitable strategy: firms may
differentiate their supply (augmenting their value) by bundling services with products or offer them in connection to their sales. By doing so, it will be easier for them to deal with the increasing international regulation on environmental and social issues. Many different types of barriers to trade require diverse types of certification that are associated with specialized services. With this strategy, the firms fulfil the norm and obtain a certification that is crucial to jump the trade barrier.
2
21 3. Manufacturing firms need services to establish, join and manage interna-
tional production networks and value chains, including headquarter or business partner services, such as data processing and R&D services (Kelle cited by Lodefalk, 2015). All of them are associated with the coordination cost dimension related to the process of fragmentation of production in many different stages (Grossman & Rossi-Hansberg, 2012).
Finally, Arbache and Moreira (2015) propose a classification of services in two groups based on their role as inputs in the manufacturing sector:
1. Specialized production services. This includes value and innovation ser-vices, and refers to functions that contribute to adding value, differen-tiating and customizing products and, therefore, raising their market price and increasing labour and global productivity and the return on capital – usually composed of services that require relatively high levels of human capital (R&D, design, engineering and architecture projects, consulting services, software, specialized technical services, high-end IT services, branding, marketing, trading, among others).
2. Cost services. This refers to activities that affect production costs through the use of economic infrastructure services (logistics and transportation, general infrastructure services, financial services, etc.).
Vaillant (2015) analyses the first type of services, whereas here, we deal with cost services by developing and applying a methodology of value added service contents in commodities exports in a selected group of South American countries.
Coherently with the globalization of service production, it is possible to observe a process of expanding the scope of trade rules and topics in different
types of trade agreement covering service activities.3 Typically, services are a
non-tradable, so regulations are established on a domestic perspective, i.e. covering national jurisdictions. When trade increasingly involves service activities, the demand for new international rules and the treatment of related topics also increase.
All these phenomena have an impact on the international trade policy agenda, which is usually dominated by market-access issues. How much
3
22
access should be provided in my own market in order to get better access conditions in the neighbors’ market? The fragmentation of international economic activity has strengthened the link between protection of one’s own market and foreign market access conditions. Baldwin and Robert-Nicoud (2015) have pointed out that this is good news from the perspective of expected results related to the endogenous mechanisms of trade liberali-zation. The more it is perceived that reducing own barriers will also reduce the neighbor’s barriers, the more open unilateral domestic trade policy will be. This mechanism seems to have started gradually acting in the trade of goods and particularly in certain manufacturing sectors that tend to converge to a trade of “zero tariff for zero tariff ”. However, a negotiating effort is required to get improvements in some markets characterized by deeper distortions (certain sectors of agriculture and manufacturing, services, complementary matters).
Considering the new specialization phenomena that we contribute to identify in this paper, in the near future, the role of the service sector will be seen as an essential topic of the trade agreement negotiations agenda. Given the heterogeneous nature of this sector, which, as we mentioned before, includes final demand services but also specialized production services, domestic trade policies should take a differentiated approach.
Besides trade policies, these new developments call for renovated public policies for the development of specialized service providers that add value to natural resources, or increase their productivity capacity through innovation activities in a sustainable way. Traditionally, public policies for both the service sectors and the NRIGs are designed without any link, and their imple-mentation is frequently in charge of different government agencies. The new phenomena imply a challenge to associate and to integrate different sectors in policies and regulations, new institutions, trade agreements, specific incentives, and specialized education at technological and university levels.
2. ECONOMIC INFRASTRUCTURE SERVICES
AND NRIG COMPETITIVENESS
2.1. Methodological approach
23 transport, distribution and logistics in the exports of natural resources. One way to measure their contribution is through the value added of those services embodied in the exports of NRIGs. At the same time, we will also look at the impact of the Service sector productivity and performance on the exports of natural resource intensive products. This type of services is included in the second category (cost services) defined by Arbache and Moreira (2015) and may be studied using conventional Input-output techniques.
Within that framework, a first approach to assess the role of services in NRIG can be conducted by analysing the intensity in production. This allows identifying industries which use services as intermediate inputs more intensively. A second approach to tackle the same objective is to analyse the value-added content of services included in the exports of NRIGs.
It is also possible to study the role of Services in the competitiveness of NRIG. To that end, we develop the Leontief price model as proposed in Gilles and Vallecilla (2015), which the main result is the change in sectorial prices as a result of changes in the value added (VA) of a given sector. We will use this framework to simulate the effects of an increase in productivity in the Services sector: such a process would translate into a decrease in value added. Indeed, as a sector becomes more productive we should observe a decrease in its share of VA in gross output. As noted in Gilles and Vallecilla (2015), “the model has been used in several environments to analyse different objectives. For example, Bazzazan et al. (2003) use it in the context of energy assessment policy; Davar (2006) discusses price discrimination issues with the model, while Folloni et al. (1993) evaluate different price formation hypothesis”.
It is worth noting that this approach may fail to capture some part of price variations in case of non-competitive markets. Indeed, the methodology assumes a perfect pass-through going from productivity impulses to price reactions, an assumption that may be too strong in case of markets charac-terized by monopolies, oligopolies or other forms of imperfect competition. For the case of a heterogeneous sector, such as Services, in which we have both tradable and non-tradable activities and a variety of situations, we should be aware of this shortcoming.
24
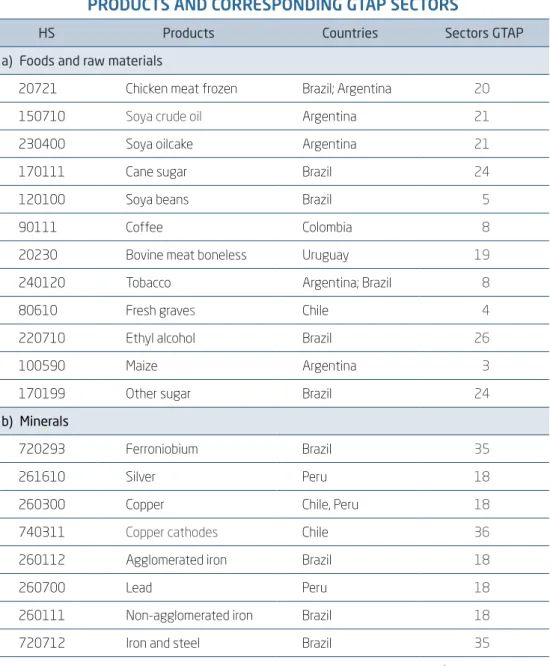
Table 1 presents the group of analysed commodities and their corre-spondences to GTAP sectors.
Table 1
PRODUCTS AND CORRESPONDING GTAP SECTORS
HS Products Countries Sectors GTAP
a) Foods and raw materials
20721 Chicken meat frozen Brazil; Argentina 20
150710 Soya crude oil Argentina 21
230400 Soya oilcake Argentina 21
170111 Cane sugar Brazil 24
120100 Soya beans Brazil 5
90111 Coffee Colombia 8
20230 Bovine meat boneless Uruguay 19
240120 Tobacco Argentina; Brazil 8
80610 Fresh graves Chile 4
220710 Ethyl alcohol Brazil 26
100590 Maize Argentina 3
170199 Other sugar Brazil 24
b) Minerals
720293 Ferroniobium Brazil 35
261610 Silver Peru 18
260300 Copper Chile, Peru 18
740311 Copper cathodes Chile 36
260112 Agglomerated iron Brazil 18
260700 Lead Peru 18
260111 Non-agglomerated iron Brazil 18
720712 Iron and steel Brazil 35
Source: Vaillant (2015) and correspondence tables with GTAP sectors.4
4
25 Services are going to be aggregated into six main categories (big sectors), which include infrastructure economic services (transport, trade, financial, public services), plus construction and other business services (see Table B2).
2.2. Results
2.2.1. Domestic Value-added contents of NRIG exports in EIS
The results on direct requirements in the use of economic infrastructures services (EIS) by NRIGs can be seen in Chart B1. With this information, we compute the domestic value-added contents of exports, considering the aggregate use of the different EIS (cf. Chart 1).
Chart 1
NRIG DOMESTIC VALUE-ADDED (VA) CONTENTS OF SERVICES (MILLION DOLLARS IN 2007 AND %)
Countries Sectors (1) Exports
(2) VA contents
(3) % Services VA
(4) VAX ratio % (VA/Exports)
(5) Import contents (%)
Argentina
3 2706 2253 14,5 83,3 16,7
8 432 403 4,7 93,3 6,7
20 488 355 22,8 72,6 27,4
21 10716 8688 23,0 81,1 18,9
Rest 49612 37552 27,5 75,7 24,3
Total 63953 49250 25,9 77,0 23,0
Brazil
5 6889 6334 16,5 91,9 8,1
8 5844 5378 16,8 92,0 8,0
18 19804 17829 34,5 90,0 10,0
20 7090 6645 23,7 93,7 6,3
24 5013 4631 23,7 92,4 7,6
26 1610 1471 31,9 91,4 8,6
35 8491 6980 39,9 82,2 17,8
Rest 121470 100689 43,6 82,9 17,1
Total 176209 149957 38,6 85,1 14,9
26
Countries Sectors (1) Exports
(2) VA contents
(3) % Services VA
(4) VAX ratio % (VA/Exports)
(5) Import contents (%)
Uruguay
19 901 771 18,5 85,5 14,5
Rest 5772 3970 36,8 68,8 31,2
Total 6673 4741 33,8 71,0 29,0
Chile
4 3014 2698 19,8 89,5 10,5
18 17285 14113 27,1 81,7 18,3
36 24820 19611 26,0 79,0 21,0
Rest 23980 16899 40,5 70,5 29,5
Total 69098 53321 30,6 77,2 22,8
Peru
18 9685 8377 19,6 86,5 13,5
Rest 19893 17943 22,5 90,2 9,8
Total 29577 26320 21,6 89,0 11,0
Colombia
8 2429 2276 4,2 93,7 6,3
Rest 29030 24592 27,8 84,7 15,3
Total 31458 26868 25,8 85,4 14,6
Note: (2) Definition in equation A10; (3) see equation A9 and Chart B1; (4) = (2)/(1), see equation A11; (5) see equation A4.
Source: Elaborated by the authors based on GTAP.
The share of these types of sectors is less than in the rest of the economy in almost all the sectors associated with NRIGs (see Table 1). Only for Brazil, in sector 35 (Ferrous metals) the share is greater than in the average global economy. In the mineral sectors, the intensity is typically greater than in the other commodities and close to the average of the economy (see the cases of Chile, Peru, and Brazil). In the NRIG sectors, the VAX ratio is typically high or the import contents of exports are low. This result is natural considering that this type of sectors is defined by the intensive use of domestic factors (natural resources).
Chart 1 (conclusion)
27
Chart 2
SHARE OF DOMESTIC VALUE-ADDED BY ECONOMIC INFRASTRUCTURE SERVICES (%)
Countries Sectors Service domestic value-added content VAS/VA
I II III IV V VI
Argentina
3 0,2 1,1 2,7 2,0 1,5 7,0 14,5
8 0,2 0,4 1,2 0,8 0,8 1,4 4,7
20 0,4 0,6 9,4 5,5 1,9 4,9 22,8
21 0,4 1,0 6,2 7,2 1,5 6,7 23,0
Rest 0,8 1,0 5,8 8,0 2,1 9,8 27,5
Total 0,7 1,0 5,7 7,5 2,0 9,0 25,9
Brazil
5 2,2 0,1 5,8 3,6 2,4 2,3 16,5
8 2,7 0,1 5,6 3,6 2,4 2,3 16,8
18 5,3 0,2 7,0 11,2 5,2 5,6 34,5
20 3,5 0,1 8,2 5,0 2,8 4,0 23,7
24 3,9 0,2 4,8 6,5 3,5 4,9 23,7
26 4,2 0,2 9,7 7,6 4,1 6,1 31,9
35 11,9 0,2 6,7 10,6 5,7 4,9 39,9
Rest 5,3 0,5 8,9 10,2 5,4 13,4 43,6
Total 5,2 0,4 8,2 9,4 4,9 10,5 38,6
Uruguay
19 1,5 1,4 4,2 3,3 6,3 1,9 18,5
Rest 3,6 1,2 7,5 9,3 7,0 8,2 36,8
Total 3,3 1,2 6,9 8,4 6,9 7,2 33,8
Chile
4 0,5 0,3 6,0 3,6 0,9 8,5 19,8
18 5,6 0,3 2,8 3,9 0,9 13,6 27,1
36 2,5 0,3 3,9 3,9 1,3 14,1 26,0
Rest 2,3 0,5 7,0 10,8 3,3 16,5 40,5
Total 3,2 0,3 4,7 6,1 1,8 14,5 30,6
28
Countries Sectors Service domestic value-added content VAS/VA
I II III IV V VI
Peru
18 2,5 0,3 1,0 2,4 3,7 9,7 19,6
Rest 2,1 0,5 1,8 5,1 4,4 8,6 22,5
Total 2,2 0,4 1,5 4,2 4,2 9,0 21,6
Colombia
8 0,4 0,1 1,0 0,6 1,2 0,8 4,2
Rest 2,1 0,6 5,2 6,6 5,9 7,3 27,8
Total 2,0 0,6 4,9 6,1 5,5 6,8 25,8
Source: Elaborated by the authors.
It is also important to highlight that we are only measuring the EIS (cost services, in Arbache and Moreira (2015) terminology) because conventionally specific product services are embodied in the gross value of each commodity sector.5
However, there are three cases where direct and indirect intensity in the use of import is high: meat products (sector 20), in Argentina; ferrous metals (sector 35), in Brazil; other minerals (sector 18), in Peru.
Results on the total value added generated by NRIG exports disaggregated by type of EIS are presented in Chart 2 according to equation (A8) in Appen-dix A. In this case, it is possible to identify an association between the type of EIS service and the NRIG sector. We summarize the results in Chart 3. For Argentina, an intensive use of trade services and transport services is verified in chicken meat (20) and vegetable oils (21), respectively. In Brazil, the minerals sector (18) is associated with public services, as electricity, gas, and water (I); the beverage sector (26) in trade services (III); and, finally, in ferrous metals (sector 35) the intensity link is with public services (I), trans-port (IV) and financial services (V). For Chile, in minerals (18) the link is with public services (I). Finally, in Peru, also in minerals (18), the associa-tion is with other business services.
5
It is restrict to work with a high level of aggregation of the IO analysis, therefore, it could only be solved with more detailed and deep product case studies.
Chart 2 (conclusion)
29
Chart 3
ASSOCIATION BETWEEN EIS AND NRIG BY COUNTRY
Countries Sectors EIS VA contents intensity
I III IV V VI
Argentina
20 +
21 +
Brazil
18 +
26 +
35 + + +
Chile 18 +
Peru 18 +
Source: Elaborated by the authors.
2.2.2. EIS productivity and prices competitiveness of NRIG
Finally, we present the results of the Leontief price model. As mentioned before, we are interested in analysing the effects of a 10% increase in EIS productivity on the prices of NRIGs. The definition of productivity we adopt is the one that relates total production to factor use (i.e. the reciprocal of the value added to gross output ratio); thus, the increase in productivity is
modelled through a ceteris paribus decrease in value added in services, as
30
Chart 4
PERCENT CHANGE ON COMMODITIES’ PRICES AS A RESULT OF A 10% INCREASE IN ECONOMIC INFRASTRUCTURE SERVICES PRODUCTIVITY (%)
Country Sector Economic infrastructure services
I II III IV V VI All
Argentina
3 -0.05 -0.12 -0.32 -0.32 -0.21 -0.68 -1.70
8 -0.02 -0.05 -0.15 -0.12 -0.10 -0.17 -0.60
20 -0.07 -0.11 -0.83 -0.59 -0.24 -0.47 -2.30
21 -0.09 -0.12 -0.63 -0.73 -0.22 -0.65 -2.44
All -0.13 -0.39 -0.98 -0.78 -0.43 -0.80 -3.51
Brazil
5 -0.25 -0.02 -0.59 -0.40 -0.27 -0.32 -1.86
8 -0.29 -0.02 -0.58 -0.40 -0.27 -0.32 -1.88
18 -0.54 -0.02 -0.70 -1.10 -0.54 -0.67 -3.56
20 -0.37 -0.02 -0.82 -0.53 -0.30 -0.47 -2.50
24 -0.41 -0.02 -0.50 -0.67 -0.38 -0.58 -2.55
26 -0.44 -0.02 -0.95 -0.76 -0.43 -0.70 -3.31
35 -1.11 -0.03 -0.67 -1.04 -0.57 -0.63 -4.05
All -0.51 -0.34 -1.26 -1.12 -0.79 -1.14 -5.16
Uruguay
19 -0.19 -0.13 -0.46 -0.37 -0.65 -0.25 -2.06
All -0.42 -0.55 -1.21 -0.74 -0.86 -0.61 -4.37
Chile
4 -0.12 -0.03 -0.61 -0.38 -0.12 -0.91 -2.16
18 -0.64 -0.03 -0.32 -0.43 -0.16 -1.35 -2.93
36 -0.34 -0.03 -0.42 -0.42 -0.21 -1.42 -2.85
All -0.44 -0.43 -0.83 -0.91 -0.55 -1.88 -5.04
Peru
18 -0.34 -0.04 -0.10 -0.24 -0.36 -0.96 -2.03
All -0.34 -0.53 -0.22 -0.52 -0.50 -1.14 -3.25
Colombia
8 -0.05 -0.01 -0.13 -0.09 -0.15 -0.12 -0.55
All -0.30 -0.49 -1.08 -0.80 -0.80 -0.65 -4.12
31 As the first comment on these results, it can be noticed that the average impact of services on the prices of the economy is reduced. Moreover, this is particularly true for the selected commodities, which feature below-of- the-average changes. In fact, these goods are generally in the low tale of the distribution of price impacts along the economy (minerals being the exception). The group of services which produces the largest impacts on prices in most countries is Trade services (III), followed by Transport (IV) and Other business services (VI).
For the Argentinean case, the impacts in sectors three (cereals); eight (other crops); and 21 (vegetable oils and fats) are low and are mainly explained by improvements in Trade and Other business service productivities. Sector eight presents a very low reaction (to any service improvement), whereas sec-tor 20 (meat products) is affected by Trade and Transport services.
In Brazil, we find the highest impacts on prices. For example, sectors 18 (minerals), 26 (beverage and tobacco) and 35 (ferrous metals) are the most influenced, mainly by Transport, Trade and Other business services, as well as Financial services. Importantly, minerals and ferrous metals price reactions to changes in electricity, gas and water services productivity lie above the price impact of the latter on the whole economy prices. This is consistent with the fact that these NRIG are closely related to group I services, as mentioned in Chart 4.
The same over-reaction is also found in the Mineral sector in both Chile and Peru, whereas the figures for Colombia are extremely low. In Uruguay, the most important service group in terms of its impacts on NRIG competi-tiveness is Financial services; however, the size of the impact is low.
Overall, we could present results of the association of service produc-tivities and NRIG competitiveness by simply using Chart 4 and changing its title. The main intuition is that commodities benefit from productivity changes of services according to the intensity in their respective production functions.
3. CONCLUSIONS
32
region benefit from the improvement of services to eventually become their net exporter? In this paper, we give some new information that will be necessary to answer this question.
One of the characteristics of the current era of globalization is the increase of the intensity in the use of specialized production services that participate as an intermediate input in many different activities and types of firms. The ability of the new technologies to penetrate in all kinds of activities is one of the most important features of the changes to the production functions all over the world. This means servicification may be possible in many different activities and not only in dynamic manufacturing sectors. Our paper focuses on the identification of the phenomenon in the case of natural resources-intensive goods (NRIG) in South America.
Following Arbache and Moreira (2015), we distinguish two types of services: specialized production services and cost services (mainly from economic infrastructure services). Two different methodologies are used to study the servicification process in each type of services.
An indirect methodology is applied to identify the group of products and countries in which an increment in the use of specialized production services could be observed, based on the performance of the trade data in a recent period (2000s). Food and raw materials is the first subset composed of 12 products that are identified with dynamic behaviour combined upon relevance in the world market. For minerals sectors, eight products fulfil the set criteria. Six South American countries export this set of 20 NRIGs.
Additionally, a review of recent literature about specialized production services in a set of NRIG is proposed. This shows that the big scale of regional markets in NRIG, the intensification of production combined with the acceleration of technical change together with the increase requirements in standardization and certification (both at the domestic and international levels) are the environment where specialized production services (in particulars new KIBS) are developed. Sectors with strong RCA (NRIG) generate domestic interlinkages, which imply an incentive to develop new economic activities. These markets are huge at international level and they can create a representative demand in particular for the regional countries. Based on this critical mass, new competitive services activities, which have the potential to be internationalized, could be developed. It seems like a combined Hirschman and Linder mechanism, as referred by Gonzalez, Meliciani y Savona (2015).
33 minerals), which implies 17 different bilateral country-sector matches. Three countries (Argentina, Colombia, and Uruguay) are linked to food and raw materials sectors. Peru is associated only to mineral sectors. Finally, Brazil and Chile export products in both sectors.
We developed two types of indicators to approximate the relevance of EIS in NRIG. First, we measure the domestic value-added contents (by subtype of EIS) in each combination country-NRIG sector export. Naturally, in NRIG sectors, the use of EIS is lower than in the rest of the economy for all countries. However, the relevance of EIS is greater in minerals sectors and, in some cases, it is close to the average of the economy. The disaggregated results show different types of associations between EIS and specific NRIG sectors.
Finally, we present the results of the price model, which produces price effects on commodities following the increases in EIS productivity. The general line of the association between EIS services and NRIG sectors is the same. However, we give evidence about the size of the effects considering how prices are affected by an increase in the productivity of transport services. The main impact is observed in the case of Brazil with the public service (I) productivity increasing, what implies a decrease in the price of ferrous metals (35). The effect of transport service (IV) is relevant in the price of the vegetable oil sector in Argentina, and a positive shock in productivity of other business services (VI) has a positive impact on competitiveness in metals (36), in Chile, and minerals (18), in Peru.
These results can also be interpreted from a global value chain perspective. Although South American countries have a very low integration to global production, their role is found in the supply of raw materials and commodities, which as it is well known, has a low potential for employment, human development, and innovation. The challenge for these countries is to use their comparative advantages in NRIGs to develop specialized production services in turn that may be successfully integrated into other global value chains. In the case of economic infrastructure services, they are more related to domestic economic and structural conditions, but they may give rise to regional value chains, another aspect in which South America is lagged behind compared to the experience in other regions’.
34
over EIS shows that the effect of Cost Services over the competitiveness of the commodities is idiosyncratic for each country. This fact revealed a heterogeneous development of infrastructure among South American countries combined with different productive specialization patterns, which imply different intensities in the use of the EIS.
REFERENCES
Ahamed, Z., Inohara, T., & Kamoshida, A. (2013). The servitization of
manufacturing: An Empirical case study of IBM corporation. International
Journal of Business Administration, 4(2), 18-26. doi 10.5430/ijba.v4n2p18 Amiti M., & J. Konings, (2007). Trade liberalization, intermediate inputs,
and productivity: Evidence from Indonesia. The American Economic Review,
97(5), 1611-1638. doi /10.1257/aer.97.5.1611
Anlló, G., Bisang, R., & Katz, J. (2015). Aprendiendo con el agro argentino:
de la ventaja comparativa a la ventaja competitiva. Banco Interamericano de
Desarrollo. Retrieved from https://publications.iadb.org/handle/11319/ 6932
Arbache, J., & Moreira, R. (2015). How can services improve productivity? The
case of Brazil. Proceedings of the IV Congress Redlas, Montevideo, Uruguay. Baldwin, R., & Robert-Nicoud, F. (2015). A simple model of the juggernaut
effect of trade liberalisation. International Economics, 143, 70-79. doi 10.1016/
j.inteco.2015.04.008
Baldwin, R. (2012). WTO 2.0: Global governance of supply chain trade.
Switzerland: University of Oxford: CEPR.
Baldwin, R. (2013). Global supply chains: why they emerged, why they matter, and
where they are going in Global value chains in a changing world. Switzerland: WTO: Fund Global Institute.
Bazzazan, F., & Batey, P. (2003). The Development and Empirical Testing of
Extended Input-Output Price Models. Economic Systems Research, 15(1), 68- 86.
Cattaneo, O., Gereffi, G., & Staritz, C. (Eds.). (2010). Global value chains in a
post-crisis world: A development perspective. Washington, DC: The World Bank.
Davar, E. (1993). Price discrimination in Input-Output. Economic Systems
Research, 5(1), 3-10.
Escaith, H. (2008). Measuring trade in value added in the new industrial
35 Folloni, G., & Miglierina, C. (1994). Hypothesis of Price Formation in
Input-Output Tables. Economic Systems Research, 6(3), 249-264.
Gallego, J. M., Jaramillo, H., & Patiño, A. (2015). Servicios intensivos en
conocimiento en la industria del petróleo en Colombia. Retrieved from https:// publications.iadb.org/handle/11319/7265
Gana J. & Meller, P. (2015). El cobre chileno como plataforma de innovación
tecnológica. Santiago: Cieplan.
Gilles, E., & Vallecilla, J. (2015). Infraestructura y exportaciones de commodities
agrícolas en Colombia. Retrieved from http://www.redlas.net/materiali/ priloge/slo/gilles-vallecilla-2015.pdf
Grossman, G. M., &Rossi-Hansberg, E. (2006). The rise of offshoring: it’s not wine for cloth anymore. Retrieved from https://www.princeton.edu/~ erossi/RO.pdf
Grossman, G. M., & Rossi-Hansberg, E. (2012). Task trade between similar
countries. Econometrica, 80(2), 593-629. doi 10.3982/ECTA8700
Francois, J., & Hoekman, B. (2010). Services trade and policy. Journal of
Economic Literature, 48(3), 642–692. doi 10.1257/jel.48.3.642
Hutcheson, T. (2006). HS2002-CPC 1.1-ISIC, Rev3-GTAP Concordance. West
Lafayette: Purdue University: Global Trade Analysis Project (GTAP). Retrieved from https://www.gtap.agecon.purdue.edu/resources/res_ display.asp?RecordID=1916
Hummels, D., & Klenow, P. J. (2005). The variety and quality of a nation’s
exports. American Economic Review, 95(3), 704–723. doi 10.1257/00028280
54201396
Johnson, R. C., & Noguera, G. (2012). Accounting for intermediates: Production
sharing and trade in value added. Journal of International Economics, 86(2),
224–236. doi 10.1016/j.jinteco.2011.10.003
Lodefalk, M. (2015). Servicification of manufacturing firms makes divides in trade policy –Making antiquated. Örebro: University School of Business. Retrieved from https://www.researchgate.net/publication/270875940_ Servicification_of_Manufacturing_Firms_Makes_Divides_in_Trade_ Policy-Making_Antiquated
36
Meglio, G. di, Gallego, J., Maroto, A., & Savona, M. (2015). Services in developing economies: A new chance for catching-up? Retrieved from https://www.researchgate.net/publication/284720189_Services_in_ Developing_Economies_A_New_Chance_for_Catching-Up
Miroudot, S., Lanz, R., & Ragoussis, A. (2009). Trade in intermediate goods
and services. OECD Trade Policy Papers, (93). doi 10.1787/5kmlcxtdlk8r-en
Narayanan, B., Aguiar, A., & McDougall, R. (Eds.). (2012). Global trade, assistance, and production: The GTAP 8 data base, center for Global Trade Analysis. Retrieved from www.gtap.agecon.purdue.edu/databases/v8/v8_ doco.asp
Nordås, H. K. (2010). Trade in goods and services: Two sides of the same
coin? Economic Modelling, 27(2), 496-506. doi 10.1016/j.econmod.2009.
11.002
Sturgeon, T., & Memedovic, O. (2010). Mapping global value chains: Intermediate
goods trade and structural change in the world economy. Vienna: United Nations Industrial Development Organization (UNIDO).
Vandermerwe, S., & Rada, J. (1988). Servitization of business: Adding value
by adding services. European Management Journal, 6(4), 314-324. doi 10.1016/
0263-2373(88)90033-3
Vaillant, M. (2015, preprint). Servicios y bienes intensivos en recursos naturales en Sudamérica: nuevas oportunidades de transformación productiva. CEPAL, División de Comercio.
ABOUT THE AUTHORS
MARCEL VAILLANT
PhD in Applied Economics from the Faculty of Applied Economics, Antwerpen University.
Professor at the Department of Economy, Universidad de la República.
Constituyente, 1502 – Centro – Montevideo – Uruguai – CEP 11200
E-mail:[email protected]
ENRIQUE GILLES
PhD in Economics from the Toulouse School of Economics, Université Toulouse Capitole.
Professor at the Department of Economy, Universidad EAN.
Calle 79 #11-43, Bogotá D.C.– Cundinamarca – Colombia – CEP 110121
37
APPENDIX A
METHODOLOGICAL
In this section, we briefly present the input-output model used in this document. It is important to clarify the use of notation and conventions beforehand. To begin with, upper case letters denote matrices, whereas lower case letters denote vectors; finally, letters with subscripts denote real numbers. There are n sectors in the economy. The (nx1) final demand vector
is denoted by f; the use of domestic input i by industry j in monetary terms is
denoted by zij; the direct coefficient matrix, of dimension n, is called A with
elements aij; the corresponding Leontief inverse is L with elements lij. The
import coefficient matrix is named Am with elements mij, which express the
share of foreign input i in terms of domestic sector j’s gross output. Finally,
the gross output vector is x; and the value-added vector is v. The standard
representation of the input-output model is given by:
(
)
1.
x=− I A=− f Lf (A1)
A1. Domestic value-added contents of infrastructure service in NRIGs exports
Whenever there is an export of a NRIG (in fact, of every goods), this implies an increase in gross output and value added, not only in the sector, which the good comes from, but throughout all the economy via sectorial linkages. In this section, we present the methodology to assess the magnitude of those effects as a way to weight their relative importance in the economy.
We start by considering the fact that final demand f can be decomposed
into domestic
(
fd)
and the foreign final demand(
e)
:.
f = +fd e (A2)
According to Hummels et al. (2001), the imports content of total exports can be calculated as:
.
e m
38
This is a vector of all imports contents in global exports. If we sum over sectors and substract from exports, we obtain the total domestic value-added contents of exports
e e e
s s
s s
vdt = −ie im =
∑ ∑
e − m (A4)where i is a vector of ones. We can also express the import contents as a
proportion of total exports,
( )
1,
e m
sm =D e − A Le (A5)
where D() is the diagonal operator.
However, what we want to know is the composition of domestic value added by sector of origin and linked to foreign demand (exports). So, we need to use the vector of the ratio of domestic value added to gross output, defined as
v v x
x a x m x
x a m
s r s
s
s j js s j js s
s j
js j js
= =
− −
= − −
∑
∑
∑
∑
1 (A6)
In matrix terms
( )
(
)
1´ ´
r
v = D x − v= −i A i−M i (A7)
Then, the domestic value-added contents in total exports (by sector) is given by:
( )
e r
vd =D v Le (A8)
In turn, we disaggregate this value added by each sector of the foreign demand (export vector). Then the domestic value added by sector in exports is:
( )
( ) ,
e r
VD =D v LD e (A9)
where VDe is a square matrix of dimension n, in each column we have the
domestic value added generated in a specific sector as a result of exports of each sector (rows). Given the above, it holds that:
e e
39
Also, the total sum of domestic value added isvdte =i vd´ e(see equation
A4). The ratio between domestic value-added contents and exports is:
( )
(
)
1 evax= D e − vd (A11)
( )
(
)
1 eVAX= D e − VD (A12)
Where: vax and VAX are the well-known value added to export ratios of
the Global Value Chain literature (see for example, Johnson and Noguera, 2012). We assume that the domestic value-added contents in imports is zero, so one minus the vax ratio is the import contents associated with total
exports (sme = (i – vax) see equation A4). This could be also defined by
sector and also expressed as a proportion of foreign demand (exports).
A2. Leontief price model
If we assume that it is not quantities but prices that adjust in the economic system, then the standard input-output model can be interpreted as a price model (Miller and Blair, 2009). Looking at sectors from a column perspective, we have that gross sectorial output can be decomposed into the use of intermediate inputs (both domestic and imported) and value added generated,
xj z m v
i ij i ij j
=
∑
+∑
+ . (A13)Next, dividing each side of the above equation by gross sectorial output, we have
1=
∑
+∑
+i ij i ij j r
a am v (A14)
where technical coefficients for domestic and imported intermediates now appear explicitly. The equation reflects the equality between the per-gross-output costs (right hand side) and the unit price (left hand side). Adopting matrix notation, these prices can be interpreted as a price index of the economy:
p´=p A´
(
+Am)
+vr´ (A15)(
)
´=+ +
p A Am p r
40
Where p´is a row vector of industry prices, A is the square matrix of
domestic direct coefficients, Am is the corresponding square matrix for
imported intermediates, and v´c is a 1xn vector of value added to gross
output ratios. Solving for prices and transposing the result, the Leontief price model can then be expressed as:
p=
(
I−At)
vc ≡ ′L vc−
´ 1 (A17)
In this equation, At is the sum of matrices A and Am, whereas L′is the
transpose of the corresponding Leontief inverse. A given equation of this system writes:
pi l vijt l v l v l v
j i t
ij t
i in t
n j
=
∑
= 1 1+ … + + … + . (A18)In other words, every change in sectorial value added will have effects all along the economy prices, according to the Leontief total effect coefficients,
t ij
l which denote the change in industry i price following a change in unit
value added sector j.
APPENDIX B
STATISTICAL
Table B1
SECTORS OF THE INPUT-OUTPUT MATRIX
Sector Title Name
1 PDR Paddy rice
2 WHT Wheat
3 GRO Cereal grains nec
4 V_F Vegetables, fruit, nuts
5 OSD Oil seeds
6 C_B Sugar cane, sugar beet
7 PFB Plant-based fibers
8 OCR Crops nec
9 CTL Bovine cattle, sheep and goats, horses
41
Sector Title Name
10 OAP Animal products nec
11 RMK Rawmilk
12 WOL Wool, silk-worm cocoons
13 FRS Forestry
14 FSH Fishing
15 COA Coal
16 OIL Oil
17 GAS Gas
18 OMN Minerals nec
19 CMT Bovine meat products
20 OMT Meat products nec
21 VOL Vegetable oils and fats
22 MIL Dairy products
23 PCR Processed rice
24 SGR Sugar
25 OFD Food products nec
26 B_T Beverages and tobacco products
27 TEX Textiles
28 WAP Wearing apparel
29 LEA Leather products
30 LUM Wood products
31 PPP Paper products, publishing
32 P_C Petroleum, coal products
33 CRP Chemical, rubber, plastic products
Table B1 (continuation)
SECTORS OF THE INPUT-OUTPUT MATRIX
42
Sector Title Name
34 NMM Mineral products nec
35 I_S Ferrous metals
36 NFM Metals nec
37 FMP Metal products
38 MVH Motor vehicles and parts
39 OTN Transport equipment nec
40 ELE Electronic equipment
41 OME Machinery and equipment nec
42 OMF Manufactures nec
43 ELY Electricity
44 GDT Gas manufacture, distribution
45 WTR Water
46 CNS Construction
47 TRD Trade
48 OTP Transport nec
49 WTP Water transport
50 ATP Air transport
51 CMN Communication
52 OFI Financial services nec
53 ISR Insurance
54 OBS Business services nec
55 ROS Recreational and other services
56 OSG Public Administration, Defense, Education, Health
57 DWE Dwellings
Source: Narayanan et al. (2012).
Table B1 (conclusion)
43
Table B2
ECONOMIC INFRASTRUCTURE SERVICES
Big sector Services Sectors GTAP
I Electricity, gas and water 43;44;45
II Construction 46
III Trade 47
IV Transport and communications 48;49;50;51
V Financial and insurance 52 and 53
VI Other business services 54
Source: Elaborated by the authors.
Chart B1
COUNTRIES AND SECTORS DIRECT REQUIREMENTS OF SERVICES/GROSS OUTPUT BY BIG SECTORS (2007)
Countries Sectors
Direct domestic services requirements/
gross output intermediate Services as inputs
Domestic intermediate
use
I II III IV V VI
Argentina
3 0.00 0.01 0.02 0.01 0.01 0.07 0.12 0.39
8 0.00 0.01 0.01 0.00 0.01 0.01 0.04 0.18
20 0.00 0.00 0.05 0.03 0.00 0.01 0.10 0.78
21 0.00 0.00 0.06 0.09 0.00 0.01 0.17 0.88
Brazil
5 0.01 0.00 0.04 0.02 0.01 0.00 0.10 0.39
8 0.02 0.00 0.04 0.02 0.01 0.00 0.10 0.40
18 0.05 0.00 0.05 0.13 0.04 0.03 0.29 0.53
20 0.02 0.00 0.05 0.04 0.01 0.02 0.14 0.74
24 0.03 0.00 0.02 0.06 0.02 0.03 0.17 0.69
26 0.02 0.00 0.07 0.06 0.02 0.03 0.21 0.75
35 0.10 0.00 0.03 0.08 0.03 0.01 0.26 0.63
Uruguay 19 0.00 0.00 0.01 0.04 0.03 0.01 0.09 0.79
44
Countries Sectors
Direct domestic services requirements/
gross output intermediate Services as inputs
Domestic intermediate
use
I II III IV V VI
Chile
4 0.00 0.00 0.10 0.04 0.01 0.07 0.22 0.29
18 0.08 0.00 0.03 0.04 0.00 0.11 0.27 0.46
36 0.01 0.00 0.04 0.03 0.01 0.08 0.16 0.56
Peru 18 0.00 0.00 0.02 0.03 0.03 0.07 0.15 0.49
Colombia 8 0.00 0.00 0.01 0.00 0.01 0.00 0.03 0.14
Source: Elaborated by the authors.
Chart B2
ECONOMIC INFRASTRUCTURE SERVICES DOMESTIC VALUE-ADDED CONTENTS BY SELECTED SET OF NRIG IN SOUTH AMERICA
(millions of dollars, 2007)
Countries Commodity Exports
Services domestic value-added content VA contents of selected services
Total VA contents
I II III IV V VI
Argentina
3 2706 5 24 61 45 34 158 327 2253
8 432 1 2 5 3 3 6 19 403
20 488 2 2 33 20 7 17 81 355
21 10716 34 83 542 628 128 579 1995 8688
Rest 49612 290 391 2178 3000 797 3687 10341 37552
Total 63953 332 501 2819 3695 969 4446 12763 49250
Brazil
5 6889 142 7 369 228 154 146 1048 6334
8 5844 147 6 302 194 129 123 902 5378
18 19804 949 32 1254 1995 927 999 6157 17829
20 7090 233 9 546 335 185 265 1573 6645
24 5013 182 8 220 299 162 228 1099 4631
26 1610 62 3 142 111 60 90 469 1471
35 8491 830 15 467 737 395 340 2784 6980
Rest 121470 5294 513 8965 10236 5391 13481 43880 100689
Total 176209 7840 592 12266 14135 7404 15673 57910 149957
Chart B1 (conclusion)
COUNTRIES AND SECTORS DIRECT REQUIREMENTS OF SERVICES/GROSS OUTPUT BY BIG SECTORS (2007)
45
Countries Commodity Exports
Services domestic value-added content VA contents of selected services
Total VA contents
I II III IV V VI
Uruguay
19 901 11 10 33 25 48 14 143 771
Rest 5772 143 47 297 371 277 327 1461 3970
Total 6673 155 57 329 396 325 341 1604 4741
Chile
4 3014 14 7 163 96 25 231 535 2698
18 17285 791 36 402 552 129 1917 3827 14113
36 24820 486 62 763 770 256 2765 5103 19611
Rest 23980 389 78 1190 1827 559 2794 6837 16899
Total 69098 1681 183 2518 3245 969 7707 16302 53321
Peru
18 9685 206 28 81 200 314 816 1644 8377
Rest 19893 378 89 314 911 795 1549 4036 17943
Total 29577 584 117 396 1111 1109 2365 5680 26320
Colombia
8 2429 8 1 24 15 28 19 95 2276
Rest 29030 519 151 1280 1630 1463 1795 6838 24592
Total 31458 528 152 1304 1644 1491 1814 6933 26868
Source: Elaborated by the authors.
Chart B3
SHARE OF EACH ECONOMIC INFRASTRUCTURE SERVICE IN TOTAL DOMESTIC VALUE ADDED OF SERVICES (%)
Countries Sectors
Services domestic value-added
content in NRIG exports Intermediate use of services
I II III IV V VI
Argentina
3 1.6 7.3 18.7 13.8 10.4 48.2 100.0
8 3.2 8.1 25.3 16.4 17.3 29.7 100.0
20 1.9 2.8 41.3 24.2 8.3 21.4 100.0
21 1.7 4.2 27.2 31.5 6.4 29.0 100.0
Rest 2.8 3.8 21.1 29.0 7.7 35.6 100.0
Total 2.6 3.9 22.1 29.0 7.6 34.8 100.0
Chart B2 (conclusion)
ECONOMIC INFRASTRUCTURE SERVICES DOMESTIC VALUE-ADDED CONTENTS BY SELECTED SET OF NRIG IN SOUTH AMERICA
(millions of dollars, 2007)
46
Countries Sectors
Services domestic value-added
content in NRIG exports Intermediate use of services
I II III IV V VI
Brazil
5 13.6 0.7 35.2 21.8 14.7 13.9 100.0
8 16.3 0.7 33.5 21.5 14.3 13.7 100.0
18 15.4 0.5 20.4 32.4 15.1 16.2 100.0
20 14.8 0.6 34.7 21.3 11.8 16.8 100.0
24 16.5 0.7 20.0 27.2 14.8 20.7 100.0
26 13.3 0.6 30.3 23.7 12.8 19.3 100.0
35 29.8 0.5 16.8 26.5 14.2 12.2 100.0
Rest 12.1 1.2 20.4 23.3 12.3 30.7 100.0
Total 13.5 1.0 21.2 24.4 12.8 27.1 100.0
Uruguay
19 8.0 7.4 22.9 17.7 34.0 10.0 100.0
Rest 9.8 3.2 20.3 25.4 18.9 22.4 100.0
Total 9.6 3.6 20.5 24.7 20.3 21.3 100.0
Chile
4 2.6 1.4 30.5 17.9 4.6 43.1 100.0
18 20.7 0.9 10.5 14.4 3.4 50.1 100.0
36 9.5 1.2 14.9 15.1 5.0 54.2 100.0
Rest 5.7 1.1 17.4 26.7 8.2 40.9 100.0
Total 10.3 1.1 15.4 19.9 5.9 47.3 100.0
Peru
18 12.5 1.7 4.9 12.2 19.1 49.6 100.0
Rest 9.4 2.2 7.8 22.6 19.7 38.4 100.0
Total 10.3 2.1 7.0 19.6 19.5 41.6 100.0
Colombia
8 9.0 1.2 25.1 15.5 29.6 19.6 100.0
Rest 7.6 2.2 18.7 23.8 21.4 26.3 100.0
Total 7.6 2.2 18.8 23.7 21.5 26.2 100.0
Source: Elaborated by the authors.
Chart B3 (conclusion)