Economic Annals no 168, January 2006 - March 2006 121
* University of Zagreb, GRADUATE SCHOOL OF ECONOMICS AND BUSINESS
Ivo Druzic*, Tomislav Gel*
SWOT ANALYSIS & PRIVATISATION IN CROATIA
ABSTRACT: Legal framework for privati-sation in Croatia was based on two key laws: the Transformation Act of 1991, and the Privatisation Act of 1993, amended in 1996. Early start of privatization process in 1990s in Croatia was marked by the trans-formation of socially-owned companies into stock holding companies or limited lia-bility companies. The first step (1991-1993) of this process of almost 2700 compa-nies which entered privatization was their evaluation and transformation into private ownership entities. The second step (1994-1997) consisted of privatization of CPF portfolio. The portfolios change constantly, not only as a result of privatization but also because companies themselves change, as does their position in the market. The third step (1998) in the privatization process was voucher privatization. Privatisation of large infrastructure and utility companies designated as public enterprises began in 1999 (CroatianTelecom) and INA in 2002 (public enterprises are privatised on the basis of separate laws).
Attempts to discuss privatization in Croatia in terms of SWOT analysis have been motivated by the stark difference among Croatian professional economists in an appraisal of Croatia's performance dur-ing the transition process in general and of the privatization process in particular. Therefore we considered the elements of SWOT analysis to be an acceptable way to
delve into the confusing world of bickering arguments on the state and perspective of the Croatia's privatization process. In this paper we have tried to provide an impartial approach by employing two criteria i.e. strength and weaknesses in judging the events and results of the privatization process in Croatia.
Strength of the overall privatization process can be mostly ascribed to the institutional swiftness on micro as well as on macro level. On the micro level 80% of the compa-nies were formally privatized in the first two years despite unfavorable external con-ditions comprising the economic conse-quences of war. On the macro level it took approximately three years to restructure and downsize CPF majority ownership in 2700 companies to majority ownership in just 70 companies.
Overall weakness of the restructuring process is concentrated in a painfully slow emergence of sound business activity in market environment.
1. INTRODUCTION
The starting point of the process of restructuring naturally lies in (re)privati-zation. The belief that privatization was the key to the success of the process of transition resulted, on the one hand, in the failure of numerous reforms in the 1960s, 1970s and 1980s in former socialist countries. The cause of this failure lay in the lack of the key ingredient of market restructuring – transparent ownership relationships. On the other hand, international financial institutions made reso-lute privatization the condition for allowing the inflow of foreign investment in-to transitional economies. Since foreign investments were considered significant in stimulating the economic activities of planned economies exhausted by stag-nation, these were an additional motive for faster privatization (Druzic, 1998, 116).
2. PRIVATISATION – THREE STEPS
Early start of privatization process in 1990 in Croatia was marked by tran-sformation of socially-owned companies into stock holding companies or limi-ted liability companies.
2.1 FIRST STEP
The first step (1991-1993) of this process of almost 2700 companies which entered privatization was their evaluation. The aim was to establish the value of companies’ capital. Part of the capital was debt which creditors tended to convert into equity, and this portion of capital was not included in further sales. The sa-me applied for governsa-ment bonds allocated to certain companies through banks. The value of these bonds was transferred into ownership claims by the CPF. The remaining capital was subject to privatization. There were several possible mo-dels of transformation with distinction between privileged and non-privileged buyers.
Privileged buyers were the employees, former employees and the govern-ment itself:
Ekonomski anali br 168, januar 2006. - mart 2006.
122
claims, and the tunneling of constant capi-tal through “soft” loans into tax havens outside the country.
Therefore, the solution is not to deal with the consequences, which are evident in
Employees and former employees buy-out included substantial privilege shares discount for the first half of the estimated value of the company, and pri-vilege buy-out of the second half of the company value at auctionary price.
Government privileged position was residual to the extent. After the debts were accounted, and after a part of capital was set aside for former owners whose property was nationalized, the rest belonged to general government. Shares not bought by employees and former (retired) employees, and shares not put aside for former owners, entered CPF (Croatian Privatization Fund) and Pension funds portfolio in 70 : 30 proportion.
Non-privileged buyers, were Croatian citizens, Croatian and foreign legal en-tities who could purchase shares or stakes of companies sold on the market (in-dividual contracts, tenders, auctions, stock exchange) in several modes; purchase of the company or its shares from CPF, or from its employees, purchase of com-pany shares from CPF at discount under installment plan, capital investment, purchase of company shares from pension funds (Barbic, 1994: 10).
Results of first privatization stepare entitled to micro (institutional) and mac-ro (financial) estimate.
Strengthsof the first privatization step are mostly ascribed to micro level. In-stitutional transformation was swift. In first two years, 80% of the companies were formally privatized in spite of unfavorable external conditions comprising
Economic Annals no 168, January 2006 - March 2006
123 Table 1: Total number of companies privatized through the CPF
Source:CPF
1. Capital after evaluation 14.407.457.867,50 2. Dept converted into equity 889.883.048,17
3. Bonds 148.619.986,17
4. Social capital 13.368.954.833,17 5. Recapitalization 125.079.239,50 6. Set-asides pending final settlement 598.432.761,83 7. Capital subject of privatization 12.645.442.831,83 8. Contracted sale of shares 1st round 45,49% 5.752.728.611,67 small shareholders 5.557.722.6 50,83 public tenders 195.005.960,83
9. Repaid 1.489.428.903,50
economic consequences of war. Of the estimated EUR 15bln of social capital af-ter valuation, some 30% or EUR 5bln remained in CPF portfolio for the second phase of privatization. Small shareholders purchased approx. 40% or EUR 6bln (see Table 1.).
The weaknessesof the first privatization step are imputed to macro level. Fi-nancial-macro effects of the first step were rather modest. Actually paid shares did not exceed 2% of capital in privatization i.e. EUR 300mln (Druzic, 1998:125). This gave rise to various criticisms of privatization process. On the doctrinaire level the adopted model was disputed as ineffective and unjust. Ac-cording to some assertions instead of directly transferring social ownership to private, employed model led to unnecessary costs due to mediating role o the go-vernment (Teodorovic/Vlasic, 1996: 637). By Gogo-vernment’s decisive role in the privatization process entrepreneurship incentives were swaped for political affili-ation criteria resulting in rent-seeking activity. According to this assertion inef-fective privatization model with the excessive role of government was the main cause of economic depression, pauperization and unjustified increasing inequa-lity in income distribution (Vojnic, 1999: 209).
2.2. SECOND STEP
The second step (1994-1997) consists of privatization of CPF portfolio. The portfolios change constantly, not only as a result of privatization but also becau-se companies thembecau-selves change, as does their position on the market. First part of this second step could be named “real” privatization consisting of contracted sales from portfolio amounted to EUR 400 mln or roughly 8% of CPF portfolio available for privatization. Contracted sales should be distinct from actual mo-ney inflows to CPF. The second partconsists of shares transfer. Transfers encom-passes shares granted to disabled war veterans and families of deceased soldiers (EUR 250 mln), shares transferred to companies undergoing rehabilitation ac-cording to government decision or pursuant the Law on rehabilitation (EUR 1 bln), shares used to off-set health insurance (EUR 10 mln) and pension funds (EUR 500mln) debts, and shares used for financing after-war reconstruction (EUR 300mln). Total value of all shares transferred was approx. EUR 2,1bln or 40% of CPF portfolio. (see Table 2).
Ekonomski anali br 168, januar 2006. - mart 2006.
Table 2:Privatization of the CPF portfolio
Source:CPF
Results of the second step are subjected to acrimonious discussion even to the larger extent than the first phase.
Strengthof the second step can be appraised by changes in CPF portfolio. At the end of second step CPF had majority ownership just in 70 out of almost 2700 companies that passed through its portfolio. In 1281 companies CPF had mino-rity portfolio and in over 1000 companies CPF had no shares at all. With the transfer of all shares required by voucher privatization in 1998. CPF portfolio comprehend only 4,4% of total capital in transformation (CPF 1999: 15). That was an immediate cause for government officials to proclaim successful ending of privatization process. The remaining public enterprises which were not part of CPF portfolio will be privatized pursuant to government decisions.
Weaknessesof the second step are both in the course and in the results of changes in the CPF portfolio structure. “Insignificant” number of 70 companies in CPA’s majority ownership “hides” the fact that these 70 companies accounted for 35% of total capital in transformation. Financial effects of the second step are very modest. First of all the data on nominal value of the portfolio sold in both
Economic Annals no 168, January 2006 - March 2006
125
1. The value of the CPF portfolio 4.892.952.445,33 2. Increase of the portfolio as a result of breach of
annulment of contracts 630.717.518,17 3. Total value of the CPF portfolio available for
privatization 5.523.669.963,50 4. Sold from the portfolio 417.762.936,83 5. Shares transferred from CPF portfolio 2.096.081.0 60,00 to the Croation Patriotic Fund 5.940.000,00 to the Pension fund for private entrepreneurs 303.538.666,67 to the Pension fund for workers 165.572.312,33 for financing rehabilitation of companies 1.068.7 61.930,00 for financing reconstruction pursuant to Government
decision
347.363.944,67
grants to disabled war veterans and families of deceased
soldiers 193.697.789,67
transfers to health insurance fund to cover liabilities 11.206.416,67 6. Part of portfolio consisting of companies in bankruptcy
procedure 245.462.007,67
7. Estimated decrease of portfolio after necessary
phases could be confusing when compared financial inflows to the CPF. During the 7 year period of privatization (1992-1998) total CPF proceeds from all modes of (re)payment (frozen foreign currency deposits, cash, government bonds) hardly reach EUR 2bln or 15% of the EUR 13bln worth of capital subjected to privatization. Cash proceeds were approx. EUR 800bln or roughly 6% of total ca-pital subjected to privatization. Other modes of repayment (bonds, frozen fore-ign currency deposits) accounted for another EUR 1,2bln or roughly 9%. Since the swiftness of cash collection needed for investments in modernization and de-velopment was the justification for hastily implemented privatization model, the developments in actual proceeds could seriously controvert promulgated priva-tization success. Far more meaningful were objections not only to the course but to the essence of the model itself. It is asserted that actual privatization was not result of standard business activity but of political and financial monopolies which enables favoritism, soft loans and so called tycoonizaton of the Croatian economy. That could even lead towards nepotism and organized crime activity (Veselica, 1998: 26). Therefore it comes as no surprise when the voices reque-sting revision and/or annulment of executed privatization and proposing new more efficient and impartial one are getting louder and louder.
2.3. THIRD STEP
Third step (1998) in privatization process was voucher privatization. Nomi-nal value of portfolio subjected to this model of privatization was approx. EUR 2bln. that was put aside in CPF portfolio during the previous privatization step.
Voucher privatization was non-linear i.e. it was aimed at those categories of population that suffered the worst consequences of the Patriotic war (families of deceased, imprisoned or missing Croatian soldiers, military and civil war inva-lids, displaced persons etc.).
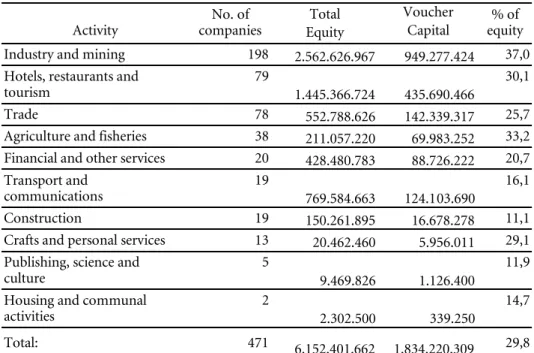
Approximately 230 thousand people participated in privatization when vo-uchers were given to war veterans, refugees and others. The majority of vovo-uchers used for purchase of 471 companies which composition is shown in the next ta-ble.
Ekonomski anali br 168, januar 2006. - mart 2006.
Table 3: Structure of voucher privatisation companies
Source: Revision Report, Privatization of CPF portfolio, The State Audit Office, 2004
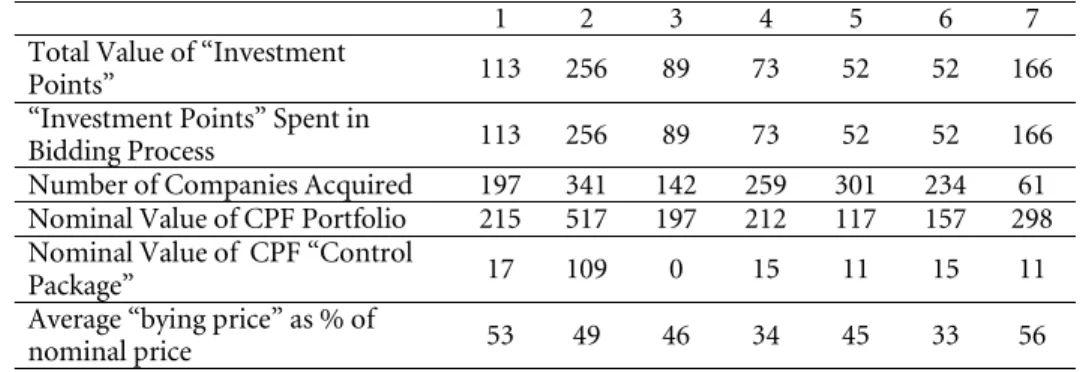
Mediators between CPF and persons entitled to vouchers were 7 PIFs (Priva-tization Investment Funds), established mostly by commercial banks, as a special version of Investment Funds. PIFs are closed funds as they are allowed to invest vouchers just in the part of CPF portfolio earmarked for mass privatization. They are also functioning as “restructuring holdings” meaning that they are entitled to voting and managing rights in the companies whose shares were bought in ex-change for vouchers. This step was effected in three bidding rounds between the “Snow-white” (the CPF) and “7 dwarfs” (PIFs) and pronounced a huge success as 99% of shares offered by the CPF were bided for by PIFs.
The only peculiarity being that average actual - purchase price of offered
sha-res was around 40% of nominal value (see Table 4). Economic Annals no 168, January 2006 - March 2006 127
Activity companies No. of Equity Total
Voucher
Capital equity % of Industry and mining 198 2.562.626.967 949.277.424 37,0 Hotels, restaurants and
tourism 79 1.445.366.724 435.690.466 30,1 Trade 78 552.788.626 142.339.317 25,7 Agriculture and fisheries 38 211.057.220 69.983.252 33,2 Financial and other services 20 428.480.783 88.726.222 20,7 Transport and
communications 19 769.584.663 124.103.690
16,1
Construction 19 150.261.895 16.678.278 11,1 Crafts and personal services 13 20.462.460 5.956.011 29,1 Publishing, science and
culture 5 9.469.826 1.126.400 11,9 Housing and communal
activities 2 2.302.500 339.250
14,7
Table 4:Comparative overview of pifs bidding activity
mln EUR
Source: “Trends” pp. 20, CPF 1999. 1 – Središnji nacionalni fond d.d. Zagreb
2 – Dom fond obiteljskog i poslovnog ulaganja d.d. Zagreb 3 – Privatizacijski investicijski fond „Velebit“ d.d. Zagreb 4 – Slavonski privatizacijski investicijski fond d.d. Osijek 5 – Privatizacijski investicijski fond Pleter d.d. Vara din 6 - Privatizacijski investicijski fond Sunce d.o.o. Zagreb 7 - Expandia fond - privatizacijski investicijski fond. d.d. Zagreb
Strengthof the third step is well organized and prompt distribution of vouc-hers to approximately 230 thousand people participated in privatization( famili-es of deceased, imprisoned or missing Croatian soldiers, military and civil war invalids, displaced persons etc.). It is also the first stage in establishing financial market in Croatia. Voucher privatization process went very well. According to Low about privatization investment funds it was founded 7 investment funds, with a qualitative organization. 471 companies participated in voucher privatiza-tion and value of aucprivatiza-tioned shares were EUR 1,7 billion.
Weaknessesof the third step are:
About 105 companies bankrupted from 1992 to 2001. Before bankruptcy their equity was about EUR 950 million and after EUR 860 million, less about EUR 80 million.
PIFs were buying shares at the markets from families of deceased, impriso-ned or missing Croatian soldiers, military and civil war invalids, displaced per-sons for about 5 to 10 per cent of nominal equity value.
One should bear in mind that war has provided several reasons why many small shareholders considered these heavily discounted share sales as an oppor-tunity and not as a plunder of their assets. There was uncertainty about real
mar-Ekonomski anali br 168, januar 2006. - mart 2006.
128
1 2 3 4 5 6 7 Total Value of “Investment
Points” 113 256 89 73 52 52 166 “Investment Points” Spent in
Bidding Process 113 256 89 73 52 52 166 Number of Companies Acquired 197 341 142 259 301 234 61 Nominal Value of CPF Portfolio 215 517 197 212 117 157 298 Nominal Value of CPF “Control
Package” 17 109 0 15 11 15 11 Average “bying price” as % of
ket value of assets. Next was uncertainty about number of companies earmarked for bankruptcy. Finally there was lack of proper financial market institutions and capital shortage in situation of economic downturn.
Trade on financial market almost exclusively consisted of share swaps. Discrepancy between intended and actual flows in voucher privatization co-uld be partly observed in following estimates (Table 5.)
Table 5: Voucher privatisation and exchanege of shares
Million EUR
Because of bankruptcy of 105 companies, 7 Privatization Investment Funds returned their shares to the Croatian Privatization Fund in exchange for (profi-table) shares from CPF portfolio. Every of 7 PIFs made a contract with CPF in the period from 1998 to 2000 for shares compensation in voucher privatization process. Proportions between shares were 1:1.
All 7 PIFs return about EUR 375 million more valuable shares according CPF data but 377 million according PIFs data. But the main problem is in the com-pensated shares. According to CPF data they gave to 7 PIFs about EUR 227 milli-on but according to PIFs data they got milli-only about 170 millimilli-on worth shares. Dif-ference is about EUR 23 million. All 7 PIFs were not rightfully participated in that process. Some of PIFs got a more valuable share then others.
PIFs management, according to some estimates, became owner of about 50 percent of PIFs shares paying EUR 45 to 85 million for the nominal value. PIFs
Economic Annals no 168, January 2006 - March 2006
129
Nominal value of portfolio subjected to voucher privatization 1,700
Value of shares of bankrupted companies in vouchers privatisations 860
Estimation of proportion of families of deceased, imprisoned or missing
Croatian soldiers, military and c ivil war invalids, displaced persons (2004) 50% Estimation of proportion of other shareholders (PIFs management and
others) (2004) 50%
Market value of PIFs portfolio as a part of nominal value after voucher
privatization on financial market (Varazdin Sto ck Exchange) (1999-2002) 5-10% Market value of shares on financial market bought by PIFs management
for 5 to 10 per cent of nominal value 42-85 Nominal and market value - difference 765-808 Exchanged shares between PIFs (bankrupted companies) and CPF
(profitable companies). Nominal values of CPFs shares were much higher
management and connected privileged clients supposedly earned between EUR 700 to 800 million on transactions concerning shares swaps.
3. SLOWNESS OF PRIVATIZATION PROCESS AFTER 2000
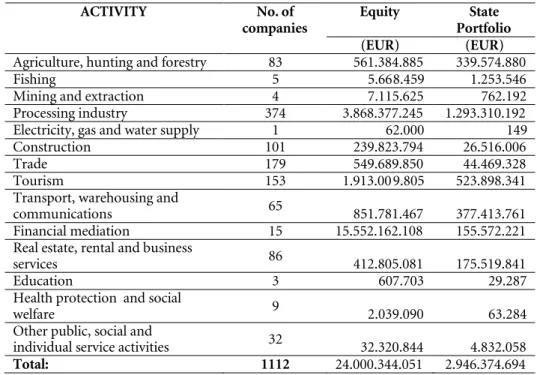
It is necessary to accelerate privatization process. As can be seen the Croatian Privatization Funds portfolio is comprised of shares and stakes in a total of 1,112 companies. The equity base of these companies is EUR 24 billion, while the equ-ity of the Governments portfolio amounts to EUR 3 billion. The table below de-picts the structure of the CPF portfolio (Table 6)
Table 6: Enterprise portfolio of CHP
Source:CPF, 1st November, 2005.
Table shows that the Government has most shareholder interests - in terms of both company numbers and equity - in the processing industry, but the Go-vernment also has significant holdings in the trade, tourism, agriculture and transport and communications sectors.
Ekonomski anali br 168, januar 2006. - mart 2006.
130
Equity State Portfolio ACTIVITY No. of
companies
(EUR) (EUR)
Agriculture, hunting and forestry 83 561.384.885 339.574.880
Fishing 5 5.668.459 1.253.546
Mining and extraction 4 7.115.625 762.192 Processing industry 374 3.868.377.245 1.293.310.192 Electricity, gas and water supply 1 62.000 149 Construction 101 239.823.794 26.516.006 Trade 179 549.689.850 44.469.328 Tourism 153 1.913.009.805 523.898.341 Transport, warehousing and
communications 65 851.781.467 377.413.761 Financial mediation 15 15.552.162.108 155.572.221 Real estate, rental and business
services 86 412.805.081 175.519.841
Education 3 607.703 29.287
Health protection and social
welfare 9 2.039.090 63.284
Other public, social and
individual service activities 32 32.320.844 4.832.058
Legislation on Foreign Direct Investment aimed at revising the flawed priva-tization process was passed in 2000. Many see this law as weak and ineffective, but there have been some notable privatization successes. The largest foreign in-vestment in 2001 again occurred in the Telecommunications sector – privatizati-on of natiprivatizati-onal telecom company (Croatian Telecom). The majority owner of Croatian Telecom Inc. is Deutsche Telekom, which owns 51% of shares. 42% of HT shares are owned by the Republic of Croatia, while Croatian War Veterans’ Fund has 7% of HT shares.
The privatization process is continuing and 25% of INA (Oil and Gas explo-ration, distribution and retailer) was sold in 2003 to Hungarian MOL. Following this, another 7% will be transferred without payment to veterans of the Home-land War and up to a further 7% to INA employees, on preferential terms to be determined. A sufficient number of shares will be retained to compensate former owners. Subsequently, it is intended that at least 15% of the shares will be sold through an Initial Public Offering or private placement. The ultimate sharehol-der structure of the company has yet to be decided, but the Government will re-tain at least 25% plus one share until Croatia’s accession to the EU. In all events the Government will retain a Golden Share.
4. MACROECONOMIC IMPACT OF THE PRIVATIZATION PROCESS
Macroeconomic impact could be partly measured through financial flows of privatizations process, because majority of sales have ended as state budget reve-nue.
Overall result of Croatian Privatization Fond activity through public tenders and public auction for the period from 1992 to 2003 are displayed on the next fi-gure (all values are in EUR).
Economic Annals no 168, January 2006 - March 2006
Figure 1:Total result of privatization process of the CPF
Source: Revision Report, Voucher privatization process in Croatia, The State Audit Office, 2004
As it is shown the best result of CPF privatization process were in the period from 1993 to 1995 and the most unsuccessfully period was from 1998 to 2000.
According to CPF data at the end of 2003, transformation of 2911 companies have finished. Estimated capital value of transformed companies was EUR 14 bil-lion. Share of CPF portfolio was about EUR 5,5 billion and it is about 40 per cent of estimated values. CPF portfolio now is about EUR 3 billion.
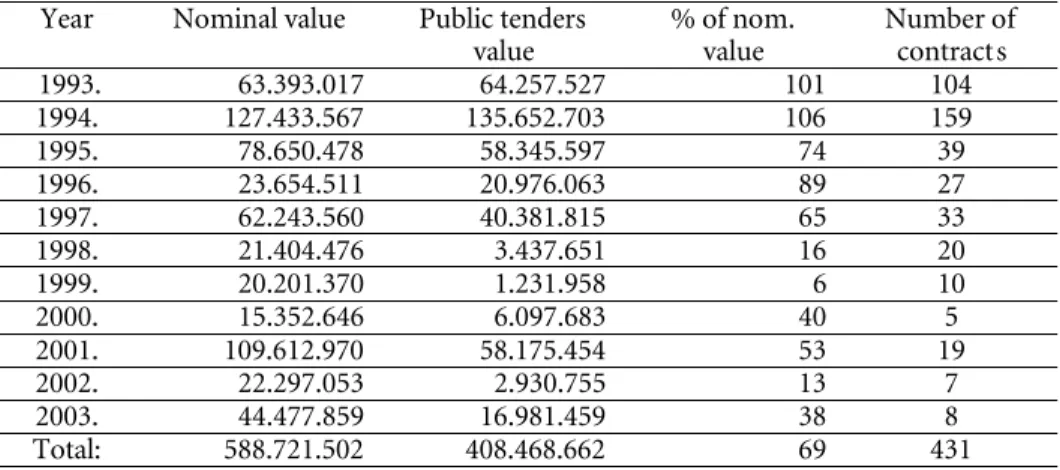
Nominal share’s value, public tender’s value, percentage of nominal values and number of contracts per years is displayed in the Revision Report on the vo-ucher privatization process in Croatia (Table 7).
Ekonomski anali br 168, januar 2006. - mart 2006.
Table 7:CPF public tenders per years
(EUR)
Source: Revision Report, Voucher privatization process in Croatia, The State Audit Office, 2004
Strengthof the overall privatization process from the macroeconomic stand-point lies primarily in forming of financial markets and institutions.
The Croatian Privatization Fund utilizes two methods of privatization: Pu-blic Tenders (in which it holds a significant ownership stake or those involved in strategic industries through) and Public Auctions (in which it holds minority stakes through public auction on the Zagreb Stock Exchange and Varazdin Stock Exchange).
These methods of privatization were employed after the process of initial mass privatization from 1991 to the end 1992 was finished.
From 1993 to 2003 the Croatian Privatization Fund sold shares of 421 com-panies through public tenders. Total nominal value of sold shares for analyzed period was EUR 588 million but public tenders value was only EUR 408 million, about 70 per cent of nominal value. CPF sold maximum shares 1994 and the mi-nimum 2002.
Total nominal value of sold shares through CPF public tenders from 1993 to 2003 was EUR 445 million distributed in 365 contracts. At the same time 99 con-tracts were annulled because of non payment. The nominal value of annulled contracts was EUR 145 million i.e. 25 per cent of total nominal values.
In companies with government minority ownership (less than 25 per cent), shares were sold through public auction on the Zagreb Stock Exchange from 1992 to 2003 and Varazdin Stock Exchange for the period from 2000 to 2003.
Economic Annals no 168, January 2006 - March 2006
133
Year Nominal value Public tenders value
% of nom. value
Number of contracts 1993. 63.393.017 64.257.527 101 104
Nominal share’s value, public auction’s value, percentage of nominal value and number of companies from 1992 to 2003 are shown in the following table (Table 8).
Table 8:Public auction on the Zagreb and Varazdin stock exchange per years EUR
Source:Revision Report, Voucher privatization process in Croatia, The State Audit Office, 2004
Through public auction on the Zagreb Stock Exchange (from 1992 to 2003) and Varazdin Stock Exchange (from 2000 to 2003) the Croatian Privatization Fund had sold shares of 1689 companies. Total nominal value of shares sold for analyzed period was EUR 678 million but public auction value was only EUR 336 million about 50 per cent of nominal value. Maximum value of sold shares has been achieved 1994 and the minimum value of sold shares has been attained in 1998 and 1999.
Shares of 788 companies were sold on the Zagreb Stock Exchange in the peri-od from 1992 to 2003. Nominal value of sold shares for analyzed periperi-od was EUR 341 million but public auction value was EUR 240 million, about 70 per cent of nominal value.
Shares of 901 companies were sold on the Varazdin Stock Exchange in the period from 2000 to 2003. Nominal value was EUR 340 million but public aucti-on value was EUR 96 milliaucti-on, about 29 per cent of nominal value.
Ekonomski anali br 168, januar 2006. - mart 2006.
134
Year Nominal value Public auction
value % of nominal value Number of company 1992. 1.505.158 1.505.158 100 4 1993. 6.332.777 8.172.287 129 23 1994. 171.348.573 173.223.623 101 94 1995. 29.284.930 30.739.090 105 61 1996. 12.929.095 11.609.608 90 54 1997. 7.115.366 7.035.481 99 20
1998. 453.892 297.753 66 47
1999. 200.777 208.996 104 20
Weaknessof the overall privatization process is precisely summarized in the State Audit office findings. The most important findings are:
- equity of revised companies before privatization process was about EUR 12,25 billion but after privatization it was about EUR 10,5 billion, 16 per cent less.
- number of employees in revised companies before privatization was about 635 thousands and after privatization process it was about 248 thousands, 60 per cent less.
- only 15 percent of 1556 companies realized development goals, 20 per cent realized some of defined goals and 64 per cent companies did not realized their development goals.
- 1936 anomalies have been documented in the privatization process of 1556 companies but most of them (1215) are not under sanction by a penalty accor-ding to Privatization Law.
- no criminal charges were filled against individuals and / or institutions.
5. SUMMARY OF PRIVATISATION PROCESS
The applied Croatian economy privatization model was a combination of different variants. In the first stage, this meant selling social/state property to pri-vileged buyers (former and actual employees) at discounted prices and to unpri-vileged buyers at full market prices. In the second stage, so-called voucher priva-tization was introduced. It consisted of the free of charge distribution of shares to particular social groups such as war veterans, disabled and displaced persons and refugees. The actual privatization process outcome has allowed the notion that the appropriated privatization model has been perceived as socially unacceptable and economically inefficient.
It is well enough known that social acceptability of any measure or law lies in its willful adoption by a majority of a certain social group or society as a whole. The Croatian privatization model, which has been almost exclusively reduced to the redistribution of existing common social property and its concentration in the hands of clientelistic elite, has never been accepted either by the working po-pulation or by the general public. Dissatisfaction has been projected far beyond the usual aberrations and any particular unlawful privatization case. Indeed, di-scontent has embraced the privatization model itself. The public has considered the imposition of the privatization model as deeply iniquitous. It has enabled ca-pital (ownership) which was, in fact, the past (invested) labor of present and former generations, to be passed into the hands of self-elected elite by the no eco-nomic criteria of political affiliation.
Economic Annals no 168, January 2006 - March 2006
The economic inefficiency of the model was reflected in the substitution of desired modern venture capitalism by obsolete rent-seeking capitalism, which was characteristic of early capitalism in its transition from feudal to an industrial environment two centuries ago. The main feature of the model was not efficiency and development. It strictly focused on squeezing liquid capital from enterprises by blown up debts, falsified stocks and forged credits. Especially popular was as-sets tunneling into tax oases outside the country by “soft” loans using already in-debted or non-existent property as collateral.
Therefore, the solution is not to deal with the consequences, which are evi-dent in various affairs that are treated as individual deviations of the more or less good model of privatization. The problem lies in the model itself. It is necessary to convert rent seeking capitalism into managerial capitalism which, in modern societies, relies on widespread small-scale ownership of shares.
Ekonomski anali br 168, januar 2006. - mart 2006.
136
Annual Report (2005), Croatian Privatisation Funds.
Barbic, J.et.al. (1994) “Investment in Croatia” Ma-smedia, Zagreb
Čengić, D., (1999) Menađeri i indtitucionlni vla-snici, Zagreb.
Croatian Privatization Fund (1999) “Privatization in the Republic of Croatia 1993-1998.
Druzic I.(1999) “Changing Macroeconomic Envi-ronment of Transitional Firms”Third Interna-tional Conference on Enterprise in Transiti-on, University of Split
Družić, I. et al. (2003), Hrvatski gospodarski razvoj, Ekonomski fakultet, Zagreb.
Petricic, Darko(2000) Kriminal u Hrvatskoj Pre-tvorbi: Tko, Kako, Zasto, Abak-us, Zagreb. Revision Report, Privatization of CPF portfolio,
The State Audit Office, 2004
Revision Report, Voucher privatization process in Croatia, The State Audit Office, 2002
Teodorovic, I., Vlasic, J. (1996) “Privatization Problems in the Process of Transition” (in Croatian) Ekonomski pregled vol. 47. No 11-12. pp. 624-627.
Teodorović, I.,(1996)”Privatizacija u zemljama u tranziciji i u Hrvatskoj”, Ekonomija/Econo-mics, No. 3/1996., pp513-522
Vojinć, D., (1991) “Pluralizacija vlasništva i razvi-janje modela tržišne privrede”, Ekonomski pregled, 3-4/1991., pp. 87-100.
Zakon o pretvorbi drustvenih poduzeca, Narodne novine 19/91, 1991.
Zakon o privatizaciji, Narodne novine, 21/91 Zakon o privatizacijskim investicjskim fondovima,
Narodne novine, 109/97
Zakon o reviziji pretvorbe i privatizacije, Narodne novine 44/16, 2001