SCIENTIFIC OUTPUT OF CROATIAN UNIVERSITIES:
COMPARISON WITH NEIGHBOURING COUNTRIES
Boris Podobnik1, * and Katica Biljaković2
1Faculty of Civil Engineering, University of Rijeka
Rijeka, Croatia, and
Zagreb School of Economics and Management Zagreb, Croatia
2Institute of Physics,
Zagreb, Croatia
Regular article Received: 29. August 2006. Accepted: 16. January 2008.
ABSTRACT
We compared the Croatian research output with the neighboring countries and the Croatian universities with the largest Slovenian, Hungarian, and Serbian universities. As far as papers listed by Social Science Citation Index are concerned, since 2000 the University of Zagreb exhibits best results in social sciences compared to the competing universities, that is not the case in “hard” sciences. For the last 12 years, only the University of Ljubljana has shown better results in total research output than the University of Zagreb. The difference in research output between the University of Zagreb and the rest of the Croatian universities has been constantly decreasing. As a case study we compare research output at Faculty of Civil Engeenering on different Croatian universities. By analyzing European countries, we show a functional dependence between the gross domestic product (GDP) and the research output. From this fit we conclude that the Croatian science exhibits research output as expected for the given level of GDP.
KEY WORDS
scientific production, universities, SCI-E, SSCI, A&HCI
CLASSIFICATION
INTRODUCTION
Various analyses of scientific output have been performed in order to identify research excellence among universities and scientific institutions. In 2003, the academic ranking made by the Shangai Jiao Tong University yielded a list of the 500 most prestigious universities [1]. Several criteria of educational or research performance were used, including alumni and staff winning Nobel Prizes, highly cited researchers, papers published in highly ranked journals Nature and Science, papers listed in Science Citation Index – Expanded and per capita academic performance of an institution. In the 2003 ranking, there were no universities from Croatia, but there were some universities from South East Europe, namely, two Hungarian, the University of Szeged and the Eötvös Loránd University, and one Slovenian, the University of Ljubljana [1]. According to the 2005 ranking by the same University, both Hungarian universities maintained their positions among the best 500 universities, however the University of Ljubljana was not listed.
A few studies on the general productivity and citations of Croatian scientists have been published based both on national database and ISI databases [2-6]. These studies have revealed that the overall productivity of Croatian scientists were beyond the average productivity in the world. Also, it has been shown that the productivity of Croatian scientists in “soft” sciences was well below the productivity of their colleagues working in “hard” sciences [2]. By “hard” sciences we generally mean those sciences predominantly related to journals listed by the Science Citation Index - Expanded (SCI), while by “soft” sciences we mean all sciences related to journals listed by either the Social Science Citation Index (SSCI) or Arts & Humanities Citation Index (A&HCI).
METHODS
Motivated by the academic ranking performed on yearly basis by the Shangai Jiao Tong University where the University of Zagreb is constantly missing, in the paper we compare the research output of the University of Zagreb with the research output of the universities which were on the ranking list in 2003, namely, the University of Ljubljana, the University of Szeged, and the Eötvös Loránd University (Budapest). We also present the research output of the University of Belgrade, the University of Maribor, and the University of Trieste, as the closest Italian University. Two Hungarian and two Slovenian universities are chosen in order to assess whether the scientific policies in those countries go towards centralization or decentralization. In searching for the papers, we use the WoS (Web of Science), where journals are ascribed the Science Citation Index-Expanded (SCI), the Social Science Citation Index (SSCI), or Arts & Humanities Citation Index (A&HCI) depending whether they publish papers related to natural, biomedicine and technical discipline (SCI), sociology and economics (SSCI), or art and humanistic discipline (A&HCI).
RESULTS
Recently, Jokić et al published a paper where, for the period 1996-2004, the authors analyzed the research output of Croatian scientists working in “hard” sciences [6]. Motivated by their result we raise the question whether Croatian science grows towards centralization or decentralization, how Croatian universities compare with those in the closest neighborhood, and how the Croatian science as the whole compares with the neighboring countries.
SCIENTIFIC OUTPUT OF CROATIAN UNIVERSITIES FROM 1994 TO 2005
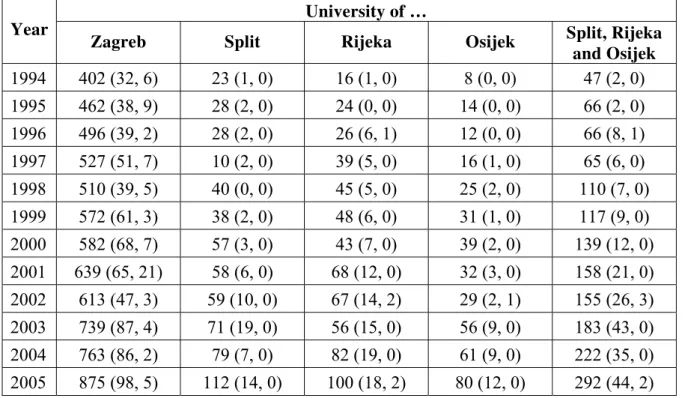
In order to find some tendencies, precisely whether the difference between the University of Zagreb and the rest of Croatian universities is increasing or decreasing in time, for both “hard” and “soft” sciences, in Table 1 we report the total number of papers published by scientists at four largest Croatian universities, where in brackets we put the number of papers published in social sciences (according to SSCI) and humaninistic sciences (according to A&HCI). From the results exposed, we find that for the period analyzed the University of Zagreb increased the number of papers something more than two times, while the University of Split, the University of Rijeka, and the University of Osijek increased their research output for approximately five, six and ten times, respectively. In Table 1 and more clearly in Fig. 1, we see that the relative difference between the University of Zagreb compared to the rest of the Croatian universities analyzed is gradually decreasing. While in 1994 the total number of papers with address of the University of Zagreb was more than eight times larger than the total number of papers published by any of the other three mayor regional Croatian universities, in 2005 the University of Zagreb had about three times more papers than all regional univeristies together.
Table 1. Scientific output for four largest Croatian universities. We put the total number of papers published in journals listed by SCI-Expanded, SSCI, and A&HCI (“hard” and “soft” sciences together). In brackets are shown the number of papers published in journals listed in SSCI and A&HCI, respectively. The total number of papers with address of the University of Zagreb compared to the number of papers with the regional universities’ addresses is gradually decreasing.
University of … Year
Zagreb Split Rijeka Osijek Split, Rijeka
and Osijek 1994 402 (32, 6) 23 (1, 0) 16 (1, 0) 8 (0, 0) 47 (2, 0)
1995 462 (38, 9) 28 (2, 0) 24 (0, 0) 14 (0, 0) 66 (2, 0)
1996 496 (39, 2) 28 (2, 0) 26 (6, 1) 12 (0, 0) 66 (8, 1)
1997 527 (51, 7) 10 (2, 0) 39 (5, 0) 16 (1, 0) 65 (6, 0)
1998 510 (39, 5) 40 (0, 0) 45 (5, 0) 25 (2, 0) 110 (7, 0)
1999 572 (61, 3) 38 (2, 0) 48 (6, 0) 31 (1, 0) 117 (9, 0)
2000 582 (68, 7) 57 (3, 0) 43 (7, 0) 39 (2, 0) 139 (12, 0)
2001 639 (65, 21) 58 (6, 0) 68 (12, 0) 32 (3, 0) 158 (21, 0)
2002 613 (47, 3) 59 (10, 0) 67 (14, 2) 29 (2, 1) 155 (26, 3)
2003 739 (87, 4) 71 (19, 0) 56 (15, 0) 56 (9, 0) 183 (43, 0)
2004 763 (86, 2) 79 (7, 0) 82 (19, 0) 61 (9, 0) 222 (35, 0)
Figure 1. Ratio dened as reserach output of University of Zagreb vs. the rest of the Croatian universities varies from 8:1 to 3:1, with crossover after 1997. We show linear-log plot.
Table 1 shows that on average the difference between the University of Zagreb and the other Croatian universities has been decreasing in time if only “social” sciences are concerned (see the first numbers in the brackets). Table 1 reveals the crossover in the ratio of the research output between the University of Zagreb and all other regional universities in 1997, just after the Independence War taking place in Croatia till August of 1995. We find that from the total number of papers with address of the University of Zagreb approximately every ninth paper is published in “soft” sciences (results in brackets), where for the rest of Croatian universities, the percentage of papers published in “soft” sciences is even something higher. As a well-known result, from Table 1 is evident that the research output in “hard” sciences is much higher than in “soft” sciences. As a comparison Table 2 shows, for the year 2005, that even for the largest world universities the research output is much higher in “hard” sciences than in “soft” sciences.
Table 2. Scientific output for three famous world universities in the year 2005. We put the total number of papers listed by SCI-Expanded together with the number of papers published in journals listed in SSCI and A&HCI.
Harvard Cambridge Oxford 14569 (2328, 388) 7028 (1006, 817) 6628 (1008, 909)
COMPARISON WITH UNIVERSITIES IN NEIGHBORING COUNTRIES
Table 3. Scientific output of the University of Zagreb compared with two Hungarian, two Slovenian, one Italian and one Serbian university. Data for 2006 collected till 1 September.
Year Univ. of Zagreb Univ. of Szeged Eötvös Loránd Univ. Univ. of Ljubljana Univ. of Maribor Univ. of Trieste Univ. of Belgrade
1994 402 (32, 6) 350 468 59 443 320
1995 462 (38, 9) 436 543 100 519 358
1996 496 (39, 2) 25 472 550 106 588 439
1997 527 (51, 7) 25 472 654 106 588 417
1998 510 (39, 5) 43 484 640 129 620 543
1999 572 (61, 3) 53 534 776 112 679 465
2000 582 (68, 7) 227 (3, 0) 542 (12, 12) 892 (39, 11) 162 (7, 1) 733 (49, 9) 420 (21, 5) 2001 639 (65, 21) 500 (13, 9) 567 (30, 14) 891 (62, 9) 181 (15, 3) 758 (53, 23) 389 (15, 6) 2002 613 (47, 3) 578 (16, 8) 586 (26, 13) 911 (53, 13) 228 (13, 1) 771 (52, 9) 428 (20, 5) 2003 739 (87, 4) 635 (14, 4) 594 (29, 9) 1045 (57, 16) 276 (20, 1) 856 (69, 7) 485 (16, 1) 2004 763 (86, 2) 690 (16, 7) 609 (25, 10) 973 (41, 10) 273 (26, 1) 784 (37, 10) 595 (28, 3) 2005 875 (98, 5) 783 (26, 10) 718 (34, 10) 1306 (98, 13) 346 (29, 1) 951 (67, 13) 730 (28, 1)
2006 610 451 448 743 187 566 534
the University of Zagreb exhibits better results. We also find that for the period from 2000 to 2005 the University of Zagreb published more papers in social sciences than any other university reported in Table 3.
Combining the results reported in Table 1 and Table 3, we find that in Slovenia the ratio between the total number of papers with address of the University of Ljubljana and the number of papers of the University of Maribor is approximately equal to the equivalent ratio calculated for the University of Zagreb in comparison to the rest of the Croatian universities. We note that in opposite to Croatia and Slovenia where the largest university is in the capital, in Hungary decentralization in science is more highlighted and the university with the largest research output is not located in Budapest but in Szeged [see Table 3 and Ref. 1].
Table 4. Scientific output for Croatia and three neighboring countries.Data for 2006 collected till 1 September.
Year Croatia Slovenia Hungary Serbia &
Montenegr
1994 851 771 3308 850
1995 1060 917 3666 906
1996 1117 973 3755 1284
1997 1186 1182 4054 1081
1998 1211 1162 4630 1562
1999 1418 1385 4616 1344
2000 1412 1719 4856 1156
2001 1504 1745 5027 1222
2002 1407 1750 4796 1194
2003 1811 2045 5419 1456
2004 1793 1932 5279 1671
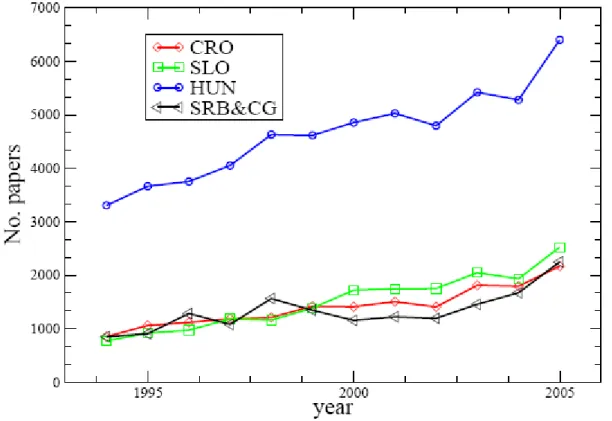
Now we raise the question how the total Croatian research output changes in time compared to the output of neighboring competing countries. From Table 4 and Fig. 2 we find that for the period of 12 years the total Croatian research output increased approximately 2,5 times, similarly as the Serbian research output. For the same period, Hungarian research output increased less than two times, while the Slovenian increased more than three times.
Note that Croatia, Slovenia and Serbia are similar countries as GDP is concerned. Approximately, Slovenia has two times larger GDP per capita than Croatia, but has two times smaller population. Similarly, Serbia has two times larger population than Croatia, but has two times smaller GDP per capita than Croatia. Note that the Croatian output according to Table 4 is currently higher than the Slovenian research output.
Figure 2. Scientific output of first neighbours.
RELATIONSHIP BETWEEN RESEARCH OUTPUT AND GDP
Globalization taking place worldwide after the fall of socialism in East Europe is followed by capital and industry transfer from developed countries to undeveloped countries mainly in East Europe and Asia. Due to competition, to maintain working places in developed countries, manufacturers in those countries have to constantly develop new technologies and create new products. Clearly, new technologies are closely related to science and education. For that reason, only countries with research output substantially larger than is expected for a given level of gross domestic product (GDP) have a nice perspective. Since research output is financed from the Government budget, clearly, the total research output must be related to the total money invested in research, where the latter is percentage of the GDP.
Figure 3. Log-log plot of total number of papers versus GDP calculated for European countries in 2004.
output is as expected for the Croatian level of GDP. Among countries exposed, Israel (well above the power-law curve) shows the best result with much more papers published than expected for a given level of GDP.
MAJOR UNIVERSITY VS. REGIONALS’: CASE OF CIVIL ENGINEERING
It is commonly believed that each faculty at the University of Zagreb has substantially larger research output than the corresponding faculty at any regional university. Here we choose the case of Faculty of Civil Engineering existing at each of four largest Croatian universities. In Table 5 for the period 1991-2005 we report their research output. Obviously, even with substantially smaller number of employees and projects, Faculties of Civil Engineering in Rijeka and Split are more productive than the corresponding Faculty at the University of Zagreb. Till 1 September 2006 we find 3 papers with Rijeka address, and one paper with Zagreb address.
Table 5.:Research output for the period 1991-2005 for four Faculties of Civil Engineering. In the parenthesis are shown number of teachers and teaching assistants. In the third row are given numbers of projects suported by the Croatian Ministry of Science, Education and Sport. In the last row we show the number of papers published which include the address of the Faculty.
Zagreb Rijeka Split Osijek
Teaching staff 68 (4, 37) 20 (11, 12) 36 (8, 26) 28 (14, 11)
No. of supported projects 30 5 18 9
No. of papers (1991-2005) with
CONCLUSIONS
In this paper we show that the relative difference between the major Croatian University and the rest of the Croatian universities has been gradually decreasing. This positive trend contributes to the decentralization of Croatian science. A good example of decentralization is Hungary, where the largest university is the University of Szeged, not the Eötvös Loránd University situated in Budapest. We hope the policy of decentralization in science will continue in years to come. The larger research output in regional universities may be easily achieved by increasing the number of scientists working in natural sciences, who are generally most productive.
The results obtained for the research output of universities in Table 3 should be put in correlation with the ranking of world’s universities where, for the last three years, the none of Croatian universities was among the 500 most prestigious world universities. Even though the University of Zagreb published more papers than the Eötvös Loránd University and the University of Szeged, for each of the last three years, the two Hungarian universities were placed on the list of 500 most prestigeous universities.
As a future work, in evaluation of performance of each Croatian university it would be highly desirable to put in correlation the research output with the number of projects and money invested in each university. This might help in choosing the best strategy that could bring Croatian largest universities to the level of the best 500 world universities.
REFERENCES
[1] -, Academic Ranking of World universities. http://ed.stju.edu.cn/ranking.htm,
[2] Klaic, B.: Analysis of scientific productivity in Croatia according to the Science Citation Index, the Social Science Citation Index, and Arts & Humanities Citation Index for the 1980-1995 period.
Croatian Medical Journal 38(2), 88-98, 1997,
[3] Jovicic, A, et al.: Science doctors in Croatia: Their productivity from 1991 to 1996. I. Nonproductive scientists. In Croatian.
Društvena istraživanja (Zagreb) 9(4), 513-527, 1999,
[4] Sorokin, B.; Jovicic, A; Ailadic, I. and Silobrcic, V.: Science doctors in Croatia: Their productivity from 1991 to 1998. II. Non-productive scientists. In Croatian.
Društvena istraživanja (Zagreb) 11(4-5), 751-760, 2002,
[5] Klaic Bencetic, Z. and Klaic, B.: Croatian scientific publications in top journals according to the Science Citation Index for the 1980-2000 period.
Scientometrics 61(2), 237-267, 2004,
[6] Jokić, M.; Stepanić, J.; Kamenar, N. and Silobrčić, V.: Research Output of Croatian universities from 1996 to 2004, registered by the Science citation Index-Expanded.
Interdisciplinary Description of Complex Systems 4(1), 44-50, 2006,
http://indecs.znanost.org/2006/indecs2006-pp44-50.html,
ZNANSTVENI REZULTATI HRVATSKIH SVEU
Č
ILIŠTA:
USPOREDBA SA SUSJEDNIM DRŽAVAMA
B. Podobnik1 i K. Biljaković2
1
Građevinski fakultet, Sveučilište u Rijeci, Rijeka, Hrvatska i
Zagrebačka škola ekonomije i managementa Zagreb, Hrvatska
2
Institut za fiziku Zagreb, Hrvatska
SAŽETAK
Usporedili smo znanstvenu produkciju u Hrvatskoj s onom od susjednih zemalja, te Hrvatska sveučilišta s najvećim sveučilištima Slovenije, Madžarske i Srbije. Vezano uz radvoe uključene u indeks SSCI, od 2000. goine Sveučilište u Zagrebu pokazuje najbolji rezultat u društvenim znanostima u usporedbi s uspoređivanim sveučilištima, što nije slučaj za tzv. „čvrste” znanosti. U zadnjih 12 godina, samo Sveučilište u Ljubljani je pokazalo bolje rezultate u ukupnoj znanstvenoj produkciji od Sveučilišta u Zagrebu. Razlika u znanstvenoj produkciji između Sveučilišta u Zagrebu i ostalih hrvatskih sveučilišta stalno se smanjuje. Izdvojili smo usporedbu znanstvene produkcije građevinskih fakulteta različitih sveučilišta u Hrvatskoj. Analizirajući države Europe, pokazujemo funkcionalnu ovisnost između bruto domaćeg proizvoda i znanstvene produkcije. Iz funkcionalne ovisnosti zaključili smo kako je znanstvena produkcija Hrvatske u skladu s očekivanim iznosom obzirom na ostvareni bruto domaći proizvod.
KLJUČNE RIJEČI