www.biogeosciences.net/12/1765/2015/ doi:10.5194/bg-12-1765-2015
© Author(s) 2015. CC Attribution 3.0 License.
Organic N and P in eutrophic fjord sediments – rates of
mineralization and consequences for internal nutrient loading
T. Valdemarsen1, C. O. Quintana1,2, M. R. Flindt1, and E. Kristensen1 1Institute of Biology, University of Southern Denmark, Odensee, Denmark 2Instituto Oceanográfico, Universidade de São Paulo, São Paulo, Brazil
Correspondence to:T. Valdemarsen ([email protected])
Received: 8 August 2014 – Published in Biogeosciences Discuss.: 27 October 2014 Revised: 24 February 2015 – Accepted: 1 March 2015 – Published: 18 March 2015
Abstract. Nutrient release from the sediments in shallow eutrophic estuaries may counteract reductions of the exter-nal nutrient load and prevent or prolong ecosystem recov-ery. The magnitude and temporal dynamics of this poten-tial source, termed internal nutrient loading, is poorly un-derstood. We quantified the internal nutrient loading driven by microbial mineralization of accumulated organic N (ON) and P (OP) in sediments from a shallow eutrophic estuary (Odense Fjord, Denmark). Sediments were collected from eight stations within the system and nutrient production and effluxes were measured over a period of ∼2 years. Dis-solved inorganic nitrogen (DIN) effluxes were high initially but quickly faded to low and stable levels after 50–200 days, whereas PO34−effluxes were highly variable in the different sediments. Mineralization patterns suggested that internal N loading would quickly (< 200 days) fade to insignificant lev-els, whereas internal PO34− loading could be sustained for extended time (years). When results from all stations were combined, internal N loading and P loading from the fjord bottom was up to 121×103kg N yr−1 (20 kg N ha−1 yr−1) and 22×103kg P yr−1(3.6 kg P ha−1yr−1)corresponding to 6 (N) and 36 % (P) of the external nutrient loading to the sys-tem. We conclude that the internal N loading resulting from degradation of accumulated ON is low in shallow eutrophic estuaries, whereas microbial mineralization of accumulated OP is a potential source of P. Overall it appears that, in N-limited eutrophic systems, internal nutrient resulting from mineralization of ON and OP in sediments is of minor im-portance.
1 Introduction
The nutrient loading of coastal ecosystems is often divided into internal and external sources, i.e., release from sedi-ments resulting from organic N (ON) and P (OP) mineral-ization, and natural and anthropogenic supplies via the wa-ter shed and atmospheric deposition, respectively. The ex-ternal nutrient loading can be quantified by summing up the external sources (e.g., Petersen et al., 2009). It is diffi-cult, however, to use a mass balance approach to obtain reli-able estimates of internal nutrient loading, since release from sediments and export to adjacent water bodies are difficult to quantify with sufficient temporal and spatial precision in large and dynamic estuaries with extensive spatial variability and open boundaries.
is dominated by the nutrients generated by labile ON and OP mineralization due to the short timescale applied for mea-surements. It is nonetheless important to obtain reliable es-timates of the nutrient generation and efflux resulting from mineralization of low-reactivity ON and OP. In many in-stances the recovery of eutrophic ecosystems after reductions of the external nutrient loading does not occur or only occurs after considerable delay (Kronvang et al., 2005). This may be caused by substantial release of nutrients which have accu-mulated to high concentrations over time in the sediments ex-posed to eutrophication (Pitkanen et al., 2001; Carstensen et al., 2006). Such delayed nutrient release is thought to coun-teract reductions in the external nutrient load and cause de-layed recovery.
Determining the magnitude and temporal dynamics of the internal nutrient loading originating from ON and OP accu-mulated in sediments requires detailed biogeochemical stud-ies. Organic matter degradation in sediments follow expo-nential decay kinetics (Westrich and Berner, 1984; Burdige, 1991; Valdemarsen et al., 2014), and inorganic nutrient pro-duction from ON and OP is therefore expected to decrease exponentially with time. Not all produced inorganic nutri-ents will result in internal nutrient loading, however, since chemical and biological processes within sediments lead to nutrient retention or transformation before efflux to the over-lying water. NH+4, for instance, can be adsorbed to the sed-iment matrix (Mackin and Aller, 1984), assimilated by mi-crobes or benthic microalgae, or microbially transformed to other nitrogenous compounds (Christensen et al., 2000; Tyler et al., 2003; Hulth et al., 2005). Coupled nitrification– denitrification in the oxic–anoxic transition of surface sed-iments, whereby NH+4 is converted to inert N2 gas, is for instance an ecologically important process which reduces the amount of bioavailable N (Seitzinger, 1988; Burgin and Hamilton, 2007). Due to adsorption and denitrification, the efflux of dissolved inorganic nitrogen (DIN=NH+
4+NO
−
3+ NO−2) is generally much lower than anticipated from to-tal ON mineralization in the sediment (Mackin and Swider, 1989). As for NH+4, PO34−may adsorb to the sediment ma-trix, mainly to Fe minerals in oxidized surface sediment (Sundby et al., 1992). PO34−efflux is therefore generally low in marine sediments lined with an oxic surface layer (Sundby et al., 1992; Jensen et al., 1995; Viktorsson et al., 2013).
In this study an experimental approach was used to deter-mine the internal nutrient loading resulting from long-term mineralization of accumulated ON and OP in various sed-iment types of a large shallow, eutrophic estuary (Odense Fjord, Denmark). The goals of the study were twofold: (1) to quantify the magnitude and temporal dynamics of internal nutrient loading resulting from mineralization of ON and OP accumulated in sediments and (2) to evaluate the role of inter-nal nutrient loading for the recovery of eutrophic ecosystems. Sediment cores were collected from various locations repre-senting the dominating sediment types and environments in
the estuary. These were maintained in experiments lasting
∼2 years, during which the mineralization of ON and OP and resulting effluxes of inorganic nutrients were measured with high spatial and temporal resolution. By comparing to-tal inorganic nutrient production to effluxes, the fate of in-organic nutrients was elucidated. The total internal nutrient loading of the entire system was estimated based on the mea-sured nutrient effluxes and the areal distribution of dominat-ing sediment types. Finally, the importance of internal nutri-ent loading in shallow eutrophic ecosystems is evaluated.
2 Materials and methods 2.1 Study area
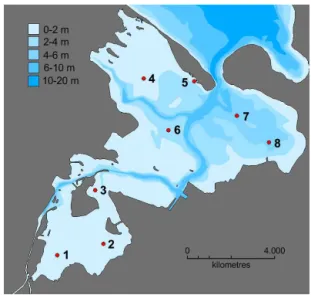
Odense Fjord is a shallow eutrophic estuary located on the island of Fyn, Denmark. It is divided into a 16 km2 shal-low inner basin and a 45 km2 deeper outer basin, with av-erage depths of 0.8 and 2.7 m, respectively (Fig. 1). The fjord is connected to Kattegat through a narrow opening in the northeast. The main external nutrient source to Odense Fjord is Odense River, which has a catchment area of 1095 km2, consisting mainly of farmland and urban areas (Petersen et al., 2009). Odense Fjord was critically eutrophic in the past due to high external nutrient loading exceeding 3000×103kg N yr−1 and 300×103kg P yr−1 before 1990 (Petersen et al., 2009). The massive nutrient loading caused extensive problems with high pelagic primary production, low water transparency, hypoxic events and blooms of op-portunistic macroalgae. Implementation of several water ac-tion plans has reduced the external nutrient loading consid-erably to current levels of about 2000×103kg N yr−1 and 60×103kg P yr−1. This has improved the ecological qual-ity of the system, since hypoxia is now rare and levels of opportunistic macroalgae have decreased. Nonetheless, ex-cessive nutrient levels and high primary production are still a problem in Odense Fjord, which may be due to high and sustaining internal nutrient loading.
2.2 Sampling of sediment and water
Figure 1.Map of Odense Fjord (55◦29′15′′N, 10◦31′09′′E) show-ing the eight stations, where sediments were sampled for the long-term degradation experiment. Gray color indicates land and differ-ent shades of blue indicate water depth.
cores were sampled from each station with 30 cm long, 8 cm internal diameter Plexiglas core liners. The shallow stations (St 1–5) were sampled from a dinghy using a hand operated coring device. Cores from the deeper stations (St 6–8) were subsampled from a “HAPS” box corer onboard a larger ves-sel (Liv II, Danish Nature Agency). Water temperatures were 10–12◦C at the time of sampling.
Seawater used for the experiment was collected at Kerte-minde Harbor at various times during 2009–2011. The sea-water was GF/C-filtered and adjusted to the appropriate salinity (10 or 20) before it was used for experiments.
2.3 Experimental setup
Sediment cores were pre-treated before the experiment to assure that they had equal sediment height and were free of macrofauna. The sediment cores were adjusted to 20 cm depth by removing the bottom stopper and carefully remov-ing excess sediment from below. After reinsertremov-ing the bottom stopper, the overlying water was purged with N2for 30 min to induce anoxia and the top stopper was reinserted. Asphyx-iated macrofauna was removed from the sediment surface af-ter∼48 h in darkness.
The pre-treatment was completed 2–4 days after sampling and sediment cores were then transferred to the experimen-tal setup consisting of eight∼70 L water tanks located in a temperature-controlled room at 15◦C. The incubation tem-perature of 15◦C approximately corresponds to the average annual water temperature in Odense Fjord. Each tank con-tained all sediment cores from one station and was filled with filtered seawater with a salinity of 10 for St 1–3 and salinity of 20 for St 4–8, corresponding to the average salinity in the inner and outer basins of Odense Fjord (Fyns Amt, 2006).
The water reservoir in each tank was vigorously mixed and aerated by air pumps, and kept at a level 0.5 cm above the upper rim of the open core liners to assure mixing of the headspace. The tanks were kept in darkness and about one-third of the water was renewed with fresh seawater every 2 weeks.
The sediment cores were maintained in this setup for the entire experiment, which lasted 589–635 days, depending at station. The time when cores were first transferred to the in-cubation tanks is referred to ast=0. At selected times, three random sediment cores from each station were temporarily removed for flux measurements, and at other times three sed-iment cores were removed permanently for porewater and solid-phase analysis as well as anoxic sediment incubations (for more detail see sections below).
2.4 Flux measurements
The net exchange of nutrients (DIN and PO34−)between sed-iment and water was determined in flux expersed-iments with three random sediment cores from each station. Flux ex-periments were conducted weekly during the first 30 days, monthly until day 180 and every 2–3 months to the end. One day prior to flux measurements, the inside headspace wall of the cores designated for flux measurements were cleaned with a cotton swab to avoid biased flux measurements result-ing from bacterial biofilms on the inner surface of core liners (Valdemarsen and Kristensen, 2005). These cores were re-moved from the incubation tanks the next day, equipped with 4 cm long magnetic stirring bars a few centimeters above the sediment surface and placed around a central magnet rotating at 60 rpm. Initial water samples were taken from all cores be-fore they were closed with rubber stoppers. The cores were incubated in darkness for 4 h initially and up to 24 h at the end of the experiment, before the rubber stoppers were re-moved and final water samples were taken. Nutrient samples were stored frozen (−20◦C) until analyzed for NH+
4, NO
−
x (NO−3+NO−2)and PO34−on a Lachat Quickchem 8500 flow injection analyzer.
2.5 Core sectioning
Three sediment cores from each station were sectioned into 2 cm intervals to 16 cm depth at various times (after 1 day and 1, 7–8, 16–17 and 20–21 months). Core sectioning and subsequent sediment and porewater handling was done in-side a N2-filled glovebag. Individual sediment slices were homogenized and porewater for nutrient analysis was ob-tained after centrifugation of sediment subsamples in double centrifuge tubes (10 min,∼500 g) and GF/C filtration.
Sam-ples for NH+4 and PO34− were stored frozen (−20◦C) until
analysis as described above.
C (TOC) content, density and porosity were determined as described in Valdemarsen et al. (2014). Total N (TN) was measured by elemental analysis on dried sediment subsam-ples on a Carlo Erba CHN EA1108 elemental analyzer. Total P (TP) was extracted by boiling combusted sediment sub-samples for 1 h in 1 M HCl. After centrifugation (10 min, 500 g) the supernatants were stored until analyzed for PO34− by colorimetric analysis (Koroleff, 1983).
During initial and final core sectionings, reactive Fe was extracted from∼0.2 g sediment subsamples with 0.5 M HCl. After 30 min extraction on a shaking table and centrifuga-tion (10 min, 500 g) the supernatants were stored in 4 mL plastic vials at room temperature until analysis. Supernatants were analyzed for reduced Fe (FeII) and total Fe using the ferrozine method before and after reduction with hydroxy-lamine (Stookey, 1970; Lovley and Phillips, 1987). Oxidized iron (FeIII) was determined as the difference between total Fe and FeII.
Linear dimensionless NH+4-adsorption coefficients were determined during the initial core sectioning on wet sedi-ment subsamples from 0–2, 4–6 and 8–10 cm depth intervals in NH+4-adsorption experiments as described in Holmboe and Kristensen (2002). Sediment subsamples were incubated for 2 days in slurries with different NH+4 concentrations (0, 1, 2 and 3 mM) and 10 mg L−1 allylthiourea to inhibit ni-trification. After centrifugation (10 min, 500 g) the super-natant was decanted and adsorbed NH+4 was extracted from the sediment pellet in 2 M KCl (Mackin and Aller, 1984). Supernatants from slurries and KCl extractions was stored frozen (−20◦C) and analyzed for NH+
4 using the salicylate– hypochlorite method (Bower and Holm-Hansen, 1980). 2.6 Jar experiments
Closed anoxic sediment incubations (“jar experiments”) were performed with sediment from different depths (0–2, 4– 6 and 8–10 cm) right after core sectionings. Jar experiments measure the total anaerobic mineralization rates of ON and OP from temporal accumulation of metabolic end products (NH+4 and PO34−)in the porewater and yields solid results under a wide range of environmental and experimental condi-tions (Kristensen and Hansen, 1995; Kristensen et al., 2011; Valdemarsen et al., 2012; Quintana et al., 2013). Sediment from different depths was homogenized and fully packed into 6–8 glass scintillation vials (“jars”), leaving no headspace. The jars were closed with screw caps and buried in anoxic sediment at 15◦C. Two jars were sacrificed at 3–5 day
inter-vals for porewater extraction by centrifugation. The jars were fitted with a perforated lid containing a GF/C filter inside be-fore centrifugation and were then centrifuged head-down in a centrifuge tube (10 min,∼500 g). Extracted porewater was stored frozen (−20◦C) and analyzed for NH+
4 and PO 3−
4 by colorimetric analysis as described above.
2.7 Calculations and statistics
Initial area-specific pools of TN and TP were calculated by depth integration (0–20 cm) of TN and TP content in in-dividual sediment layers. Differences in area-specific pools of TN and TP between stations were detected by one-way ANOVA followed by Tuckey’s post hoc test. Data were log-transformed before statistical analysis when assumptions of homoscedasticity were not met (only TN). Area-specific pools of FeIII were calculated by depth integration at the be-ginning (initial) and end (final) and compared by pairwise ttests.
NH+4-adsorption coefficients (KNH) in individual sedi-ment layers were determined based on NH+4-adsorption ex-periments. Extracted NH+4 (µmol g dw sediment) was plot-ted against NH+4 concentration (µmol cm−3), and the lin-ear slope, K′, was determined by least-squares regression. KNH could hereafter be determined from the relationship KNH=((1−8)/8)×ρds×K′, where8is sediment poros-ity andρdsis dry sediment density (Holmboe and Kristensen, 2002).
Rates of microbial ON and OP mineralization in dis-crete depth intervals (0–2, 4–6 and 8–10 cm) were ob-tained from jar experiments by fitting the time-dependent linear concentration change of NH+4 and PO34− by least-squares regression (Aller and Yingst, 1980). When slopes were significant (p< 0.05) the volume-specific reaction rates (nmol cm−3d−1)in individual depth layers were calculated from the slopes and corrected for sediment porosity and ad-sorption (Kristensen and Hansen, 1995). The mineralization rates at 10–20 cm depth were calculated from exponential re-gressions based on ON and OP mineralization rates in the top 10 cm. Total area-specific ON and OP mineralization was calculated by depth integration (0–20 cm) of measured NH+4 and PO34−production at different depths. The temporal pat-terns of total area-specific ON and OP mineralization were fitted to a double exponential decay regression model of the formy=CL×exp(−kL×t)+CR×exp(−kR×t), wheret is time, CL and CR are constants and kL and kR denote the first-order decay constants for labile and refractory ON and OP, respectively. We hereby assume that considera-tions based on organic C degradation kinetics (Westrich and Berner, 1984) are also valid for ON and OP mineralization. Half-lives of labile and refractory ON and OP could here-after be calculated from the formulaT0.5=ln (2)/k′, where k′denotekLandkR.
3 Results
3.1 Sediment characteristics
sed-Table 1.Dimensionless linear NH+4-adsorption coefficients,KNH, for different sediment depths at St 1–8.
St 1 St 2 St 3 St 4 St 5 St 6 St 7 St 8
0–2 cm 0.26 1.06 0.33 0.46 0.64 0.31 0.57 0.48 6–8 cm 0.52 0.76 0.49 0.45 0.82 0.51 0.62 0.36 8–10 cm 0.40 0.82 0.20 0.79 0.55 0.66 0.14 0.45
Table 2.Depth-integrated (0–16 cm) area-specific TN and TP con-tent±SE (n=3) at St 1–8. Superscript letters indicate the grouping of data obtained by ANOVA and subsequent post hoc analysis. Av-erage TN : TP ratios are also shown.
TN TP TN : TP
(mol m−2) (mol m−2) – St 1 13.5±0.4a 1.34±0.04a 10.1 St 2 21.5±0.5b 1.31±0.02a 16.4 St 3 16.0±0.2b 0.70±0.06b 22.9 St 4 16.6±1.1b 1.18±0.06a 14.1 St 5 4.5±0.1c 0.73±0.04b 6.2 St 6 17.1±0.1b 1.94±0.03c 8.8 St 7 18.1±0.0b 1.86±0.05c 9.7 St 8 19.5±0.2b 1.83±0.03c 10.7
iments from all stations had high sand content and vari-able silt–clay content with wet densities ranging from 1.2 to 1.8 g cm−3and porosities of 0.3–0.8. The medium grain size varied from 87 to 397 µm among stations. The sediments from the innermost stations (St 1–3) and most of the stations in the outer basin (St 4 and 6–8) contained a high proportion of silt–clay particles (13–63 %). Furthermore, the stations rich in silt–clay particles were organic rich with 0.6–5.2 % POC compared to the more sandy St 5 (0.1–0.2 % POC).
NH+4-adsorption coefficients varied erratically among sta-tions and sediment depths (Table 1).KNHranged from 0.14 in the 8–10 cm deep sediment at St 7 to 1.06 in the surface sediment at St 2.
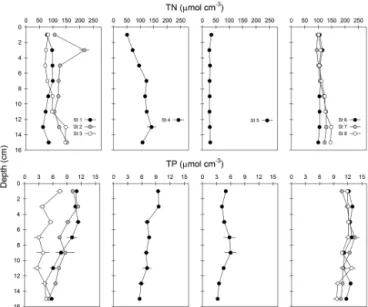
St 1 and St 3 from the inner basin had similar TN content ranging between 57 and 156 µmol cm−3 (Fig. 2). St 2 had slightly higher TN (103–227 µmol cm−3) with a pronounced subsurface peak occurring at 3 cm depth. In the outer basin the shallow and deep silty stations (St 4 and 6–8) had similar TN content (92–154 µmol cm−3), ex-cept at the surface, where TN was lower at St 4 (38– 60 µmol cm−3). The sandy St 5 contained exceptionally low TN (8–16 µmol cm−3). Depth-integrated TN was therefore lowest at St 5 (4.5±0.1 mol N m−2), intermediate at St 1 (13.5±0.4 mol N m−2)and similarly high at the remaining stations (16.0 to 21.4 mol N m−2, Table 2).
Two of the stations in the inner basin (St 1 and 2) had sim-ilar TP profiles, with 10–11 µmol cm−3at the sediment sur-face and a gradual decrease to 5.1–5.8 µmol cm−3at 15 cm depth (Fig. 2). St 3 had the lowest TP content of the
sta-Figure 2.Total nitrogen (TN) and total phosphorous (TP) in sedi-ments from Odense Fjord. Left panels show stations from the shal-low inner fjord (St 1, 2 and 3), middle panels show shalshal-low silty and sandy sediments in the outer fjord (St 4 and 5, respectively) and right panels show deep silty sediments in the outer fjord (St 6, 7 and 8). Error bars indicate standard error (n=3).
tions in the inner basin. The shallow silty sediments in the outer basin (St 4) were similar to St 1–2 with respect to TP, whereas the shallow sandy sediment (St 5) was simi-lar to St 3. The deep silty sediments in the outer basin (St 6–8) were characterized by constant TP with depth (9.6– 13.5 µmol cm−3). Depth integration showed that the highest area-specific TP content was found at the deep outer fjord stations (1.8–1.9 mol P m−2), whereas shallow silty sedi-ments in the inner and outer fjord contained intermediate TP content (1.2–1.3 mol P m−2; St 1, 2 and 4; Table 2). The low-est TP content (∼0.7 mol P m−2)was found at the silty St 3 and sandy St 5 in inner and outer fjord, respectively.
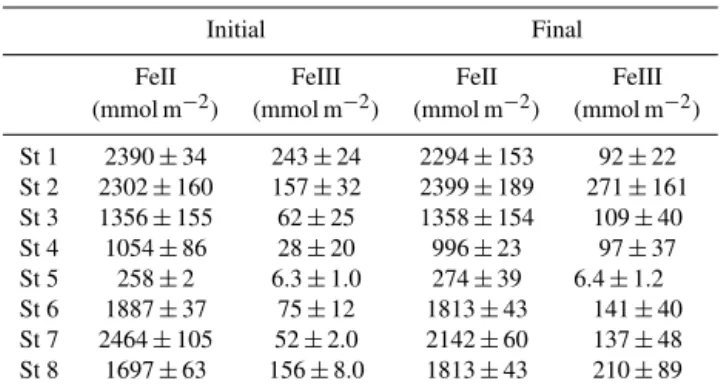
Initial FeIII pools varied 30-fold between stations (6– 243 mmol m−2; Table 3), with the lowest FeIII content found in shallow sandy sediment from the outer basin (St 5). FeIII only constituted a minor fraction (2–10 %) of total Fe at all stations. No statistically significant differences were detected between initial and final FeIII pools (p> 0.17), but there were trends towards higher final FeIII content, except at St 1 and 5.
3.2 ON and OP mineralization
sedi-Table 3. Initial and final depth-integrated pools (0–20 cm) of FeIII±SE (n=3) at St 1–8.t tests showed no significant differ-ence between initial and final FeIII pools at any station.
Initial Final
FeII FeIII FeII FeIII
(mmol m−2) (mmol m−2) (mmol m−2) (mmol m−2)
St 1 2390±34 243±24 2294±153 92±22 St 2 2302±160 157±32 2399±189 271±161 St 3 1356±155 62±25 1358±154 109±40 St 4 1054±86 28±20 996±23 97±37 St 5 258±2 6.3±1.0 274±39 6.4±1.2 St 6 1887±37 75±12 1813±43 141±40 St 7 2464±105 52±2.0 2142±60 137±48 St 8 1697±63 156±8.0 1813±43 210±89
ments did not become significantly more oxidized during the long-term incubations as indicated by a modest buildup of oxidized FeIII and continuous presence of hydrogen sulfide in the porewater of surface sediment from all stations (data not shown). Hence we assume that mineralization rates in the sediment cores underlying an oxic water phase were closely approximated by the rates obtained in jar experiments.
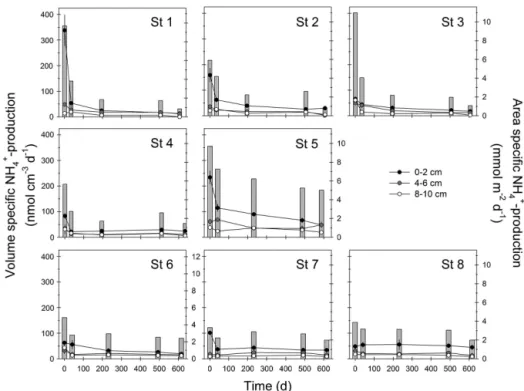
NH+4 production in jar experiments was significant throughout the experiment, except for St 1, 8–10 cm depth after 607 days. Initially NH+4 production was highest in the surface 0–2 cm sediment from the silty St 1–2 in the inner fjord and the sandy St 5 in the outer fjord (159– 338 nmol cm−3d−1) and was similar at remaining stations (63–101 nmol cm−3d−1; Fig. 3). Surface NH+
4 production decreased rapidly over time in sediments from shallow lo-cations in the inner and outer fjord, by 96 % of initial rates at St 1 and by 61–82 % at St 2–5. The surface NH+4 production in the sediments sampled in the deep outer basin (St 6–8) decreased by 8–67 % during the experiment. NH+4 produc-tion at 4–6 cm depth was initially 18–60 nmol cm−3d−1 at all stations and temporal changes were also observed in this layer, especially in shallow silty sediments from the inner basin, where NH+4 production decreased by 75–96 % to 1.4– 12 nmol cm−3d−1by the end (Fig. 3). In sediments from the outer basin, NH+4 production at 4–6 cm depth only decreased by 19–58 %. At 8–10 cm depth, NH+4 production at all sta-tions occurred at similar rates and showed similar temporal trends as observed at 4–6 cm depth (Fig. 3).
Significant PO34− production was measured in the sur-face sediment from all stations throughout the experiment (Fig. 4). Initial rates were highest (30–35 nmol cm−3d−1)at St 1 and 2 from the shallow inner basin and considerably lower (7–18 nmol cm−3d−1)at the remaining stations. PO34− production initially decreased rapidly in the surface sediment from St 1 and 2 and stabilized at relatively low and stable lev-els after∼200 days (0.7–6.0 nmol cm−3d−1). Surface PO3−
4 production also decreased over time at the other stations, but temporal trends were more erratic. PO34−production in
deeper sediment was generally lower than at the surface, and with less variability among stations (Fig. 4). PO34− produc-tion at 4–6 cm depth was 0–6 nmol cm−3d−1and remained quite stable throughout the experiment at all stations. The only significant decrease (p=0.01–0.03) occurred in silty sediments from the inner basin (St 1–3) and St 6 and 8 from the deep outer basin. PO34−production varied between 0 and 5 nmol cm−3d−1at 8–10 cm depth and was stable through-out the experiment.
Area-specific ON mineralization was calculated by depth integration of NH+4 production rates (Fig. 3). The sediments from the inner basin (St 1–3) showed high initial ON min-eralization (6–11 mmol m−2d−1)in the same range as the shallow silty and sandy sediments from the outer basin (6 and 10 mmol m−2d−1at St 4 and 5, respectively). The deep silty sediments from the outer basin showed the lowest initial ON mineralization (St 6–8; 3–5 mmol m−2d−1). Area-specific ON mineralization decreased during the experiment at all sta-tions, by 82–93 % for the silty inner fjord and 34–71 % at re-maining stations. The temporal decrease was mainly driven by successively lower ON mineralization in surface sediment during the first ∼200 days and area-specific ON mineral-ization was fairly constant hereafter. Initial area-specific OP mineralization was 0.2–1.0 mmol m−2d−1 (Fig. 4) and de-creased (59–70 %) over time at several of the stations (St 1–3 and St 6). As for ON mineralization, the successively lower OP mineralization was mainly due to decreased OP mineral-ization in surface sediment. At the other stations area-specific OP mineralization remained relatively high and did not show clear temporal trends.
Double exponential decay models fitted the ON mineral-ization kinetics at St 1–6 and the OP mineralmineral-ization kinetics at St 1–3 and 6. Erratic mineralization patterns prevented the use of exponential decay models at remaining stations (see Fig. 3–4). Decay constants for labile and refractory ON and OP in were fairly similar at all stations, withkL’s of 0.02– 0.06 d−1(except for 10 times higher values for ON at St 6 and for OP at St 2) andkR’s of 0.0003–0.0015 (Table 4). The half-lives for ON and OP were in the range of 0.01–0.11 and 1.3–6.3 years for labile and refractory fractions, respectively. 3.3 DIN and DIP fluxes
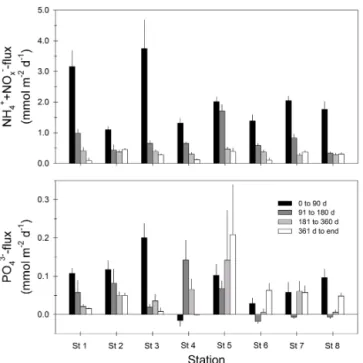
DIN fluxes followed a similar exponentially decreas-ing pattern for all stations (Fig. 5), and ranged from 1.1–3.7 mmol m−2d−1 initially (t=0–90 d) to 0.09–
0.5 mmol m−2d−1 by the end. The main form of DIN released initially was NH+4, which contributed 59–100 % of DIN release. Subsequently the NH+4 efflux decreased, while NO−
x switched from uptake to release, and after 0.5–1 years to the end of the experiment, 68–100 % of the DIN was released as NO−
x.
Figure 3.NH+4 production measured in jar experiments with sediment from shallow inner basin (upper panels), shallow silty and sandy outer basin (middle panels) and deep silty outer basin (lower panels). Black, gray and white symbols indicate volume-specific NH+4 production in sediment from 0–2, 4–6 and 8–10 cm depth, respectively (leftyaxis). Bars indicate depth-integrated (0–20 cm) NH+4 production based on volume-specific production rates (rightyaxis).
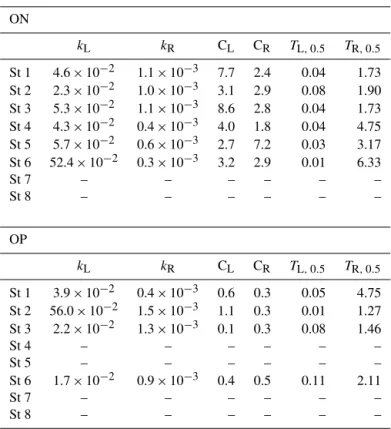
Table 4.Double exponential regression statistics for the temporal trends of total ON and OP degradation in jar experiments. Total organic N (ON) and P (OP) degradation were fitted to the exponential decay functiony=CL×exp(−kL×x)+CR×exp(−kR×x), where CLand CRdenote constants andkLandkRdenote decay constants for labile and refractory organic ON and OP, respectively. Statistics were not calculated for St 7–8 (ON) and for St 4–5 and 7–8 (OP), since the temporal degradation patterns did not fit the double exponential decay model.TL,0.5, andTR,0.5, denote the half-life (y) of labile and refractory ON and OP, respectively.
ON
kL kR CL CR TL,0.5 TR,0.5
St 1 4.6×10⁻² 1.1×10⁻³ 7.7 2.4 0.04 1.73 St 2 2.3×10⁻² 1.0×10⁻³ 3.1 2.9 0.08 1.90 St 3 5.3×10⁻² 1.1×10⁻³ 8.6 2.8 0.04 1.73 St 4 4.3×10⁻² 0.4×10⁻³ 4.0 1.8 0.04 4.75 St 5 5.7×10⁻² 0.6×10⁻³ 2.7 7.2 0.03 3.17 St 6 52.4×10⁻² 0.3×10⁻³ 3.2 2.9 0.01 6.33
St 7 – – – – – –
St 8 – – – – – –
OP
kL kR CL CR TL,0.5 TR,0.5
St 1 3.9×10⁻² 0.4×10⁻³ 0.6 0.3 0.05 4.75 St 2 56.0×10⁻² 1.5×10⁻³ 1.1 0.3 0.01 1.27 St 3 2.2×10⁻² 1.3×10⁻³ 0.1 0.3 0.08 1.46
St 4 – – – – – –
St 5 – – – – – –
St 6 1.7×10⁻² 0.9×10⁻³ 0.4 0.5 0.11 2.11
St 7 – – – – – –
St 8 – – – – – –
(initial fluxes of 0.1–0.2 mmol m−2d−1decreasing to 0.01– 0.05 mmol m−2d−1 by the end; Fig. 5). Initial (day 0–90) PO34− fluxes at the shallow silty St 4 was around zero, but increased to 0.07–0.14 mmol m−2d−1 during days 90– 360 of the experiment. The highest PO34− fluxes (0.07– 0.21 mmol m−2d−1) were observed at the TP-poor sandy St 5, particularly towards the end of the experiment, while the TP-rich outer fjord stations 6–8 had the lowest and most irregular PO34− fluxes, ranging from slightly negative to 0.1 mmol m−2d−1.
3.4 PO3−
4 and NH +
4 in porewater
Porewater nutrient concentrations increased gradually at all depths during the experiment (data not shown). NH+4 and PO34− only increased moderately in the upper 2 cm, but ac-cumulated to high levels in the deeper diffusion-limited sed-iment. Depth-averaged initial porewater NH+4 concentration varied between 171 and 407 µM at the stations. The sandy St 5 showed the highest NH+4 accumulation over time with a depth average of 1473 µM in porewater by the end. At the remaining stations, NH+4 only accumulated to 259–587 µM. Depth-averaged PO34−concentrations at the beginning varied between 17 and 71 µM depending on station. As for NH+4,
the nutrient-poor sandy St 5 showed the highest PO34− accu-mulation to 368 µM compared with 43–170 µM at the other stations.
3.5 N and P budgets
Figure 5. Fluxes of dissolved inorganic nitrogen (DIN=NH+ 4+ NO−x)and PO34−at various times during the experiment. Error bars represent standard error (n=6–24).
PO34−efflux and porewater accumulation only accounted for 10–48 % of total OP mineralization.
4 Discussion
4.1 Sediment nutrient content
TN and TP in sediments from Odense Fjord were in the same range or higher than reported for other eutrophic systems (e.g., Boynton and Kemp, 1985; Cowan and Boynton, 1996; Lomstein et al., 1998; Coelho et al., 2002; Viktorsson et al., 2013), emphasizing the history of intense eutrophication in Odense Fjord. TN and TP in the silty sediments of Odense Fjord (all stations except St 5) were remarkably similar and only varied ∼1.5-fold (TN) and ∼3-fold (TP) among sta-tions. Despite these overall similarities, the silty sediments from the shallow inner basin showed higher initial ON and OP mineralization and nutrient effluxes than silty sediments from the outer fjord. This could be due to higher availability of labile ON and OP in the sediments from the inner basin, reflecting the nutrient-rich conditions in the inner compared to the outer basin (Petersen et al., 2009).
The sandy St 5 was markedly different from the other sta-tions. It had the lowest total nutrient content and yet ex-hibited some of the highest rates of ON and OP mineral-ization. The frequent erosion by wind-driven waves in this area (Valdemarsen et al., 2010) and deep (> 20 cm) rework-ing by lugworms (Arenicola marina; Riisgaard and Banta, 1998; Valdemarsen et al., 2011) may remove fine particles
and refractory organic matter from St 5 sediments (Wendel-boe et al., 2013) and prevent organic matter accumulation, hence explaining the low organic content at this station. On the other hand, intense growth and burial of microphytoben-thos and other reactive detritus by the strong physical distur-bance and vertical mixing can explain the unexpectedly high TN and TP reactivity of St 5 sediment.
A rough areal estimate based on the measured TN and TP content at the examined stations (Table 2) suggests that 12.6×10⁶kg N and 3.7×10⁶kg P are stored in the upper 20 cm of Odense Fjord sediments, corresponding to∼6 (N) and∼62 (P) years of the current annual external nutrient loading to the system.
4.2 Organic N and P mineralization
Microbial mineralization of ON and OP in Odense Fjord sed-iments led to marked release of inorganic nutrients, espe-cially in the initial phase of the experiment. Initially there were strong vertical gradients of ON and OP mineralization in silty and sandy sediments from shallow environments, in-dicating that newly deposited and relatively labile organic matter was being degraded near the sediment surface, with the depth gradient reflecting a gradual and time-dependent depletion of labile ON and OP (Westrich and Berner, 1984; Mackin and Swider, 1989; Valdemarsen et al., 2014). It was expected that ON and OP mineralization would decrease with time at all depths due to diminishing reactivity of the organic pools. However, significant temporal decreases were only observed in surface sediments from shallow locations, whereas mineralization rates were surprisingly stable in the underlying sediment and the entire sediment column in the deep outer fjord. Assuming that organic matter degradation follows an exponential decay pattern, the lack of a detectable attenuation in mineralization rates over a∼2-year period
in-dicates very low initial reactivity of ON and OP in the deeper layers (Westrich and Berner, 1984). Nevertheless, since ON and OP of low reactivity was present at high concentrations, it remained a significant source for inorganic nutrients.
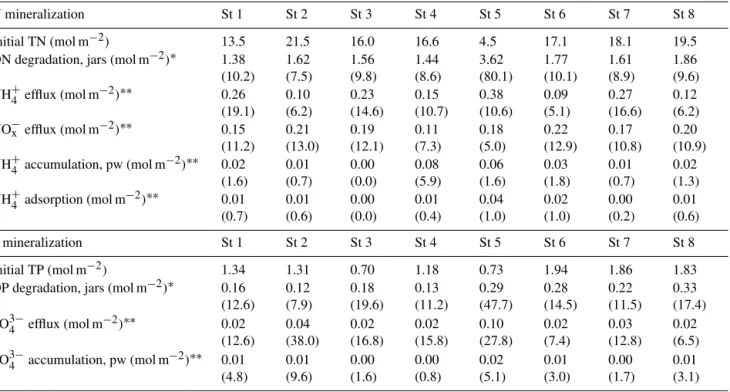
Table 5.N and P budgets for the experiment. Initial TN and TP are the depth-integrated values based on initial measurements. ON and OP degradation were calculated based on area-specific rates obtained from jar experiments. Total NH+4, NO−x and PO34−effluxes were calculated by time integration of effluxes over the entire experimental period. NH+4 and PO34−accumulation in porewater (pw) was calculated from the difference between initial and final pw profiles. NH+4 adsorption was calculated from initial and final pw inventories of NH+4 and the average NH+4-adsorption coefficient for each station. Values in parentheses marked with∗or∗∗represent percentage relative to initial TN and TP or total N and P mineralization, respectively.
N mineralization St 1 St 2 St 3 St 4 St 5 St 6 St 7 St 8
Initial TN (mol m−2) 13.5 21.5 16.0 16.6 4.5 17.1 18.1 19.5 ON degradation, jars (mol m−2)∗ 1.38
(10.2) 1.62 (7.5) 1.56 (9.8) 1.44 (8.6) 3.62 (80.1) 1.77 (10.1) 1.61 (8.9) 1.86 (9.6) NH+4 efflux (mol m−2)∗∗ 0.26
(19.1) 0.10 (6.2) 0.23 (14.6) 0.15 (10.7) 0.38 (10.6) 0.09 (5.1) 0.27 (16.6) 0.12 (6.2) NO−x efflux (mol m−2)∗∗ 0.15
(11.2) 0.21 (13.0) 0.19 (12.1) 0.11 (7.3) 0.18 (5.0) 0.22 (12.9) 0.17 (10.8) 0.20 (10.9) NH+4 accumulation, pw (mol m−2)∗∗ 0.02
(1.6) 0.01 (0.7) 0.00 (0.0) 0.08 (5.9) 0.06 (1.6) 0.03 (1.8) 0.01 (0.7) 0.02 (1.3) NH+4 adsorption (mol m−2)∗∗ 0.01
(0.7) 0.01 (0.6) 0.00 (0.0) 0.01 (0.4) 0.04 (1.0) 0.02 (1.0) 0.00 (0.2) 0.01 (0.6)
P mineralization St 1 St 2 St 3 St 4 St 5 St 6 St 7 St 8
Initial TP (mol m−2) 1.34 1.31 0.70 1.18 0.73 1.94 1.86 1.83 OP degradation, jars (mol m−2)∗ 0.16
(12.6) 0.12 (7.9) 0.18 (19.6) 0.13 (11.2) 0.29 (47.7) 0.28 (14.5) 0.22 (11.5) 0.33 (17.4) PO34−efflux (mol m−2)∗∗ 0.02
(12.6) 0.04 (38.0) 0.02 (16.8) 0.02 (15.8) 0.10 (27.8) 0.02 (7.4) 0.03 (12.8) 0.02 (6.5) PO34−accumulation, pw (mol m−2)∗∗ 0.01
(4.8) 0.01 (9.6) 0.00 (1.6) 0.00 (0.8) 0.02 (5.1) 0.01 (3.0) 0.00 (1.7) 0.01 (3.1)
4.3 Fate of inorganic nutrients
NH+4 and PO34−produced by microbial mineralization accu-mulated in porewater of all sediments within the first 1–6 months and only changed slightly hereafter. However, over the whole experiment, porewater accumulation explained only a minor fraction of the jar-based total ON and OP min-eralization (0.8–8.1 %). We also investigated whether NH+4 adsorption to mineral surfaces was an important N sink. De-spite the large spatial heterogeneity of NH+4 adsorption, this process never accounted for more than 1 % of the total pro-duced NH+4 over the whole experiment and was therefore not quantitatively important.
Nutrient release to the overlying water was the most im-portant route for inorganic nutrients produced by micro-bial mineralization. We could not account for all the pro-duced nutrients, since nutrient mineralization in jar experi-ments exceeded DIN and PO34−effluxes by 70–84 % and 62– 93 %, respectively. The missing NH+4 may have been lost through coupled nitrification–denitrification (e.g., Mackin and Swider, 1989; Quintana et al., 2013). The conspicu-ous shift from NH+4 to NO−3 release indicated that nitri-fication was an active process in all sediment types, and denitrifying bacteria probably proliferated in the NO−3-rich surface sediment. In the present case, coupled nitrification–
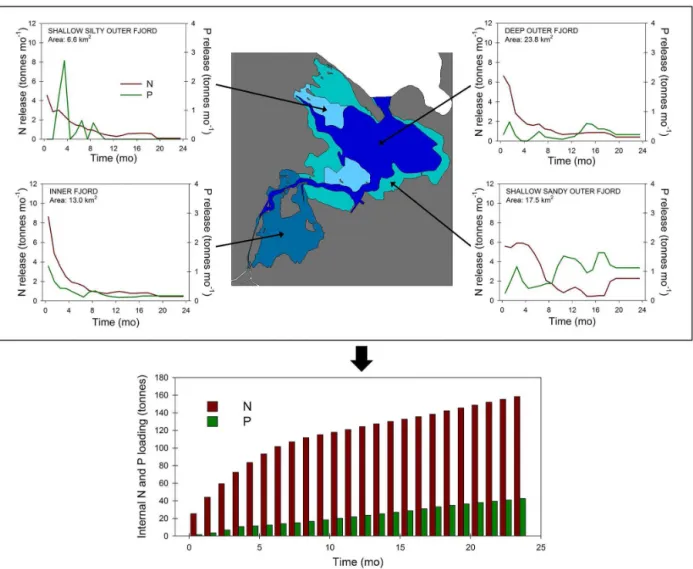
Figure 6.Estimated internal nutrient loading in Odense Fjord. The upper figure shows a schematic overview of Odense Fjord with the distribution of sediment types included in this study and their nutrient release over a 24-month period. The lower figure shows the cumulated nutrient release from the entire fjord bottom.
4.4 Internal nutrient loading
We calculated the potential internal nutrient loading in Odense Fjord resulting from microbial mineralization of ON and OP for a 2-year period based on the measured nutrient ef-fluxes. Average nutrient fluxes were calculated for each sed-iment type, i.e., shallow inner fjord (St 1–3), shallow silty outer fjord (St 4), sandy outer fjord (St 5) and deep outer fjord (St 6–8). The monthly time-weighted DIN and PO34− fluxes and the total areal distribution of the different sediment types in Odense Fjord were then used to calculate the to-tal internal nutrient loading (103kg N and P mo−1)for each sediment type and for the whole ecosystem. Evidently these calculations do not represent the in situ internal nutrient load-ing, since effects of the otherwise continuous deposition of organic matter were omitted in the experimental setup. It can also be debated whether all the released nutrients can be con-sidered internal nutrient loading, since the mineralization of
recently deposited organic matter in surface sediments drove the majority of nutrient release during the first∼200 days. This nutrient release is largely determined by the ecosystem primary productivity extending only a few years back, and is therefore closely coupled to the recent levels of external nutrient loading. In any case the calculations represent the nutrient release resulting from the mineralization of slowly reacting ON and OP which have accumulated in the sedi-ments.
im-portant for the total fjord-wide N release (39 %), whereas the remaining three sediment types contributed equally (16– 23 %). The numbers for internal N loading are impressive at first, but they only correspond to maximum 2–6 % (N) of the current external N loading to Odense Fjord (about 2000×103kg N yr−1; Petersen et al., 2009). In the shallow
N-limited Odense Fjord the internal N loading can therefore only have minor effects on overall ecosystem productivity. In any case the external N loading is far more important for the overall primary productivity and ecological status.
The internal P loading showed different temporal dy-namics than internal N loading. Total P release from the whole fjord bottom was stable over time at rates of 21– 22×103kg P yr−1(∼3.4–3.6 kg P ha−1y−1; Fig. 6), while internal N loading decreased exponentially. The stability was driven by the increasing P release in shallow sandy outer fjord sediment and constant P release in deep outer fjord sediment. As for N, the shallow sandy sediments in the outer fjord was most important for total internal P loading (57 %) and the remaining three sediment types contributed equally (14–15 %). The internal P loading corresponded to 35–36 % (P) of the current external P loading to Odense Fjord (60×103kg P yr−1; Petersen et al., 2009) and thus po-tentially constitutes a stable and significant P source in the system. However, since Odense Fjord and most other tem-perate coastal ecosystems are mostly N-limited (Howarth et al., 2011), it is uncertain to which degree this excess P will affect ecosystem productivity.
4.5 Ecological implications
In many shallow eutrophic estuaries the external nutrient loading has been reduced to induce oligotrophication, but lower nutrient concentrations in the recipient estuary often occur after considerable delay and rarely correspond propor-tionally to the reductions (Kronvang et al., 2005; Carstensen et al., 2006). This indicates that a transient phase occurs, where accumulated nutrients are being released from the soils and sediments in the water shed and receiving estuary, respectively, while the system equilibrates to a new level of external nutrient loading. Our study shows the magnitude and temporal dynamics of the internal nutrient loading that can be expected in shallow estuaries recovering from eutrophica-tion. It appears that internal N loading will be insignificant during recovery since it only corresponded to 2–6 % of the external N loading in our example and decreased rapidly. In-ternal N loading will therefore only lead to marginally ele-vated N availability and have minor effects on primary pro-ductivity and eutrophication status. The results are different with respect to PO34−, since the internal P loading was stable and corresponded to > 1/3 of the external P loading. Inter-nal P loading may therefore be a significant source of dis-solved PO34−for extended time in shallow eutrophic estuar-ies, and at a sufficiently high level to counteract reductions in the external P loading. Most shallow estuaries are N-limited
(Conley et al., 2002; Howarth and Marinho, 2006; Howarth et al., 2011), so a high internal P loading might only exacer-bate N limitation while having no further consequences for ecological quality. Decreasing internal N loading and stable internal P loading could also lead to increased dominance of cyanobacteria, which have low requirements for dissolved N. However, major shifts in phytoplankton communities would only occur in systems where decreased internal nutrient load-ing results in markedly lower DIN concentrations in the wa-ter phase, i.e., in systems where N loading is low and inwa-ternal nutrient sources dominate.
5 Conclusions
In this study we investigated the mineralization of organic N and P buried in the sediments from a shallow eutrophic estuary and obtained estimates of the magnitude and tem-poral dynamics of internal nutrient loading. Total internal N loading, which attenuated rapidly, corresponded to only a minor fraction of the external N loading and was therefore not important for the ecological state in the studied ecosys-tem. Total internal P loading showed no temporal attenuation and was quantitatively more important as it corresponded to more than one-third of the external P loading. However, the studied ecosystem was N-limited, and it is therefore uncer-tain whether high internal P loading will result in negative ecological effects. This study indicates that internal nutri-ent loading, and especially internal N loading, is a transinutri-ent phenomena that can only temporarily influence the recovery trajectory of ecosystems recovering from eutrophication. In turn, internal nutrient loading driven by mineralization of or-ganic N and P in sediments cannot explain the lack of recov-ery in shallow estuaries where external nutrient loading has been reduced.
Acknowledgements. The authors thank the people who helped with sampling, experimental work or analysis during this experiment (the crew aboard Liv II, Birthe Christensen, Rikke Orloff Holm, Maria Del Mar Sánchez Huertas and Maria Jensen). This project was funded by the Danish Strategic Science Foundation through grant 09-063190/DSF. C. O. Quintana was funded by FAPESP (São Paulo Research Support Foundation) grant # 2012/06121-1.
Edited by: C. P. Slomp
References
Aller, R. C. and Yingst, J. Y: Relationships between microbial dis-tributions and the anaerobic decomposition of organic-matter in surface sediments of Long-Island Sound, USA, Mar. Biol., 56, 29–42, 1980.
Azzoni, R., Gianmarco, G., and Viaroli, P.: Iron-sulphur-phosphorous interactions: implications for sediment buffering capacity in a mediterranean eutrophic lagoon, Hydrobiologia, 550, 131–148, 2005.
Bower, C. E. and Holm-Hansen, T.: A salicylate-hypochlorite method for determining ammonia in seawater, Can. J. Fish. Aquat. Sci., 37, 794–798, 1980.
Boynton, W. R. and Kemp, W. M.: Nutrient regeneration and oxygen-consumption by sediments along an estuarine gradient, Mar. Ecol.-Prog. Ser., 23, 45–55, 1985.
Bukaveckas, P. A. and Isenberg, W. N.: Loading, transformation, and retention of Nitrogen and Phosphorus in the tidal freshwater James River (Virginia), Estuar. Coast., 36, 1219–1236, 2013. Burdige, D. J.: The kinetics of organic-matter mineralization in
anoxic marine sediments, J. Mar. Res., 49, 727–761, 1991.
Burgin, A. J. and Hamilton, S. K.: Have we overemphasized the role of denitrification in aquatic ecosystems?, A review of nitrate removal pathways, Front. Ecol. Environ., 5, 89–96, 2007. Carstensen, J., Conley, D. J., Andersen, J. H., and Aertebjerg, G.:
Coastal eutrophication and trend reversal: A Danish case study, Limnol. Oceanogr., 51, 398–408, 2006.
Christensen, P. B., Rysgaard, S., Sloth, N. P., Dalsgaard, T., and Schwærter, S.: Sediment mineralization, nutrient fluxes, denitri-fication and dissimilatory nitrate reduction to ammonium in an estuarine fjord with sea cage trout farms., Aquat. Microb. Ecol., 21, 73–84, 2000.
Coelho, J. P., Flindt, M. R., Jensen, H. S., Lillebo, A. I., and Pardal, M. A.: Phosphorus speciation and availability in intertidal sedi-ments of a temperate estuary: relation to eutrophication and an-nual P-fluxes, Estuar. Coast. Shelf S., 61, 583–590, 2004. Conley D. J., Markager, S., Andersen, J., Ellermann, T., and
Svend-sen L. M.: Coastal eutrophication and the Danish National Aquatic Monitoring and Assessment Program, Estuaries, 25, 848–861, 2002.
Cook, P. L. M., Wenzhofer, F., Glud, R. N., Janssen, F., and Huettel, M.: Benthic solute exchange and carbon mineralization in two shallow subtidal sandy sediments: Effect of advective pore-water exchange, Limnol. Oceanogr., 52, 1943–1963, 2007.
Cowan, J. L. W. and Boynton, W. R.: Sediment-water oxygen and nutrient exchanges along the longitudinal axis of Chesapeake Bay: Seasonal patterns, controlling factors and ecological sig-nificance, Estuaries, 19, 562–580, 1996.
Fulweiler, R. W., Nixon, S. W., and Buckley, B. A.: Spatial and tem-poral variability of benthic oxygen demand and nutrient regener-ation in an anthropogenically impacted New England Estuary, Estuar. Coast., 33, 1377–1390, 2010.
Fyns Amt: Miljøfarlige stoffer og ålegræs i Odense Fjord, Fyns Amt, Natur-og Vandmiljøafdelingen, Odense, 1–108, 2006. Gunnars, A. and Blomqvist, S.: Phosphate exchange across the
sediment–water interface when shifting from anoxic to oxic conditions – an experimental comparison of freshwater and brackish-marine systems, Biogeochemistry, 37, 203–226, 1997. Holmboe, N. and Kristensen, E.: Ammonium adsorption in
sedi-ments of a tropical mangrove forest (Thailand) and a temperate Wadden Sea area (Denmark), Wetl. Ecol. Manag., 10, 453–460, 2002.
Howarth, R. W. and Marino, R.: Nitrogen as the limiting nutrient for eutrophication in coastal marine ecosystems: evolving views over three decades, Limnol. Oceanogr., 51, 364–376, 2006. Howarth, R., Chan, F., Conley, D. J., Garnier, J., Doney, S. C.,
Marino, R., and Billen, G.: Coupled biogeochemical cycles: eu-trophication and hypoxia in temperate estuaries and coastal ma-rine ecosystems, Front. Ecol. Environ., 9, 18–26, 2011. Huettel, M., Berg, P., and Kostka, J. E.: Benthic Exchange and
Bio-geochemical Cycling in Permeable Sediments, Ann. Rev. Mar. Sci., 6, 23–51, 2014.
Hulth, S., Aller, R. C., Canfield, D. E., Dalsgaard, T., Engström, P., Gilbert, F., Sundbäck, K., and Thamdrup, B.: Nitrogen removal in marine environments: recent findings and future research chal-lenges, Mar. Chem., 94, 125–145, 2005.
Jantti, H. and Hietanen, S.: The effects of hypoxia on sediment ni-trogen cycling in the Baltic Sea, Ambio, 41, 161–169, 2012. Jensen, H. S., Mortensen, P. B., Andersen, F. O., Rasmussen, E., and
Jensen, A.: Phosphorous cycling in a coastal marine sediment, Aarhus Bay, Denmark, Limnol. Oceanogr., 40, 908–917, 1995. Kelly, J. R. and Nixon, S. W.: Experimental studies of the effect of
organic deposition on the metabolism of a coastal marine bottom community, Mar. Ecol.-Prog. Ser., 17, 157–169, 1984.
Koroleff, F.: Determination of phosphorus, in: Method of Seawater Analysis, edited by: Grashof, K., Erhardt, M., and Kremling, K., Verlag Chemie, Weinheim, 125–131, 1983.
Kristensen, E. and Hansen, K.: Decay of plant detritus in organic-poor marine sediment: production rates and stoichiometry of dis-solved C and N compounds, J. Mar. Res., 53, 675–702, 1995. Kristensen, E., Mangion, P., Tang, M., Flindt, M. R., Holmer, M.,
and Ulomi, S.: Microbial carbon oxidation rates and pathways in sediments of two Tanzanian mangrove forests, Biogeochemistry, 103, 143–58, 2011.
Kristensen, E., Penha-Lopes, G., Delefosse, M., Valdemarsen, T., Quintana, C., and Banta, G.: What is bioturbation? The need for a precise definition for fauna in aquatic sciences, Mar. Ecol.-Prog. Ser., 446, 285–302, 2012.
Kristensen, E., Delefosse, M., Quintana, C. O., Flindt, M. R., and Valdemarsen, T.: Influence of benthic macrofauna on ecosystem functioning in a shallow Danish estuary, Front. Mar. Sci., 1, 41, doi:10.3389/fmars.2014.00041, 2014.
Krom, M. D. and Berner, R. A.: Adsorbtion of phosfate in anoxic marine sediments, Limnol. Oceanogr., 25, 797–806, 1980. Kronvang, B., Jeppesen, E., Conley, D. J., Sondergaard, M., Larsen,
S. E., Ovesen, N. B., and Carstensen, J.: Nutrient pressures and ecological responses to nutrient loading reductions in Dan-ish streams, lakes and coastal waters, J. Hydrol., 304, 274–288, 2005.
Lomstein, B. A., Jensen, A. G. U., Hansen, J. W., Andreasen, J. B., Hansen, L. S., Berntsen, J., and Kunzendorf, H.: Budgets of sediment nitrogen and carbon cycling in the shallow water of Knebel Vig, Denmark, Aquat. Microb. Ecol., 14, 69–80, 1998. Lovley, D. R. and Phillips, E. J. P.: Rapid assay for microbially
re-ducible ferric iron in aquatic sediments, Appl. Environ. Microb., 53, 1536–1540, 1987.
Mackin, J. E. and Aller, R. C.: Ammonium adsorption in marine sediments, Limnol. Oceanogr., 29, 250–257, 1984.
Mackin, J. E. and Swider, K. T.: Organic matter decomposition pathways and oxygen consumption in coastal marine sediments, J. Mar. Res., 47, 681–716, 1989.
Mort, H. P., Slomp, C. P., Gustafsson, B. G., and Andersen, T. J.: Phosphorus recycling and burial in Baltic Sea sediments with contrasting redox conditions, Geochim. Cosmochim. Ac., 74, 1350–1362, 2010.
Mortazavi, B., Riggs, A. A., Caffrey, J. M., Genet, H., and Phipps, S. W.: The contribution of benthic nutrient regeneration to pri-mary production in a shallow eutrophic estuary, Weeks Bay, Al-abama, Estuar. Coast., 35, 862–877, 2012.
Nielsen, K. P. L. and Rasmussen, P.: Estuarine nitrogen reten-tion independently estimated by the denitrificareten-tion rate and mass balance methods: a study of Norsminde Fjord, Denmark, Mar. Ecol.-Prog. Ser., 119, 275–283, 1995.
Petersen, J. D., Rask, N., Madsen, H. B., Jorgensen, O. T., Pe-tersen, S. E., Nielsen, S. V. K., Pedersen, C. B., and Jensen, M.
H.: Odense Pilot River Basin: implementation of the EU Wa-ter Framework Directive in a shallow eutrophic estuary (Odense Fjord, Denmark) and its upstream catchment, Hydrobiologia, 629, 71–89, 2009.
Pitkanen, H., Lehtoranta, J., and Raike, A.: Internal nutrient fluxes counteract decreases in external load: the case of the estuarial eastern Gulf of Finland, Baltic Sea, Ambio, 30, 195–201, 2001. Quintana, C., Kristensen, E., and Valdemarsen, T.: Impact of the
invasive polychaete Marenzelleria viridis on the biogeochem-istry of sandy marine sediments, Biogeochembiogeochem-istry, 115, 95–109, 2013.
Riisgard, H. U. and Banta, G. T.: Irrigation and deposit feeding by the lugworm Arenicola marina, characteristics and secondary ef-fects on the environment, A review of current knowledge, Vie Milieu – Life and Environment, 48, 243–257, 1998.
Rozan, T. F., Taillefert, M., Trouwborst, R. E., Glazer, B. T., Ma, S. F., Herszage, J., Valdes, L. M., Price, K. S., and Luther, G. W.: Iron-sulfur-phosphorus cycling in the sediments of a shal-low coastal bay: implications for sediment nutrient release and benthic macroalgal blooms, Limnol. Oceanogr., 47, 1346–1354, 2002.
Sanz-Lazaro, C., Valdemarsen, T., Marin, A., Holmer, M., Effect of temperature on biogeochemistry of marine organic-enriched systems: implications in a global warming scenario, Ecol. Appl., 21, 2664–2677, 2011.
Seitzinger, S. P.: Denitrification in fresh-water and coastal marine ecosystems – ecological and geochemical significance, Limnol. Oceanogr., 33, 702–724, 1988.
Stookey, L. L.: Ferrozine – a new spectrophotometric reagent for iron, Anal. Chem., 42, 779–781, 1970.
Sundby, B., Gobeil, C., Silverberg, N., and Mucci, A.: The phos-phorous cycle in coastal marine sediments, Limnol. Oceanogr., 37, 1129–1145, 1992.
Tobias, C., Giblin, A., McClelland, J., Tucker, J., and Peterson, B.: Sediment DIN fluxes and preferential recycling of benthic mi-croalgal nitrogen in a shallow macrotidal estuary, Mar. Ecol.-Prog. Ser., 257, 25–36, 2003.
Tyler, A. C., McGlathery, K. J., and Anderson, I. C.: Benthic algae control sediment-water column fluxes of organic and inorganic nitrogen compounds in a temperate lagoon, Limnol. Oceanogr., 48, 2125–2137, 2003.
Valdemarsen, T. and Kristensen, E.: Diffusion scale dependent change in anaerobic carbon and nitrogen mineralization: true ef-fect or experimental artifact?, J. Mar. Res., 63, 645–669, 2005. Valdemarsen, T., Kristensen, E., and Holmer, M.: Metabolic
thresh-old and sulfide-buffering in diffusion controlled marine sedi-ments impacted by continuous organic enrichment, Biogeochem-istry, 95, 335–353, 2009.
Valdemarsen, T., Canal-Verges, P., Kristensen, E., Holmer, M., Kristiansen, M. D., and Flindt, M. R.: Vulnerability of Zostera marina seedlings to physical stress, Mar. Ecol.-Prog. Ser., 418, 119–130, 2010.
Valdemarsen, T., Wendelboe, K., Egelund, J. T., Kristensen, E., and Flindt, M. R.: Burial of seeds and seedlings by the lugworm Arenicola marina hampers eelgrass (Zostera marina) recovery, J. Exp. Mar. Biol. Ecol., 410, 45–52, 2011.
Valdemarsen, T., Quintana, C. O., Kristensen, E., and Flindt, M. R.: Recovery of organic enriched sediments through microbial degradation - implications for eutrophic estuaries, Mar. Ecol.-Prog. Ser., 503, 41–58, 2014.
Viktorsson, L., Ekeroth, N., Nilsson, M., Kononets, M., and Hall, P. O. J.: Phosphorus recycling in sediments of the central Baltic Sea, Biogeosciences, 10, 3901–3916, doi:10.5194/bg-10-3901-2013, 2013.
Wendelboe, K., Egelund, J. T., Flindt, M. R., and Valdemarsen, T.: Impact of lugworms (Arenicola marina) on mobilization and transport of fine particles and organic matter in marine sedi-ments, J. Sea Res., 76, 31–38, 2013.
Westrich, J. T. and Berner, R. A.: The role of sedimentary organic matter in bacterial sulfate reduction: the G-model tested, Limnol. Oceanogr., 29, 236–249, 1984.