Critical values of nitrogen indices in tomato plants grown in soil
and nutrient solution determined by different statistical procedures
(1)Paulo Cezar Rezende Fontes(2) and Cláudio Pagotto Ronchi(3)
Abstract – The objective of this study was to establish critical values of the N indices, namely soil-plant analysis development (SPAD), petiole sap N-NO3 and organic N in the tomato leaf adjacent to
the first cluster (LAC), under soil and nutrient solution conditions, determined by different statistical approaches. Two experiments were conducted in randomized complete block design with four repli-cations. Tomato plants were grown in soil, in 3 L pot, with five N rates (0, 100, 200, 400 and 800 mg kg-1) and
in solution at N rates of 0, 4, 8, 12 and 16 mmol L-1. Experiments in nutrient solution and soil were
finished at thirty seven and forty two days after transplanting, respectively. At those times, SPAD index and petiole sap N-NO3 were evaluated in the LAC. Then, plants were harvested, separated in
leaves and stem, dried at 70oC, ground and weighted. The organic N was determined in LAC dry matter.
Three statistical procedures were used to calculate critical N values. There were accentuated discrepan-cies for critical values of N indices obtained with plants grown in soil and nutrient solution as well as for different statistical procedures. Critical values of nitrogen indices at all situations are presented.
Index terms: Lycopersicon esculentum, nitrogen fertilizers, plant soil relations, statistical analysis.
Níveis críticos de índices de nitrogênio no tomateiro em solo e solução nutritiva determinados por diferentes procedimentos estatísticos
Resumo – O objetivo deste trabalho foi estabelecer os níveis críticos dos índices de N, SPAD ("soil-plant analysis development"), N-NO3 na seiva do pecíolo e N orgânico na folha adjacente ao primeiro
cacho do tomateiro (FAC), em solo e em solução nutritiva, determinados por diferentes procedimentos estatísticos. Foram conduzidos dois experimentos no delineamento em blocos casualizados, com quatro repetições. As plantas foram cultivadas em vasos contendo 3 L de solo, com cinco níveis de N (0, 100, 200, 400 e 800 mg kg-1) e, também, em solução nutritiva com 0, 4, 8, 12 e 16 mmol L-1 de nitrogênio.
Os experimentos em solução e em solo foram encerrados aos 37 e 42 dias após o transplante, respecti-vamente. Nesta ocasião, o índice SPAD e o teor de N-NO3 foram determinados na FAC. Em seguida, as
plantas foram colhidas, separadas em folhas e pecíolos, secadas a 70ºC, moídas e pesadas. Na matéria seca da FAC, foi determinado o N orgânico. Três procedimentos estatísticos foram utilizados para calcular o nível crítico. Verificaram-se acentuadas discrepâncias no valor do nível crítico dos índices de N obtidos com as plantas em solo e em solução nutritiva assim como utilizando-se diferentes procedi-mentos estatísticos. São apresentados os níveis críticos dos índices de N nas diversas situações.
Termos para indexação: Lycopersicon esculentum, adubo nitrogenado, relação planta-solo, análise estatística.
gen (N) a major influence on the productivity levels.
The goal of N management program should be
sup-plying enough N to achieve maximum profit from the
crop. But any N not used by the tomato crop is
po-tentially subjected to leaching, which pollutes
groundwater and decreases the efficiency of N
fer-tilization. Efficient N management program in
tomato production can be attained by suitable
evalu-ation of plant nutritional status (Coltman, 1988;
Smith & Loneragan, 1997), usually accomplished by
(1)Accepted for publication on January 7, 2002.
(2)Universidade Federal de Viçosa (UFV), CEP 36571-000 Viçosa, MG. CNPq fellow. E-mail: [email protected] (3)UFV, Dep. de Fitotecnia. E-mail: [email protected]
Introduction
Tomato (
Lycopersicon esculentum
Mill) is an
nitro-a qunitro-antitnitro-ative nitro-annitro-alysis for the totnitro-al N concentrnitro-ation,
involving dry ashing procedure.
Alternatively to the total N determination, quick
procedures have been proposed to evaluate tomato
N status as the petiole-sap nitrate (Coltman, 1988;
Hochmuth, 1994; Guimarães et al., 1998) and the
leaf greenness determination by a hand-held device
called Minolta SPAD (soil-plant analysis
develop-ment) meter (Guimarães et al., 1999; Sandoval-Villa
et al., 1999). SPAD index measured on plant leaves
were positively correlated to N sufficiency for
sev-eral crops (Piekielek & Fox, 1992; Blackmer &
Scherpers, 1995; Shapiro, 1999; Rodrigues et al., 2000)
and can be accepted as an N index.
Independently of the N index, the existence of
values accepted as the critical N concentration is
necessary to be used as a standard or reference.
Usu-ally, recommendation for critical values to evaluate
N status are derived from tomato field survey and or
field and greenhouse studies at soil and nutrient
so-lution conditions in which tomato plant responses
to a range of fertilizer rates are measured. Decision
concerning optimal values involves fitting by a model
that describes well the data. Model selection is a
major factor affecting which rate is identified as
being optimal (Cerrato & Blackmer, 1990).
A limited survey of published reports indicates
several models for best describing crop response to
N fertilization, which depends on the N rates high
enough to produce a clear maximum response,
spaced N levels to adequately model the
level-re-sponse relationship, appropriated plant growth, N
absorption rates and fruit yield and utilization of
variance analysis to estimate nutrient requirement
from level response data. As a result, numerous
stan-dard N index values are published. Besides the
cho-sen model as found for N rates (Cerrato & Blackmer,
1990), type and age of tissue sampled (Mills & Jones
Junior, 1996; Smith & Loneragan, 1997), and soil
type (Guimarães et al., 1999), selected yield level
and substrate characteristics may affect the values
to be used as a reference or critical level.
The objectives of this study were to establish
criti-cal ranges of N indices, namely SPAD, petiole sap
N-NO
3, and organic N, in the tomato leaf adjacent
to the first cluster under soil and nutrient solution
conditions, estimated by different statistical
ap-proaches.
Material and Methods
Two experiments were carried out at greenhouse con-ditions in the Universidade Federal de Viçosa, MG, Bra-zil. The first was in soil, and the second in nutrient solu-tion with tomato cultivar Santa Clara, in a randomized complete-block design with four replicates.
The first experiment was conducted on samples of the surface 20 cm of a silt clay soil. Soil samples were sieved thorough a 1 x 1 cm opening screen, air dried, limed with 2 g dm-3 and fertilized with P (435 mg kg-1) and K (100 mg kg-1). Five N levels were established, 0, 100, 200, 400 and 800 mg kg-1 by mixing (NH4)2SO4 with the soil. Then, the soil was placed into 3 kg pots. One tomato seedling was transplanted into each pot.
The aerated nutrient solution experiment was conducted in 8 L pots containing P, K, Ca, Mg and S at 2, 5.5, 4.5, 2 and 4 mmol L-1, respectively, and micronutrient concen-trations following Hoagland & Arnon (1950). Five N rates, 0, 4, 8, 12, and 16 mmol L-1 were evaluated, being 20% as N-NH4 and 80% as N-NO3. The solution was adjusted daily to pH 5.8±0.3 with NaOH or HCl and the pots volumes were completed with deionized water. One to-mato seedling was transferred to each pot.
After the beginning of the tomato plant reproductive phase, 37 and 42 days after seedling transplanting to solu-tion and soil experiments, respectively, petiole-sap nitrate (PSN) and SPAD (soil-plant analysis development) indi-ces were measured in the leaf adjacent to the cluster (LAC). A Minolta SPAD 502 meter was used to take chlorophyll readings, taken on the terminal leaflet of the LAC. Then, the LAC petiole base was cut at 2 cm from its insertion in the stem and crushed in a stainless steel garlic crusher. Sap was collected on the meter’s electrode (C-141 Cardy Ni-trate Meter - HORIBA, Inc.) and the N-NO3 concentra-tion was read at the digital meter. Then, the LAC was harvested, dried, ground to pass a 1 mm sieve, ashed with sulphuric acid and analyzed colorimetrically for organic N (Jackson, 1958). After SPAD and PSN determinations, the plant top was cut off at the cotyledonary node, and dried in a forced air oven at 70oC, and the shoot dry weight (SDW) was recorded.
maximum SDW obtained by equating the first derivatives of the best fitting model to zero, solving for X, substitut-ing the X values into the model and solvsubstitut-ing for Y. To esti-mate PSN, SPAD index and ORN critical values in both experiments, N rate associated to maximum SDW (CV100) was introduced into the best fit model previously deter-mined, which correlates PSN, SPAD index and ORN to N level. The model also was used to determine the PSN, SPAD index and ORN critical values associated to 99.9, 99, 95, and 90% of the maximum SDW.
By the procedure named two, the steps were the same as in number one, but the best fitting model, with biologi-cal logic, was chosen among only linear, quadratic and cubic models.
By the procedure named three, all models listed in the procedure number one were fitted to PSN, SPAD index and ORN as independent variables (X) and the SDW as the dependent variable (Y). In each experiment, the best fitting model with biological logic within the range of observed X values was used to estimate PSN, SPAD in-dex and NDM critical values at CV100, CV99.9, CV99, CV95, and CV90.
Results and Discussion
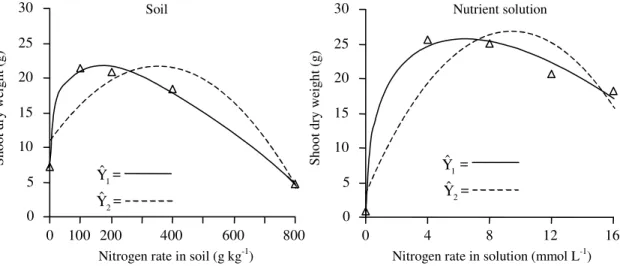
By the procedure named one, tomato shoot dry
weight (SDW) responded (p<0.01) to applied N
lev-els until they reached maximum values of 21.67 and
27.75 g plant
-1at 172 mg kg
-1and 6.35 mmol L
-1in soil
and nutrient solution, respectively (Figure 1).
By the procedure named two, the corresponded
val-ues were 21.71 and 26.97 g plant
-1at 351 mg kg
-1and
9.43 mmol L
-1, respectively (Figure 1). As expected,
less than maximum shoot dry weight was obtained
with lower N rates (Table 1). Several authors found
negative effects of high N levels in soil (Guimarães
et al., 1999) and in nutrient solution (Fontes et al.,
1995) on tomato SDW. N nutrition enhances
meta-bolic processes that influence the physicochemical
environment at the soil-root interface, interfere with
the uptake of cations and anions, enhance or repress
several enzyme system activities, and affect plant
growth patterns (Fernandes & Rossielo, 1995). High
N-NO
3levels decrease important aminoacids
forma-tion and change the vacuolar pH due to N-NO
3ac-cumulation (Mohamed et al., 1987) and high N-NH
4levels disrupt biological membranes, uncouple
pho-tophosphorylation, block ATP production, reduce
CO
2fixation and decrease nutrient absorption, mainly
Ca, Mg, and K (Claassen & Wilcox, 1974).
The two models predicted similar maximum SDWs
but N levels to achieve them in soil and nutrient
so-lution were in average 104% and 48% higher when
procedure two was utilized instead of procedure one
(Table 1). Tomato plants grown in solution were more
efficient to utilize N than plants in soil. In solution,
Figure 1. Relationships between tomato plant shoot dry weight and nitrogen application rate in soil established by procedures named one (Yˆ1= 7.263 + 2.259X0.5 – 0.0933X + 0.000366X1.5, R2 = 0.996) and two (
2
Yˆ = 10.998 + 0.0610X – 0.0000871X2, R2 = 0.794) and in nutrient solution established by procedures one (
1
Yˆ = 0.993 + 19.635X0.5 – 3.893X,
R2 = 0.989) and two ( 2
Yˆ = 3.762 + 4.9216X – 0.2605X2, R2 = 0.811). 0
5 10 15 20 25 30
0 100 200 400 600 800
Nitrogen rate in soil (g kg-1)
Sh
oo
t dr
y we
ig
ht
(g
)
1
Yˆ
=Soil
0 5 10 15 20 25 30
0 4 8 12 16
Nitrogen rate in solution (mmol L-1)
Sh
oo
t dr
y we
ig
ht
(g
)
Nutrient solution
2
Yˆ
=1
Yˆ
=2
estimated by model one, the maximum tomato SDWs
per g of added N was 312 mg and only 126 mg in soil,
that is 148% higher. The corresponded value
esti-mated by model two was 229% higher. Depending
on the growth conditions, N efficiency of young
to-mato plant would range from 27 (Sampaio et al., 1995)
to 332 mg g
-1(Guimarães et al., 1999).
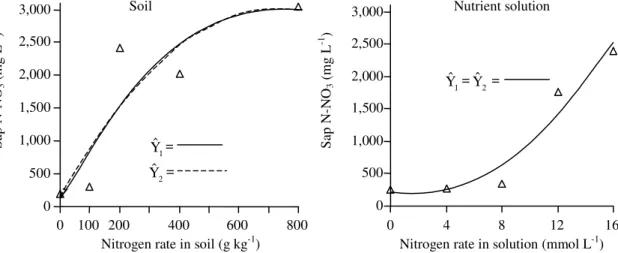
Estimated by procedures one and two,
pe-tiolesap nitrate levels in tomato plants grown in soil
(Figure 2) and SPAD indices (Figure 3) and
organic-nitrogen (Figure 4) values in plant grown in both soil
and nutrient solution were increased (p<0.01) by
in-creasing N rate up to determined value within the
experimental space; petiole-sap nitrate levels in
plants under nutrient solution conditions were
in-creased (p<0.01) by N rates. Sap test measures
N-NO
3present in xylem and phloem sap plus the
apoplastic, citosolic and vacuolar water. It is a direct
(1)In the procedure number one the best fitting model selected among linear, quadratic, square root, potential, exponential, hyperbolic, logarithmic and cubic root models was used; in the procedure number two only linear, quadratic and cubic models were used.
Percent of the maximum
Variable Procedure
number(1) 100 99.9 99 95 90
Soil (g plant-1)
One 21.67 21.65 21.45 20.58 19.50
SDW
Two 21.71 21.69 21.50 20.63 19.54
Nutrient solution (g plant-1)
One 25.75 25.73 25.50 24.47 23.18
Two 26.97 26.94 26.70 25.62 24.27
Soil (mg kg-1)
One 172 158 132 89 63
NL
Two 351 334 301 203 193
Nutrient solution (mmol L-1)
One 6.36 5.96 5.13 3.79 2.92
Two 9.43 9.11 8.41 7.15 6.21
Table 1. Tomato shoot dry weight (SDW) and nitrogen levels (NL) in soil and in nutrient solution predicted by proce-dures named one and two, at several percentage of the maximum.
Figure 2. Relationships between sap N-NO3 in tomato leaf adjacent to the first cluster and nitrogen application rate in
soil established by procedures named one (Yˆ1 = 146.425 – 40.498X0.5 + 14.711X – 0.344X1.5, R2 = 0.803) and two
(Yˆ2 = 153.615 + 7.920X – 0.00547X2, R2 = 0.796) and in nutrient solution by procedures one ( 1
Yˆ) and = two (Yˆ2) = 221.357 – 40.991X + 11.574X2, R2 = 0.943).
0 500 1,000 1,500 2,000 2,500 3,000
0 100 200 400 600 800
Nitrogen rate in soil (g kg-1)
S
ap
N-NO
3
(mg
L
-1 )
Soil
0 500 1,000 1,500 2,000 2,500 3,000
0 4 8 12 16
Nitrogen rate in solution (mmol L-1) Nutrient solution
S
ap
N-NO
3
(mg
L
-1 )
1
Yˆ =
2
Yˆ =
1
Figure 3. Relationships between SPAD (soil-plant analysis development) indices in tomato leaf adjacent to the first cluster and nitrogen application rate in soil established by procedures named one (Yˆ1 = 28.409 + 1.246X0.5 – 0.00549X –
0.000985X1.5, R2 = 0.945) and two ( 2
Yˆ = 30.639 + 0.0665X – 0.0000739X2, R2 = 0.827) and in nutrient solution by
procedures one (Yˆ1 = 15.371 + 7.308X0.5 – 0.917X, R2 = 0.986) and two ( 2
Yˆ = 16.551 + 2.289X – 0.0923X2, R2 = 0.898).
measure of current N supply and is markedly affected
by many factors among them the light intensity
(Fukuda et al., 1999).
The SPAD index of plant leaves supplied with
high amount of N were significantly greater than
when low amount or no N was applied (Figure 3). It
was also greater in plants grown in soil than in
solu-tion. The SPAD index detects the transmittance of
light emitted by two diodes, one with a peak
absor-bance at 650 nm and the other one at 940 nm. In the
first one, there was high light absorptance by
chlo-rophyll and in the second one light absorptance was
0 10 20 30 40 50
0 4 8 12 16
Nitrogen rate in solution (mmol L-1)
S
PA
D in
di
ces
Nutrient solution
0 10 20 30 40 50
0 100 200 400 600 800
Nitrogen rate in soil (g kg-1)
S
PA
D in
di
ces
Soil
1
Yˆ =
2
Yˆ =
1
Yˆ =
2
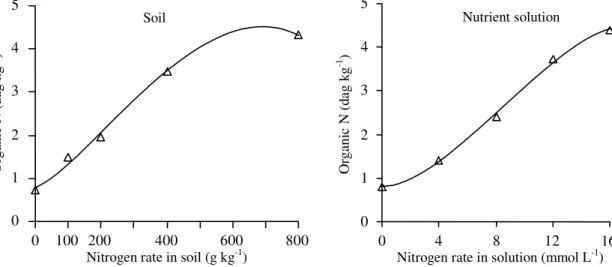
Yˆ =
Figure 4. Relationships between organic nitrogen in tomato leaf adjacent to the first cluster and nitrogen application rate in soil established by procedures named one (Yˆ1) and = two (Yˆ2) = 0.781 + 0.00496X + 0.00000945X2 –
0.00000000127X3, R2 = 0.997) and in nutrient solution by procedures one ( 1
Yˆ) and = two (Yˆ2) = 0.807 + 0.0244X + 0.0335X2 – 0.00131X3, R2 = 0.998).
0
1
2
3
4
5
0
100 200
400
600
800
Nitrogen rate in soil (g kg-1)
Orga
nic
N
(da
g kg
-1 )
0
1
2
3
4
5
0
4
8
12
16
Nitrogen rate in solution (mmol L-1)
Or
ga
ni
c N
(d
ag
kg
-1 )
negligible. So, the SPAD index represents the light
transmittance ratio through the leaf tissue at those
wavelengths and may be used to provide a rapid
estimate of leaf transmittance and reflectance in the
field (Madeira et al., 2000).
Peculiar to plant species (Marquard & Tipton,
1987) and growth conditions (Campbell et al., 1990;
Guimarães, 1998), positive relationship has been
dem-onstrated between SPAD readings and chlorophyll
contents in leaves. With increase in chlorophyll
con-tent, light absorption by plant leaves increases.
Chlo-rophyll is responsible for leaf greenness and
gener-ally recognized as an indication of N status for many
crops. Intensity of green colour leaves has been used
as an index of N concentration in the leaves (Takebe
et al., 1990) as long as the concentration of N in
ni-trate form be low. Ali et al. (1999) found that
N-defi-cient yellowish leaves contained small amounts of
RuBisCO but when excess of N fertilizer is applied,
the leaves function was significantly less efficient in
spite of high chlorophyll and RuBisCO contents.
Tomato leaf green color was less intense in
solu-tion culture than in soil as indicated by the SPAD
values (Figure 2). Due to position in the greenhouse,
plants grown in nutrient solution were more shaded
than in soil influencing the light irradiance on
to-mato which may affect chloroplast orientation in
leaves (Hoel & Solhaug, 1998). Furthermore, in
solu-tion P, Mg, Mn, Zn, Cu, Fe, S, and K concentrasolu-tions
in leaves were lower than in leaves of tomato plants
grown in soil. The inverse was true for Ca and B.
Partial Ca and Mg deficiencies but K decreased
chlorophyll contents in lemon leaves (Lavon et al.,
1999).
Relationships between N indices and tomato
shoot dry weight (SDW), under soil and nutrient
solution, which were utilized for critical level
deter-mination by procedure named three, are presented
(Table 2). In all situations, but SPAD indices in plants
grown in soil, SDW values increased with
increas-ing N indices up to a maximum point which was the
critical value (CV
100) estimated by procedure named
three (Table 3). CV
100for SPAD index in soil was 44.4,
estimated with the maximum observed SDW value
(22.15 g plant
-1).
As expected, all critical N indices in tomato plants
grown in soil and nutrient solution were higher when
100% maximum shoot dry weight was selected
(Table 3). Higher maximum values selection implied
in relatively low decrease in shoot dry weight and
high decrease in N rates (Table 1). There were
con-siderable disagreement among the statistical
proce-dures, substrates and yield levels selected to
esti-mate critical N indices in tomato leaf, indicating a
need to emphasize them when setting critical values
(Table 3).
As the price of N fertilizer decreases relatively to
the price of tomato fruit, high percentage of the
maxi-mum yield should be chose but fertilization levels of
N to give 100% of fruit yield usually are not
eco-nomic and/or ecological optimal. In this paper, it is
assumed that N index estimated by procedures one
and three for 99% of the maximum shoot dry weight
are the critical range values (CV
99).
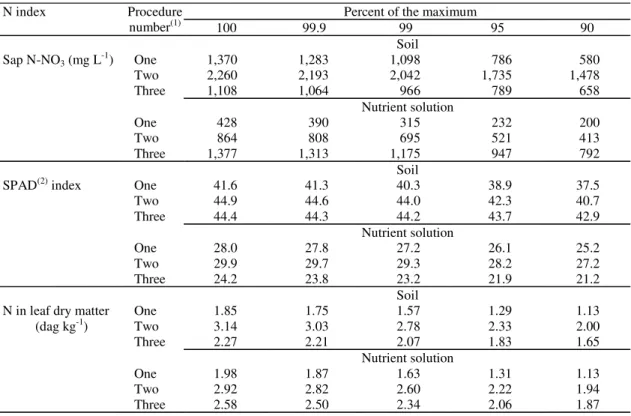
(1)SPAD: soil-plant analysis development. (2)DM: dry matter.
N indices (X) Regression equations R2
Soil
Sap N-NO3 (mg L-1) Yˆ = 9.564 + 0.0266X – 0.0000120X2 0.558
SPAD(1) index
Yˆ = 206.530 – 77.0726X0.5 + 7.414X 0.545
N in leaf DM(2) (dag kg-1)
Yˆ = –17.025 + 1.5409X0.5 + 50.287X – 22.0837X1.5 0.959
Nutrient solution
Sap N-NO3 (mg L-1) Yˆ = –20.727 + 2.664X0.5 – 0.0359X 0.427
SPAD index Yˆ = –611.473 + 260.1946X0.5 – 26.469X 0.989
N in leaf DM (dag kg-1)
Yˆ = –102.045 + 163.2808X0.5 – 50.827X 0.876
In soil, PSN critical concentrations for CV
99esti-mated by procedures one and three ranged from 966
to 1,098 mg L
-1(Table 3). Corresponding values in
nutrient solutions were 315 to 1,175 mg L
-1(Table 3).
Published values of optimum PSN are 1,000 to 1,200
(Hochmuth, 1994); 1,091 (Coltman, 1987); 960 to 1,160
in spring tomato crop or 776 to 996 for the fall crop
(Rhoads et al., 1996); and 2,581 mg L
-1in situation
with six N applications (Guimarães et al., 1998).
Critical SPAD indices for CV
99estimated by
pro-cedures one and three ranged from 40.3 to 44.2 in
plants under soil conditions and the corresponding
values in plants grown in nutrient solution were 27.2
to 23.2 (Table 3). SPAD index measures leaf
green-ness ranging from 0 to 80 with a higher number
rep-resenting a greener leaf (Dwyer et al., 1995). At two
different soil type, SPAD critical values in tomato
leaf adjacent to the cluster measured at flowering
stage were 35.5 and 46.5 (Guimarães et al., 1999). SPAD
values of 43.4 and 52.0 in corn were established to
distinguish between responsive and non-responsive
site to sidedress N (Piekielek & Fox, 1992; Smeal &
Zhang, 1994; Piekielek et al., 1995).
In plants grown in soil, leaf organic N critical
concentrations for CV
99estimated by procedures one
and three ranged from 1.57 to 2.07 dag kg
-1and the
corresponding values in plants grown in nutrient
solution were 1.63 to 2.34 dag kg
-1(Table 3). These
values are lower than 2.80 to 4.20 dag kg
-1indicated
by Mills & Jones Junior (1996) for tomato plants
under greenhouse conditions. There are also lower
than 3.02 and 3.43 dag kg
-1found by Sampaio et al.
Table 3. Critical values of nitrogen indices in tomato leaf adjacent to the first cluster (LAC) associated with different percentages of the maximum shoot dry weight in soil and nutrient solution determined by three different statistical procedures.
Percent of the maximum
N index Procedure
number(1) 100 99.9 99 95 90
Soil
One 1,370 1,283 1,098 786 580
Two 2,260 2,193 2,042 1,735 1,478
Three 1,108 1,064 966 789 658
Nutrient solution
One 428 390 315 232 200
Two 864 808 695 521 413
Sap N-NO3 (mg L-1)
Three 1,377 1,313 1,175 947 792
Soil
One 41.6 41.3 40.3 38.9 37.5
Two 44.9 44.6 44.0 42.3 40.7
Three 44.4 44.3 44.2 43.7 42.9
Nutrient solution
One 28.0 27.8 27.2 26.1 25.2
Two 29.9 29.7 29.3 28.2 27.2
SPAD(2) index
Three 24.2 23.8 23.2 21.9 21.2
Soil
One 1.85 1.75 1.57 1.29 1.13
Two 3.14 3.03 2.78 2.33 2.00
Three 2.27 2.21 2.07 1.83 1.65
Nutrient solution
One 1.98 1.87 1.63 1.31 1.13
Two 2.92 2.82 2.60 2.22 1.94
N in leaf dry matter (dag kg-1)
Three 2.58 2.50 2.34 2.06 1.87
(1995) and Guimarães et al. (1998) for tomato plants
grown in nutrient solution and soil under greenhouse
conditions, respectively. Several reasons led to
dif-ferent critical levels being the timing of N
applica-tion, that is N availability, and the sink demand or
dry matter yield the most significatives. In both
ex-periments, tomato plants were harvested before fruit
setting and it would be interesting to test if so small
N concentrations in leaf tissue maintained through
the entire plant cycle by daily or weekly N additions
would led to profitable fruit yield.
Conclusion
Critical values of nitrogen indices in tomato plant
leaf depend on substrate and statistical procedure
utilized.
References
ALI, K.; NII, N.; YAMAGUCHI, K.; NISHIMURA, M. Levels of nonstructural carbohydrate in leaves and roots and some characteristics of chloroplasts after application of different amounts of nitrogen fertilizer to peach seed-lings. Journal of the Japanese Society for Horticul-tural Science, v. 68, p. 717-723, 1999.
BLACKMER, T. M.; SCHERPERS, J. S. Use of a chlo-rophyll meter to monitor nitrogen status and schedule fertigation for corn. Journal of Production Agriculture, Madison, v. 8, p. 56-60, 1995.
CAMPBELL, R. J.; MOBLEY, K. N.; MARINI, R. P.; PFEIFFER, D. G. Growing conditions alter the relation-ships between SPAD-501 values and apple leaf chloro-phyll. HortScience, Alexandria, v. 25, p. 330-331, 1990.
CERRATO, M. E.; BLACKMER, A. M. Comparison of models for describing corn yield response to nitrogen fertil-izer. Agronomy Journal, Madison, v. 82, p. 138-143, 1990.
CLAASSEN, M. E. T.; WILCOX, G. E. Effect of nitro-gen forms on growth and composition of tomato and peas tissue. Journal of the American Society for Horticul-ture Science, Alexandria, v. 99, p. 171-174, 1974.
COLTMAN, R. R. Sampling considerations for nitrate quick tests of greenhouse grown tomatoes. Journal of the American Society for Horticulture Science, Alex-andria, v. 112, p. 922-927, 1987.
COLTMAN, R. R. Yields of greenhouse tomatoes man-aged to maintain specific petiole sap nitrate level. HortScience, Alexandria, v. 23, n. 1, p. 148-151, 1988.
DWYER, L. M.; ANDERSON, A. M.; MA, B. L.; STEWART, D. W.; TOLLENAAR, M.; GREGORICH, E. Quantifying the nonlinearity in chlorophyll meter response to corn leaf nitrogen concentration. Canadian Journal of Plant Science, Ottawa, v. 75, p. 179-182, 1995.
FERNANDES, M. S.; ROSSIELO, R. O. P. Mineral ni-trogen in plant physiology and plant nutrition. Critical Reviews in Plant Sciences, Boca Raton, v. 14, n. 2, p. 111-148, 1995.
FONTES, P. C. R.; GOMES, J. M.; PEREIRA, P. R. G.; MARTINEZ, H. E. P. Nível crítico de N-NO3 em pecíolos de tomateiro extraído por diferentes métodos. Horticultura Brasileira, Brasília, v. 13, n. 1, p. 11-13, 1995.
FUKUDA, N.; MIYAGI, M.; SUZUKI, Y.; IKEDA, H.; TAKAYANAGI, K. Effects of supplemental night light-ing and NO3-exclusion on the growth and NO3 -concentra-tion in the leaf sap of greenhouse-grown spinach under NFT. Journal of the Japanese Society for Horti-cultural Science, Tokyo, v. 68, n. 1, p. 146-151, 1999.
GUIMARÃES, T. G. Nitrogênio no solo e na planta, teor de clorofila e produção do tomateiro, no campo e na estufa, influenciados por doses de nitrogênio. 1998. 184 f. Tese (Doutorado) - Universidade Federal de Viçosa, Viçosa.
GUIMARÃES, T. G.; FONTES, P. C. R.; PEREIRA, P. R. G.; ALVAREZ VENEGAS, H. V.; MONNERAT, P. H. Determinação dos teores de nitrogênio na seiva do tomateiro por meio de medidor portátil. Horticultura Brasileira, Brasília, v. 16, n. 2, p. 144-151, 1998.
GUIMARÃES, T. G.; FONTES, P. C. R.; PEREIRA, P. R. G.; ALVAREZ VENEGAS, H. V.; MONNERAT, P. H. Teores de clorofila determinados pela metodologia convencional e por medidor portátil, suas correlações e a relação com formas de nitrogênio em folhas de tomateiros, cultivados em dois tipos de solos. Bragantia, Campinas, v. 58, n. 1, p. 209-216, 1999.
HOCHMUTH, G. J. Sufficiency ranges for nitrate-nitro-gen and potassium for vegetable petiole sap quick tests. HortTechnology, Alexandria, v. 4, p. 218-222, 1994.
HOEL, B. O.; SOLHAUG, K. A. Effect of irradiance on chlorophyll estimation with the Minolta SPAD-502 leaf chlorophyll meter. Annals of Botany, London, v. 82, p. 389-392, 1998.
JACKSON, M. L. Soil chemical analysis. Englewood Cliffs: Prentice Hall, 1958. 498 p.
LAVON, R.; SALOMON, R.; GOLDSCHMIDT, E. E. Effects of K, Mg, and Ca deficiencies on nitrogen con-stituents and chloroplast components in citrus leaves. Jour-nal of the American Society for Horticultural Science, Alexandria, v. 124, n. 2, p. 158-162, 1999.
MADEIRA, A. C.; MENDONÇA, A.; FERREIRA, M.; TABORDA, M. L. Relationship between spectro-radiometric and chlorophyll measurements in green beans. Communications in Soil Science and Plant Analysis, New York, v. 31, p. 631-643, 2000.
MARQUARD, R. D.; TIPTON, J. L. Relationship be-tween extractable chlorophyll and an in situ method to estimate leaf greenness. HortScience, Alexandria, v. 22, n. 6, p. 1327, 1987.
MILLS, H. A.; JONES JUNIOR, J. B. Plant analysis handbook II. Athens, United States: MicroMacro, 1996. 422 p.
MOHAMED, A.; EL-SOKKARY, I.; TUCKER, T. Growth and chlorophyll, mineral and total amino acid composi-tion of tomato and wheat plants in relacomposi-tion to nitrogen and iron nutrition. II. Chlorophyll content and total amino acid composition. Journal of Plant Nutrition, New York, v. 10, p. 713-731, 1987.
PIEKIELEK, W. P.; FOX, R. H. Use of a chlorophyll meter to predict sidedress nitrogen requirements for maize. Agronomy Journal, Madison, v. 84, p. 59-65, 1992.
PIEKIELEK, W. P.; FOX, R. H.; TOTH, J. D.; MacNEAL, K. E. Use of a chlorophyll meter at the early dent stage of
corn to evaluate nitrogen sufficiency. Agronomy Jour-nal, Madison, v. 87, p. 403-408, 1995.
RHOADS, F. M.; OLSON, S. M.; HOCHMUTH, G. J.; HANLON, E. A. Yield and petiole-sap nitrate levels of tomato with N rates applied preplant or fertigated. Soil and Crop Science Society of Florida Annual Proceed-ings, Gainesville, v. 55, p. 9-12, 1996.
RODRIGUES, F. A.; FONTES, P. C. R.; MARTINEZ, H. E. P.; PEREIRA, P. R. G. Nível crítico do índice SPAD na folha da batateira, em solução nutritiva. Horticultura Brasileira, Brasília, v. 18, p. 764-765, 2000.
SAMPAIO, R. A.; FREITAS, J. A.; YUPANQUI, F. F. R.; FONTES, P. C. R.; MARTINEZ, H. E. P.; PEREIRA, P. R. G. Níveis críticos de N-NO3 e N-orgânico em pecíolos de tomateiro de crescimento determinado. Revista Ceres, Viçosa,MG, v. 42, p. 444-452, 1995.
SANDOVAL-VILLA, M.; WOOD, C. W.; GUERTAL, E. A. Ammonium concentration in solution affects chloro-phyll meter readings in tomato leaves. Journal of Plant Nutrition, New York, v. 22, p. 1717-1729, 1999.
SHAPIRO, C. A. Using a chlorophyll meter to manage nitrogen applications to corn with high nitrate irrigation water. Communications in Soil Science and Plant Analysis,New York, v. 30, p. 1037-1049, 1999.
SMEAL, D.; ZHANG, H. Chlorophyll meter evaluation for nitrogen management in corn. Communications in Soil Science and Plant Analysis, New York, v. 25, p. 1495-1503, 1994.
SMITH, F. W.; LONERAGAN, J. F. Interpretation of plant analysis: concepts and principles. In: REUTER, D. J.; ROBINSON, J. B. (Ed.). Plant Analysis: an interpreta-tion manual. 2. ed. Collingwood: Commonwealth Scien-tific and Industrial Research Organization, 1997. p. 3-33.