E-learning System Which Allows Students
’
Confidence Level Evaluation with Their Voice When
They Answer to the Questions During Achievement
Tests
Kohei Arai
1Graduate School of Science and Engineering Saga University
Saga City, Japan
Abstract— E-learning system which allows students’ confidence level evaluation with their voice when they answer to the question during achievement tests is proposed. Through experiments of comparison of students’ confidence level between the conventional (without evaluation) and the proposed (with evaluation), 17-57% of improvement is confirmed for the proposed e-learning system.
Keywords- learnng system; confidence level evaluation; emotion recognition with voice.
I. INTRODUCTION
Under the ADL: Advanced Distributed Learning Initiatives1, Sharable Content Object Reference Model: SCORM2 which is a collection of standards and specifications for web-based e-learning is promoted [1]. It defines communications between client side content and a host system called the run-time environment, which is commonly supported by a learning management system. Reusability, accessibility, inter-operability, and maintainability are important for the SCORM standard.
One of the issues to be discussed for the conventional e-learning system is that improvement of achievement level. In other word, effectiveness of the learning system as well as e-learning contents is one of the major issues. Although there are many suspected causes, quality of achievement test is one of them. Namely, students can precede one step forward even if they do not have confidence. Because only think students have to do is click a supposed appropriate radio button among four or five candidate radio button as possible answers. Thus the students may get trouble when they get one step advance even if they do not have confidence.
E-learning system can be divided into two categories, synchronous and on-demand type. In particular, the synchronous type includes a quasi-real time based Q and A systems. Students may get an answer when they make a question. Therefore, effectiveness of the synchronous type is better than the on-demand type. For both types of e-learning
1 http://www.adlnet.org/
2 http://en.wikipedia.org/wiki/Sharable_Content_Object_Reference_Model
system, achievement tests are important. The proposed e-learning system allows check confidence levels during achievement tests. Therefore, achievement test results can be evaluated much properly rather than that without confidence evaluations. Confidence level evaluation can be done with students’ voice for the proposed e-learning system.
In the following section, the proposed e-learning system is described followed by some experiments with students. Then conclusion with some discussions is flowed.
II. PROPOSED E-LEARNING SYSTEM
A. Fundamentals of Confidence Level Evaluations
It is assumed that voice input and output software is installed in the proposed e-learning system in advance. In particular, voice input and output software is used for confidence level evaluation during achievement tests period. If confidence level is not high enough, then such students have to conduct another achievement test again.
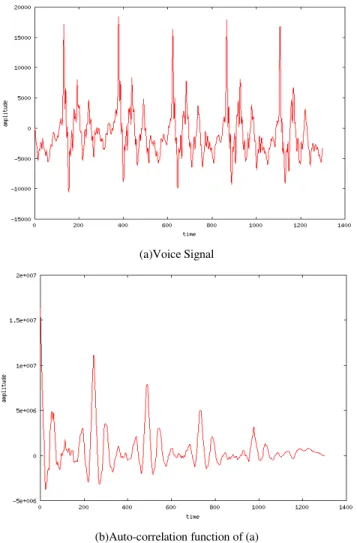
There are some methods which allow evaluation of confidence level with students’ voices and moving pictures during they answer to questions in achievement tests. With moving picture, it can be recognized that students are ill at ease, or are not in a calm situation in particular during achievement test. It is much easy to check students’ confidence level using their voice. Frequency components as well as loudness of voice can be used. These features are referred to pitch frequency3 and power level, hereafter. The pitch frequency is defined as fundamental frequency which can be estimated with auto-correlation function, rl of human
voice signals (equation (1)).
(1)
where N and xt denotes the number of samples of voice
signals and voice signal itself, respectively. The typical human voice signal is shown in Fig.1 (a) while typical
3 http://en.wikipedia.org/wiki/Pitch_detection_algorithm
r
l=
1
N
∑
t=0N−l−1
correlation function4 is shown in Fig.1 (b). From the auto-correlation function, pitch frequency can be determined.
(a)Voice Signal
(b)Auto-correlation function of (a)
Figure 1 Typical human voice signal and its auto-correlation function. On the other hand, students’ voice loudness, power level, P can be calculated with equation (2).
(2)
B. Evaluation of Students’ Confidence Level
Fig.2 shows an example of two dimensional scatter plots of the pitch frequency and the power level of the students’ voices during achievement tests. Typical scatter plot of students’ voices during achievement tests in the two dimensional distribution between pitch frequency and power level is shown in Fig.3. In general, students’ voices that have a high confidence level during achievement tests are loud and include high pitch frequency components while students’ voices that do not have enough confidence level during achievement tests are not loud and do not include enough high pitch frequency components.
4 http://en.wikipedia.org/wiki/Autocorrelation
It depends on personal voice characteristics. The student whose voice includes high pitch frequency components usually there are high pitch frequency components during achievement tests as well. The student who speaks loudly always answers to the questions loudly. Therefore, some normalization is required for pitch frequency and loudness during achievement test by using those in calm status (Normal situation).
Figure 2 Example of scatter plot of students’ voice between pitch frequency and power level during achievement tests.
Figure 3Typical scatter plot of students’ voices during achievement tests in the two dimensional distribution between pitch frequency and power level Just before getting start achievement tests, each student has to say their student ID and their name. The proposed e-learning system, then, input their voice and plot their pitch frequency and power level on two dimensional scatter diagrams as those in calm status or normal situation. After that, student begins achievement tests. Pitch frequency and power level of students’ voice is plotted on the same two dimensional feature planes. Then, gravity center5 is calculated in a real time basis.
5 http://ejje.weblio.jp/content/center+of+gravity
P
=
√
∑
Ni=0
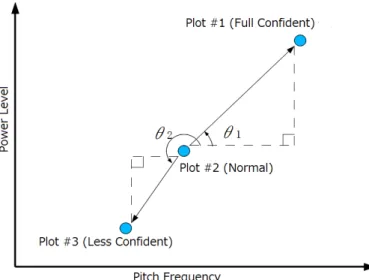
Fig.4 shows gravity centers of students’ voice of pitch frequency and power level. Plot #1 denotes the gravity center of the students’ voice plots of which students have a high confidence level while Plot #2 denotes the gravity center of the students’ voice plots of which students are in calm status or normal situation. Plot #3, on the other hand, denotes the gravity center of the students’ voice plots of which students do not have a high confidence level during answering to the questions in achievement tests.
Figure 4 Gravity centers of students’ voice plots on the two dimensional feature plane between pitch frequency and power level when students get start their achievement tests and when answering to the questions in achievement tests..
During scatter plots of pitch frequency and power level, cluster analysis can also be applied to the data plots. There are some clustering methods6. The proposed e-learning system uses hierarchical clustering method for human emotion recognitions. There are minimum distance, maximum distance, gravity, median, Ward’s methods in the hierarchical clustering method. The proposed method uses Dendrogram7 utilized Ward’s method8
[2]. It is one of hierarchical clustering method based on the following equation for representation of dis-similarity9, dtr between two clusters, t and r, which are
created from cluster p and q,
(3)
where ni denotes the number of data in the cluster i in
concern. Thus clusters are created by step by step basis as shown in Fig.6. Starting from dark blue and yellow, through light blue and orange, then purple, and finally green colored cluster is created eventually.
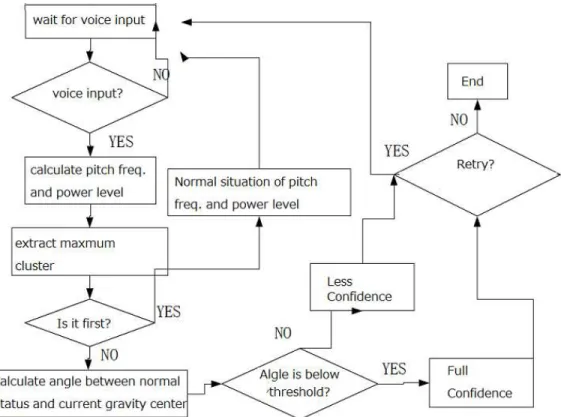
Process flow of these processes is shown in Fig.7.
6 http://en.wikipedia.org/wiki/Cluster_analysis 7 http://en.wikipedia.org/wiki/Dendrogram 8 http://en.wikipedia.org/wiki/Ward's_method 9 http://en.wikipedia.org/wiki/Hierarchical_clustering
Figure 5 Example of Dendrogram
Figure 6 Clusters creation for Ward’s method of clustering method III. IMPLEMENTATION AND EXPERIMENTS
A. Implementation
The proposed e-learning system is implemented on a Windows XP OS machine. Question and answer system and e-learning contents are created with Java script with Internet Explore of web browser. On the other hand, students’ emotion recognition software is created with gcc of C programming language. It contains real time voice recognition software tool. Screen shot image is shown in Fig.8.
B. Experiments
10 students are participated the experiment. Firstly, students have to input their voice, just say their names, to the proposed e-learning system in a calm status, normal situation. Then the pitch frequency and power level is plotted on feature plane. After that gravity center of the scatter plots is determined and it becomes standard axis for determination of the angle which corresponds to confidence level.
Through the experiments with 10 students, around 87.6% of confident or not confident classification performance is confirmed by comparing subjective and objective evaluation of confidence levels. 10 questions which include three programming Language related questions from Synthetic Personality Inventory: SPI test, three general questions from SPI test which are not related to programming language, and four questions of physics are provided to each student.
d
tr=
n
p+
n
rn
t+
n
r
d
pr+
n
q+
n
rn
t+
n
r
d
qr−
n
rn
t+
n
r
d
pqA B C D E F G
Figure 7 Process flow of the proposed e-learning system with students’ confidence level evaluation using their voices during achievement tests
Figure 8 Screen shot image of e-learning content on web browser. Then students have to take look at the explanations for each question. If the proposed e-learning system decides the student does not have enough confidence, then such students have to have another 10 questions of which the difficulty of the questions are almost same as previous questions. After that, the score of the tests before and after the retry test.
Also, pre-exercise is prepared. Pre-exercise uses the explanation of questions. The experiments are conducted with and without pre-exercise. The experimental results with and without pre-exercise is shown in Table 1. In the table, elapsed time is also evaluated. It takes much long time for the first test with pre-exercise in comparison to the elapsed time for the first test without pre-exercise. This is because students have to read the explanations for the questions first then answer to the questions. The elapsed time for the second test with
pre-exercise is very fast because most of students feel confidence to their answer.
TABLE I. ACHIEVEMENT TEST RESULTS WITH AND WITHOUT PRE -EXERCISE OF THE FIRST AND SECOND TESTS
Pre Exercise
Average Score
Elapsed Time(s)
Without 1st Test 68 13'11"
2nd Test 54 13'03"
Improvement -20% 26'14"
with 1st Test 48 29"33"
2nd Test 62 8'58"
Improvement 29% 38'31"
TABLE II. CHIEVEMENT TEST RESULTS WITH AND WITHOUT PRE -EXERCISE OF THE FIRST AND SECOND TESTS FOR EACH SUBJECT
Pre Exercise Language General Physics
without 1st Test 28 18 20
2nd Test 12 18 18
Improvement -117% 0% -10%
with 1st Test 12 14 22
2nd Test 14 22 26
Improvement 16.70% 57.10% 18.20%
physics is essentially good. That is the reason for the improvement depends on subject. On the other hand, general questions are essentially easy to answer and students feel a little bit confusion. Students have careless mistakes at the first test even if they have pre-exercises. Therefore, students answer to the questions without confidence. The confusion, however, disappears in the second test. Therefore, improvement of the score is remarkable.
After the experiments, we conduct interviews for each student. Their impressions are almost same as the previously supposed aforementioned reasons.
IV. CONCLUSION
E-learning system which allows students’ confidence level evaluation with their voice when they answer to the question during achievement tests is proposed. Through experiments of comparison of students’ confidence level between the conventional (without evaluation) and the proposed (with evaluation), 17-57% of improvement is confirmed for the proposed e-learning system.
Further improvement is required for human emotion recognition performance with several sources, not only pitch frequency and loudness of voice but also students’ motions and eye movement using moving pictures.
ACKNOWLEDGMENT
The author would like to thank Mr. Hiroshi Yoshida for his effort to the experiments.
REFERENCES
[1] Mikio Takagi, Haruhisa Shimoda Ed. Kohei Arai et al., Image Analysis Handbook, The University of Tokyo Publishing Inc., 1991.
[2] Kohei Arai, Hiroshi Yoshida, e-learning system with confidence evaluation using student voice, Technical Notes of Faculty of Science and Engineering, Saga University, 36, 1, 39-44, 2007.
AUTHORS PROFILE