Universidade NOVA de Lisboa
Escola Nacional de Saœde Pœblica
Impact of vertical integration on the readmission of individuals with
chronic conditions
Master in Health Management
îscar Ricardo Brito Fernandes
Universidade NOVA de Lisboa
Escola Nacional de Saœde Pœblica
Impact of vertical integration on the readmission of individuals with
chronic conditions
Dissertation presented to Escola Nacional de Saœde Pœblica in partial fulfilment of the requirements for the Degree of Master in Health Management, developed under the
supervision of Professor Rui Santana and Professor S’lvia Lopes.
ACKNOWLEDGMENTS
I am grateful to my supervisors, Professor Rui Santana and Professor S’lvia Lopes, whose expertise, support, and generous guidance made it possible for me to develop this study. It was a huge privilege and pleasure to embark on this journey with both of them.
I want to thank Ana Patr’cia Marques, Bruno Moita and Jo‹o Sarmento for all the methodological discussions and support.
I am also indebted to Portuguese Central Administration for Healthcare System (ACSS) for providing the administrative datasets for this work; Centers for Medicare and Medicaid Services for answering so promptly to all my questions and requests; and to Escola Nacional de Saœde Pœblica and its staff for providing me the best working and learning environment possible.
I would like to express my gratitude to all my teachers who put their faith in me and urged me to do better, with special thanks to Professor Adalberto Campos Fernandes, Professor Alexandre Abrantes, Professor Ana Escoval, Professor Carlos Costa, Professor Jo‹o Pereira, Professor Paulo Boto, and Professor Pedro Aguiar.
I want to acknowledge all my classmates who have attended this Master programme with me for the opportunity to learn from their experiences, with special thanks to Joana Fernandes and Ana Resende for being present, for their friendship and support throughout all phases. I would also like to emphasise the recent friendship with Ana Antunes, who became a strong support throughout the development of this work.
I would like to thank Professor Rui Baptista-Gon•alves for his friendship and help on revising the writing of this dissertation.
My deepest gratitude goes to S—nia Bernardes Mateus, whose love, friendship, and care made this entire journey possible. I will always be indebted for what you have done for me.
I want to acknowledge Professor Margarida CŽsar. Despite not intervening directly on this work, the way I see myself as a research is greatly influenced by her.
I also want to thank my parents and brothers for all their love and support throughout my life.
The only true voyage of discovery, the only fountain of Eternal Youth, would be not to visit strange lands but to possess other eyes, to behold the universe through the eyes of another, of a hundred others, to behold the hundred universes that each of them beholds, that each of them is (É).
ABSTRACT
INTRODUCTION: Ageing populations and the increasing prevalence of multimorbidity are a challenge for healthcare delivery and health system design. Integrated care has been discussed as a solution to address these challenges. In Portugal, Local Health Units (LHU) promote vertical integration of healthcare, with one of the expected effects being a decrease of readmission rates in individuals with chronic conditions. Readmissions are frequently studied for its negative impacts on individuals, carers, and providers, with excessive unplanned readmission rates among hospitals being a sign of frail integrated care. Thus, we assume as the main aim of this study to assess the impact of vertical integration on the readmission of individuals with chronic conditions.
METHODS: A database including administrative data from 1 679 634 inpatient episodes from years 2002-14 was considered. We identified readmissions with the hospital-wide all-cause unplanned readmission measure methodology of Centers for Medicare and Medicaid Services. The considered outcome was 30-day hospital-wide all-cause unplanned readmissions (1: readmitted), and risk-standardized readmission ratio. Chronic conditions were identified from all diagnoses coded with International Classification of Diseases Ð 9th version Ð Clinical Modification codes (1: chronic). In order to assess the impact of LHU on the readmission of individuals with chronic conditions, we compared 30-day readmissions before and after the creation of each LHU. We used difference-in-differences technique to address our main aim. In addition, to understand the associations between individualsÕ risk factors and time to readmission, we developed a Cox regression model for LHU and control group.
CONCLUSIONS: Individuals with chronic conditions faced higher risk of readmission, despite vertical integration phenomena. In order to promote better healthcare to these individuals, namely protecting them from readmission, healthcare organizations should develop integrated care pathways for the most prevalent chronic conditions on their catchment area, revise discharge processes, continuously evaluate health outcomes, and share best practices of integration involving community and other levels of care (namely palliative care).
TABLE OF CONTENTS
INTRODUCTION ... 1!
BACKGROUND ... 3!
1.1. Integrated care and the Portuguese experience ... 3!
1.2. Chronic conditions ... 6!
1.3. Hospital readmissions ... 7!
1.4. Integrated care effects on readmissions ... 9!
RESEARCH AIMS ... 11!
METHODOLOGY ... 13!
3.1. Study design ... 13!
3.2. Data source and inclusion/exclusion criteria ... 14!
3.3. Control group ... 16!
3.4. Variables ... 16!
3.4.1. Readmission ... 16!
3.4.2. Comorbidities and chronic conditions ... 16!
3.4.3. Individual risk of readmission ... 17!
3.4.4. Risk-standardized readmission ratio ... 18!
3.5. Statistical analysis ... 18!
3.5.1. Descriptive statistics ... 18!
3.5.2. Associations between individualsÕ risk factors and time to readmission ... 19!
3.5.3. Impact of vertical integration ... 19!
3.5.4. Sensitivity analysis ... 22!
RESULTS ... 23!
4.1. Characteristics of the sample ... 23!
4.1.1. Readmission rates by sampleÕs characteristics ... 24!
4.1.2. Evolution of readmission rates ... 25!
4.2. Associations between individualsÕ risk factors and time to readmission ... 28!
4.3. Impact of vertical integration ... 32!
4.3.1. Readmission rates before and after vertical integration ... 32!
4.3.2. Impact of vertical integration on the risk-standardized readmission ratio ... 34!
4.3.3. Impact of vertical integration on the risk of readmission ... 35!
DISCUSSION ... 43!
5.1. Discussion of main findings ... 43!
5.2. Limitations of the study ... 46!
5.3. Further research and recommendations ... 47!
FINAL REMARKS ... 51!
APPENDIXES ... 61!
FIGURES AND TABLES INDEX
Figure 1: Exclusion criteria applied to all episodes from Portuguese mainland public hospitals from 2002 to 2014. ... 15! Figure 2: Evolution of crude and standardized readmission rates (%) from 2002 to 2014, for LHU and control group. ... 26! Figure 3: Readmission rates (%) from 2002 to 2014, by number of chronic conditions, for LHU and control group. ... 27! Figure 4: Average readmission rates (%) for each LHU and control group, before and after vertical integration, by number of chronic conditions. ... 33! Figure 5: Risk-standardized readmission ratio (SRR) for LHU and control group in the period 2002-2014. ... 34! Figure 6: Evolution of risk of readmission (odds ratio) in the period I-4 to I+2 (95% CI) for all LHU compared to the control group. ... 39 Table 1: Evolution and attributes of local health units (LHU) network. ... 5! Table 2: Characteristics of the sample by gender, age group, number of chronic conditions,
LIST OF ACRONYMS
ACSS Ð Portuguese Central Administration for Healthcare System AHRQ Ð Agency for Healthcare Research and Quality
CCI Ð Chronic Condition Indicator CCS Ð Condition Classification System
CMS Ð Centers for Medicare and Medicaid Services DiD Ð Difference-in-differences
ICD-9-CM Ð International Classification of Diseases, 9th revision, Clinical Modification LHU Ð Local Health Unit
NHS Ð National Health Service
INTRODUCTION
Healthcare systems sustainability is a global concern, aggravated by the demographical and epidemiological changes, and with the increase burden of disease and chronic conditions creating one of the biggest strain. Thus, these threats shape the way healthcare delivery is designed[1] and how healthcare organizations are managed.
Vertical integration of healthcare providers is a way to respond to these challenges, addressing differentiation and fragmentation, as well as the healthcare needs of individuals with chronic conditions and multi-comorbidities, since they require a consistent and long term care attention.[2] Furthermore, vertically integrated healthcare providers are expected to develop better transitions of care[3], with one of the estimated effects being a decrease on the readmission frequency of individuals with chronic conditions.
Because readmissions are costly[4] and threaten healthcare systemsÕ sustainability, increase individualsÕ vulnerability and expose them to several hospital level risks[5], and being individuals with chronic conditions the ones who face higher likelihood of readmission, it is urgent to investigate if and how vertical integration is addressing these concerns.
In Portugal, vertical integrated care is materialized by Local Health Units (LHU) and arose from the expectation of effective coordination between primary and hospital care, in order to better respond to the needs of the population.[6,7] Since vertical integrated care approaches to healthcare are expected to decrease readmissions[8], we presume that LHU has that effect on individuals with chronic conditions. Evidence from other countries suggests a mixed impact regarding integrated healthcare and hospital readmission[9Ð14], thus we consider research over this topic essential for a better integrated care and centred on individualsÕ points of view and needs. In addition, in Portugal there is no study, as far as we know, that evaluated LHU effects over the readmission of individuals with chronic conditions. Thus, with this research we aim to bridge this gap.
CHAPTER 1
BACKGROUND
In Portugal, the populationÕs life expectancy has been consecutively improving over the last few years.[15] However, when compared to other European countries, Portuguese men and women aged 65 and over, live fewer healthy years.[15] Thus, ageing populations[16,17], the prevalence of multimorbidity[17], and the current increasing pressure of burden of disease challenge healthcare systems[18,19] and the way healthcare delivery is designed[1]. Some authors[20] stress that the argument is not the ageing population but the underlying health burden of chronic conditions that created one the biggest strain on healthcare systems.
Throughout the years, there have been continuous political movements to reorganize the structure of healthcare delivery, with the aim of improving the quality of care and simultaneously make it more cost-effective. Thus, the National Health Service (NHS) sustainability is assumed as a difficult structural challenge, along with the transformation of the NHS towards a system where health promotion and disease prevention are the driving forces. Portuguese integrated care experiences, with horizontal and vertical integration phenomenon, are a sign of the efforts that materialize this healthcare policy.
1.1.
I
NTEGRATED CARE AND THE
P
ORTUGUESE EXPERIENCE
Shaw and co-authors[21] define integrated care as an organizational principle for care delivery, and integration as the methods, processes and models to achieve integrated care, as a managerial response to differentiation and fragmentation[22]. On this study we assume World Health Organization (WHO) definition of integrated health services as Òthe management and delivery of health services such that people receive a continuum of health promotion, disease prevention, diagnosis, treatment, disease-management, rehabilitation and palliative care services, through the different levels and sites of care within the health system, and according to their needs throughout the life courseÓ[22, p49].
and comorbidities; iii) engagement of individuals and caregivers in the treatment decision-making; iv) new professions arising from the demanding communications between specialists and generalists and; v) the complex and fragmented healthcare systems.
Integration can focus on primary and secondary care, but may also have a wider scope and involve social care[24], insurance or other human service systems as stated by Leutz[25]. The common focus of many integrated care approaches includes the support to individuals with chronic conditions to live more independently[11,26], with improvements to their care experience.
Vertical integration is one of the structural dimensions of integrated care.[27] This process can be characterized by the transformation of the elements of a particular organizational structure, giving rise to a new structure, involving new management relations, and communication flow responsibilities. Vertical integration is therefore an organizational conceptualization of a healthcare structure, which involves creating a single management entity, and at least two units providing healthcare at different levels of care. Santana[28] points out that the cumulative conditions for recognition of vertical integration are: i) the existence of a single entity responsible for health; ii) in a given geo-demographic space, well defined and limited; iii) serving a population covered by the entity; iv) with coordinated efforts among all healthcare units in the integrated care system.
There is a global shift concerning integrated care[19], being given more frequently visibility to the experiences in the U.S.A. and United Kingdom[29]. Despite the many integrated care approaches across the world, there is not just a single model that best fits integrated care needs. The development of integrated care services is a non-linear and dynamic process[19], requiring the system to foster an adaptive and transformative culture, and being promoted as an approach for improving accessibility, affordability, quality of care and effectiveness, with a special focus on people with complex needs[30Ð32]. For recognizing the frailties in developing integration across different providers, Goodwin and co-authors[33], through case studies, argue that the starting point to integrated care should be a clinical/service model designed to improve care instead of an organizational model with a pre-determined design.
organizational structures and processes such as disease and case management with integrated care.[31] In addition, cultural contexts and settings configure integrated care definitions. This lack of focus of integrated care can make it difficult to implement and obtain desired outcomes, namely a decrease on the number of readmissions[36].
Portugal has been showing some legislative sensibility regarding care integration, some of it disruptive, attempting to adopt the best international practices (e.g., the first law of mental health, Law 2118/1963, 3 April).[37] The most recent Portuguese experience regarding vertically integrated care has begun in 1999, ahead of other European countries[13]. However, there is a lack of a systematic evaluation of its purpose as well as the dissemination of results and impacts.[8]
The Local Health Units (LHU) arose from the expectation of effective coordination between primary and secondary care, in order to better respond to the needs of the population.[6,7] LHU are responsible for the health of a population, providing healthcare under the coordinated management of a hospital (or hospitals, in the case of a hospital centre) and primary healthcare units.
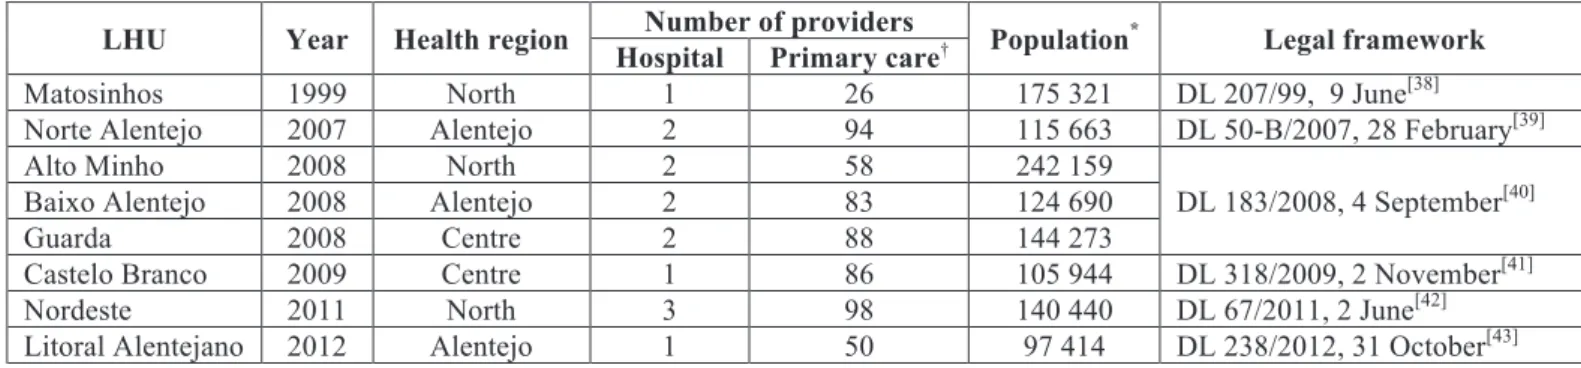
In Table 1, we see that the first LHU was created in 1999 (LHU Matosinhos) by Decree-Law 207/99, 9 June[38], merging one hospital and 26 primary care providers, covering over 175 000 inhabitants. For eight more years, this was the only LHU. Only between 2007 and 2009 were created new LHU, providing integrated care for inhabitants from Alentejo, North, and central Portugal. In 2011 and 2012, two more LHU were created, one in the North another in Alentejo. Nowadays the LHU network provides healthcare for 1 145 904 inhabitants, around 11.6% of the Portuguese mainland population.
Table 1: Evolution and attributes of local health units (LHU) network.
LHU Year Health region Number of providers Population* Legal framework Hospital Primary care
Matosinhos 1999 North 1 26 175 321 DL 207/99, 9 June[38]
Norte Alentejo 2007 Alentejo 2 94 115 663 DL 50-B/2007, 28 February[39]
Alto Minho 2008 North 2 58 242 159
DL 183/2008, 4 September[40]
Baixo Alentejo 2008 Alentejo 2 83 124 690
Guarda 2008 Centre 2 88 144 273
Castelo Branco 2009 Centre 1 86 105 944 DL 318/2009, 2 November[41]
Nordeste 2011 North 3 98 140 440 DL 67/2011, 2 June[42]
Litoral Alentejano 2012 Alentejo 1 50 97 414 DL 238/2012, 31 October[43]
OECD[45] stresses that Portuguese healthcare needs to evolve towards a more integrated approach, increasing and deepening relations among the various levels of care, including palliative care. To prevail the success and effectiveness of these movements, a reflection period is mandatory over the existing experiences of integrated care. However, there are only a few studies about this model of organization and management of healthcare (e.g., 15, 16, and 36). There is a lack of evidence regarding economic, financial and covered populationÕs health outcomes, namely on individuals with complex needs of care like those with (multiple) chronic conditions.
1.2.
C
HRONIC CONDITIONS
Chronic conditions refer to health conditions that persist across time (for at least 12 months), that require on-going healthcare interventions, either medical products, services or special equipment, and/or places limitations on self-care, independent living, and social interactions.[47] This definition also includes non-communicable diseases, mental disorders, some communicable conditions and on-going physical impairments.[48]
The burden of chronic conditions has been globally underestimated by society, political and health systems regarding its transversal effects.[49,50] Chronicity is a challenge to all developed[51,52] and developing countries[50], especially because a source of the rise in cost for healthcare systems comes from the fact individuals with chronic conditions receive fragmented care.[20,53,54] Thus, international governments have committed to an integration of healthcare that specifically addresses the growing prevalence of chronic conditions in the population.[51,55,56] However the evidence of integrated interventions designed to address individuals with chronic conditions healthcare needs seems to be sparse and inconsistent.[57]
According to Anderson[49], the growing trend of the presence of chronic conditions on individualsÕ health illuminates less successful aspects in the evolution of health systems, historically centred in the treatment of infectious and acute diseases. Also, individuals with chronic conditions are more likely to experience hospital readmissions[53,59] since they are more vulnerable to the consequences of non-effective integrated care.
1.3.
H
OSPITAL READMISSIONS
Hospital readmission is considered as a new inpatient episode after an index admission (i.e., an initial hospital admission) within a given period. Thus, oneÕs choice regarding time frame, or relations with the index admission (e.g., principal diagnosis) are crucial to define readmissions. Readmission, in the current study, is defined as a subsequent inpatient admission to any acute hospital for any condition that occurs within 30 days of the initial discharge date.
Readmissions are a complex organizational and clinical challenge since not all readmissions can be prevented. Readmissions can be grouped as planned/unplanned and if related or not to the index admission diagnosis.[60] Planned readmissions are not considered a sign of poor quality of care as they are identified on the discharge process and part of the individualÕs treatment. On the other hand, admission for acute conditions or complications are most likely not planned, thus a concern for healthcare systems and users[61]. Thus, reducing the volume of unplanned readmissions is a frequent strategy for improving the quality of healthcare. This research will focus on unplanned readmissions only.
An all-cause readmission measure stresses the fact that, from an individual perspective, a readmission, regardless the cause, is always an adverse event[62]. Individuals are more vulnerable when they are away from their home, family and communities, exposed to several hospital level risks, and vulnerable to the experience that Krumholz[5] dubbed the post-hospital syndrome.
Some authors[65,68] stress that 30-day readmission measure association to hospital quality has not been clearly proved, mainly because there are unplanned readmissions considered unavoidable, for they go beyond hospitalÕs scope of action (e.g., social and economic factors, home and community frailties or natural progression of disease)[69]. Also, van Walraven[68] stress a set of deficiencies regarding the utility of unplanned readmission measure as a healthcare quality indicator, focusing on health administrative databases and the potential to capture avoidable readmissions.
Despite the frailties reported to this measure, it is commonly used because 30 days is considered a clinically sensible time frame that can be strongly influenced by hospital care and the transition to the outpatient setting, as well as being a critical period for hospitals to collaborate with their communities in order to reduce readmissions.[4,70] Thus, a shorter time frame for readmission emphasises the importance of transition of care and individualsÕ suitability for discharge.
There are various interventions addressed to reduce hospital readmission, with different potential degrees of effectiveness.[71] One example are case management approaches with enhanced primary care access.[12] Another one refers to referral networks. The main goal is to promote a more comprehensive healthcare system, less fragmented, and with a deeper set of coordinated activities.[72] Logue and co-authors[73] highlight facilitating self-care, individualsÕ education about their condition and medications, assessing social frailties, and coordinated follow-up after discharge as common factor to these programs. Additionally, clarifying individuals discharge instruction is an activity that hospitals engage in to reduce readmissions[74,75] and address individualsÕ concerns such as feeling unprepared for discharge[62] or difficulties adhering to the discharge medication[76]. There is evidence that involving primary care teams in the discharge planning by designing a multicomponent person-centred intervention has significant impact on decreasing the number of readmissions.[12] Usually, successful interventions for reducing readmission rates are a composite of different interventions[36,77] targeting multidimensional risk factors present in discharged individuals[3]. Thus, multidimensional interventions require substantial resources for planning, implementation, and monitoring[78], that may represent a challenge for management and care teams.
However, transitions to nursing home[79] or palliative care[80] are also important for decreasing readmissions.
The interventions to accomplish better health outcomes, namely fewer readmissions, are diverse and vary on intensity across transitional care. Rennke and colleagues[81] present transitional care strategies grouped as: i) pre-discharge interventions (e.g., assessment of risk for adverse events or readmission); ii) after discharge interventions (e.g., medication reconciliation after discharge) and; iii) bridging interventions, a composite of at least one pre- and post-discharge intervention. Verhaegh and co-authors[29] stress that these interventions should be initiated during hospital admission and continued after discharge, involving home visits, and telephone follow-up for a minimum period of one month, thus reducing readmissions.
Developing multidimensional transitions of care involves a great deal of time and human resources from care facilities, hence most transitions of care are directed at specific groups that face higher risk of readmission and would benefit more with these interventions (e.g., individuals with chronic conditions and/or with multi-comorbidities), and with greater effect on reducing readmission.[78]
1.4.
I
NTEGRATED CARE EFFECTS ON READMISSIONS
that LHU have reduced the risk of 30-day readmission by the same diagnosis from 2008 to 2014 (odds ratio decreased from 1.03 to 0.98).
Despite there being efforts for a better vertically integrated care, results seem to be modest, with poor evidence concerning health outcomes improvements.[9,10] Evidence suggests mixed impacts regarding vertical integrated care and hospital readmission.[9Ð14] For example, Massachusetts General Care Management was able to improve physical functioning of individuals with multimorbidity, and to substantially reduce hospitalizations and emergency departments visits of individuals with ambulatory care sensitive conditions, but did not reduce readmission.[14]
In order to vertically integrated care produce effects on readmissions of individuals with chronic conditions, there has to be a more effective continuum of care among different levels of healthcare providers, namely primary and secondary level. Primary care assumes a relevant role in the coordination and integration of care with the main functions of being individualsÕ first contact with the health systems, continuity of care throughout time, comprehensiveness of services needed to serve a population healthcare needs and referring individuals both horizontally and vertically.[17] Thus, the quality and scope of primary care have an impact on integration of care, namely decreasing readmission.[56] However, Hesselink and co-authors[89] conducted a systematic review of the literature concerning hospital and primary care transitions and did not found robust evidence of integrated care decreasing readmissions, in particular in individuals with chronic conditions.
Despite the mixed evidence of the effects of vertically integrated care on the readmission of individuals with chronic conditions, Leutz[25] stresses that not all individuals with chronic conditions need fully integrated care. Therefore, transitions between coordination or full integration of care should depend on the severity of the chronic condition[31] and existing comorbidities, showing the flexibility to address the best features of integration to the ones who need it the most.
CHAPTER 2
RESEARCH AIMS
Readmissions are a topic that has been highly researched throughout the years and captured the attention of policy makers since late 1970Õs.[61] Nowadays the attention increased because of economic pressure to reduce the problem of unplanned readmissions, as well as a deeper concern about quality of life and care (e.g., readmission implies an increasing burden for individuals, families and caregivers[62]). Because of healthcare system frailties individuals are discharged sooner, increasing their responsibility on their treatment and transitions between healthcare providers.[56,91] Excessive unplanned readmission rates among hospitals could also be a sign of frail integrated care[63], thus this indicator is relevant to promote effectiveness and quality of care at a systematic level[92].
Our approach to the study of readmissions does not rely on hospital crude rates, but instead on adjusted to case mix and service mix, allowing for better comparisons between hospitals. Besides individualsÕ characteristics (e.g., chronicity and comorbidities) that may be associated with readmission, there are organizational features of the healthcare system itself that influence readmissions, namely vertically integrated care. For those reasons, and because there are still few studies regarding the impact of vertical integration on the quality of care[7,44,46,93], we chose to develop this study. As such, we assume as the main aim of this study to assess the impact of vertical integration on the readmission of individuals with chronic conditions. Moreover, the specific objectives of this study are:
¥! To describe 30-day readmission frequency in individuals with chronic conditions, from 2002 to 2014;
¥! To analyse the association between individualsÕ risk factors and readmission;
CHAPTER 3
METHODOLOGY
3.1.
S
TUDY DESIGN
This study was designed as a longitudinal and retrospective observational study. The event of interest was all unplanned readmissions within 30-day period following an index admission.
In order to assess the impact of vertical integration on the readmission of individuals with chronic conditions we compared 30-day unplanned readmissions before and after the creation of each LHU. We used administrative data to differentiate individualsÕ chronicity and comorbidity profiles, and to adjust statistical models more accurately to individualsÕ characteristics that are more likely to lead to an unplanned readmission.
We considered an eight-year time frame for each LHU, five years before integration and three post-integration (I-5 to I+2, being I the year when LHU was constituted). We considered this time frame so that we could study each LHU over the same period, despite the differences in the year of creation for each LHU. This way, and given the available data, we observed the evolution of each LHU on the period before and after its creation.
In a natural experiment one can make comparisons between groups (treated and the ones that did not receive treatment Ð control) if the treatment is exogenous and the two groups are comparable. This way one can ensure internal validity of a natural experiment.[94] The treatment group included seven out of eight LHU. We excluded LHU Matosinhos from the analysis because of its year of creation (1999), since there was no inpatient data available regarding the period before integration.
LHU and control group. Therefore, in order to address our main aim, DiD was the adequate technique.
In order to develop a better understanding of the readmission phenomena in LHU and control group, we studied the associations between individualsÕ risk factors and time to readmission. We conducted a Cox regression to analyse the influence of gender, age, number of chronic conditions and Elixhauser comorbidities on the risk of readmission in LHU and control group.
We performed DiD analyses considering two dependent variables: i) natural logarithm of the risk-standardized readmission ratio (SRR) and; ii) occurrence of readmission (risk of readmission).
We considered SRR, a hospital level measure, as dependent variable because it allowed studying the effects of vertical integration in a particular hospitalÕs performance to be compared to an average hospitalÕs performance, adjusting for discharge volume. We chose to use SRR methodology approach because it is public[95,96], there is a dense body of work of published literature regarding its utilization (e.g., 60, 65, and 66) and is still currently being discussed and challenged among researchers, policy makers, American hospitals and other stakeholders. On the other hand, the risk of readmission is an individual level measure that emphasises the probability of readmission given oneÕs characteristics. Since the SRR is expected to be influenced by disruptions in the continuum of care, inadequate inpatient care and discharge planning, among other factors, we decided to study if vertical integration of healthcare had an impact on diminishing these effects on readmissions, thus reducing SRR. At an individual level, vertical integration is expected to decrease oneÕs risk of readmission by promoting better continuum of care, considering a healthcare person-centred approach. Hence, we decided to study if vertical integration of healthcare had an impact on decreasing individualsÕ risk of readmission, given oneÕs characteristics (age, principal diagnosis, presence of selected comorbidities, number of chronic conditions and comorbidities).
3.2.
D
ATA SOURCE AND INCLUSION
/
EXCLUSION CRITERIA
of treatment, gender, age, principal diagnosis, secondary diagnoses, procedures, type of admission, discharge date, length of stay, and discharge status.
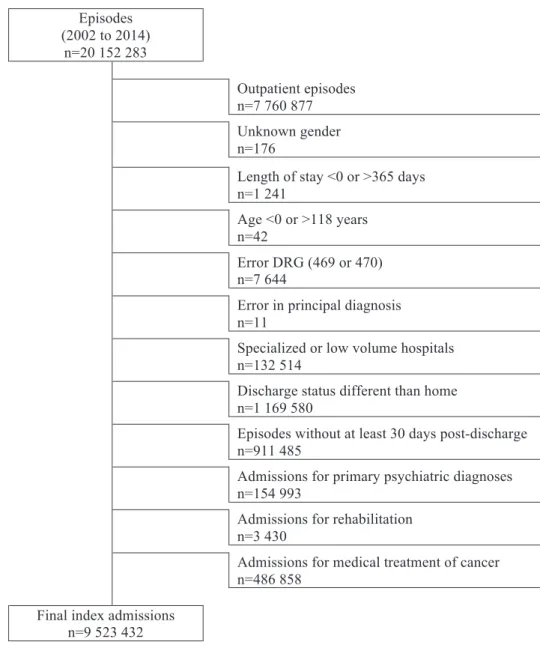
All diagnoses and procedures were coded using International Classification of Diseases, 9th revision, Clinical Modification (ICD-9-CM). Because the number of secondary diagnoses on these datasets varied in recent years, in order to get comparability among all datasets throughout 2002 to 2014, we only used the first 20 diagnoses (one principal diagnosis and 19 secondary diagnoses). Figure 1 presents the exclusion criteria applied, being selected 9 523 432 inpatient index admissions. From these, we selected for our analyses all episodes treated at LHU (n=845 275) and at control hospitals (n=834 359), totalizing 1 679 634 index admissions.
Episodes (2002 to 2014)
n=20 152 283
Outpatient episodes n=7 760 877 Unknown gender n=176
Length of stay <0 or >365 days n=1 241
Age <0 or >118 years n=42
Error DRG (469 or 470) n=7 644
Error in principal diagnosis n=11
Specialized or low volume hospitals n=132 514
Discharge status different than home n=1 169 580
Episodes without at least 30 days post-discharge n=911 485
Admissions for primary psychiatric diagnoses n=154 993
Admissions for rehabilitation n=3 430
Admissions for medical treatment of cancer n=486 858
Final index admissions n=9 523 432
3.3.
C
ONTROL GROUP
In order to conduct the DiD analyses, a hospital control group was defined. Hospitals in this group were not vertically integrated, but were affected by the same external systemic effects that might have influence on readmissions.
The control group was derived using ACSSÕs benchmarking hospital groups (except psychiatric and public-private partnerships because these might be affected by different systemic effects). These benchmarking hospital groups were created by hierarchical clustering.[99]
Hospitals from the control group had to belong to benchmark group B or C, since all LHU were clustered between those groups. After the application of the exclusion criteria for hospitals, from benchmark group B we selected the three remaining hospitals, and from group C we randomly selected three.
3.4.
V
ARIABLES
3.4.1.
R
EADMISSIONReadmissions were identified using Centers for Medicare and Medicaid Services (CMS) hospital-wide all-cause unplanned readmission measure[96] (1: readmission). First, we identified all index admissions, and selected those that could be analysed within a 30-day time frame. With the final set of index admissions, we identified episodes followed by an unplanned readmission and the ones that were planned. This study focuses on the 30-day unplanned readmissions.
3.4.2.
C
OMORBIDITIES AND CHRONIC CONDITIONSascertain the presence of ICD-9-CM diagnoses codes considered as chronic conditions (1: chronic condition present).
We used these measures for its complementary information regarding individualsÕ health status. For instance, the drug abuse Elixhauser comorbidity group is considered a comorbidity for 292.x ICD-9-CM codes, but the code 292.0 (drug withdrawal syndrome) is considered a chronic condition while 292.11 (drug paranoid state) is not. Moreover, Elixhauser comorbidity index was reported with the ability to predict length of stay[103], and was also found significantly associated with healthcare expenditures and in-hospital mortality[104]. On the other hand, the chronic condition indicator works as a proxy to assess oneÕs overall burden of chronic illness, engagement with the healthcare system and the total number of conditions being treated[105].
3.4.3.
I
NDIVIDUAL RISK OF READMISSIONIndividual risk of readmission was estimated using generalized linear mixed models at the specialty cohort level described elsewhere[96] (1: readmitted). For a given specialty cohort, we fitted a hierarchical logistic regression model to account for the natural clustering of observations within hospitals. From these models we obtained the risk of readmission for individual i at hospital j in year t as
!!"#$ %&'()*+, -./01"# ,
where2- is the adjusted average outcome (being readmitted within 30-day time frame) over all hospitals and 1"# a set of risk factors that are clinically relevant and strongly associated with the outcome (age, principal diagnosis and selected comorbidities). Age was treated as a continuous variable. For principal diagnosis, we used the AHRQ Condition Classification System (CCS) to group hospitalizations into clinical-coherent, mutually exclusive condition categories. Comorbid diseases were identified using the CMS Condition Category groups.
3.4.4.
R
ISK-
STANDARDIZED READMISSION RATIOThe risk-standardized readmission ratio (SRR) reflects the number of readmission events at a hospital level, relative to the number of readmission events that would be expected based on average hospital performance. Therefore, this measure allows a particular hospitalÕs performance to be compared to an average hospitalÕs performance. A lower ratio (<1) stands for lower-than-expected readmission rate, and similarly a higher ratio (>1) stands for higher-than-expected readmission rate.
We chose to use as dependent variable the natural logarithm of SRR for three reasons: i) to reduce outlier noise; ii) to correct positive skewness, since SRR measure is always positive and; iii) to facilitate regression coefficients interpretation, i.e., marginal changes in the explanatory variables are interpreted in terms of percentage change in the dependent variable.
We provide further explanation regarding SRR in Appendix 1.
3.5.
S
TATISTICAL ANALYSIS
3.5.1.
D
ESCRIPTIVE STATISTICSFirst we used frequencies analysis to describe LHU and control hospitals regarding gender, age groups (0-19; 20-44; 45-64; 65-84; and 85+), number of chronic conditions and comorbidities (0, 1, 2, 3, 4, and 5+), for the period 2002-14. We also listed selected principal diagnosis, based on the principal diagnoses that were simultaneously most frequent, with higher readmission frequency and readmission rate: diabetes mellitus with complications, congestive heart failure, pneumonia, acute bronchitis, chronic obstructive pulmonary disease and bronchiectasis, and urinary tract disease. This selection accounted for 10% of episodes and 25% of readmissions.
We also compared the variation of readmission rates throughout the years by number of chronic conditions, for LHU and control group, and compared readmission rate evolution with the national average readmission rate.
3.5.2.
A
SSOCIATIONS BETWEEN INDIVIDUALSÕ
RISK FACTORS AND TIME TO READMISSIONWe used a Cox regression (also known as proportional hazards regression analysis) to study the association between the time interval between admissions and possible covariates of a readmission. Various methodologies and techniques have been used for risk of readmission, with logistic and Cox regression being the most common methods used to identify risk factors.[106] The hazard function in this case refers to the probability that an individual will experience readmission within a 30-day time frame (risk of readmission at time t).
Covariates were gender, age group, number of chronic conditions, and number of Elixhauser comorbidities. All covariates association with time interval between admissions were assessed by a preliminary univariate Cox regression. Any covariate with
34 567 was used after in a multivariate Cox regression analysis. The multivariate model
used a backward likelihood ratio stepwise data selection method. A cut-off value of 3 4
5658 was applied to remove covariates from the final model. Verification of the proportional hazards assumption was based on a visual inspection of Kaplan-Meier plots. These analyses were conducted separately for LHU and control group index admissions.
3.5.3.
I
MPACT OF VERTICAL INTEGRATION3.5.3.1. Impact on the risk-standardized readmission ratio
The effect of vertical integration on the risk-standardized readmission ratio can be estimated by comparing the treatment and control group before and after integration. Let &9 :!!#$ be the natural logarithm of the risk-standardized readmission ratio for
hospital j at year t. Let ;#$ be a binary variable taking on value 1 if hospital j at year t is LHU and 0 otherwise; <$ a set of year dummies capturing period specific effects; =>2is a constant term and ?#$ an idiosyncratic term. We considered the following model estimated by a pooled OLS:
Model 1:&9 :!!#$ %=>.@;
The estimated coefficient @ stands for the DiD. To account for possible
unobservable characteristics that might affect SRR over time, we adjusted standard errors by clustering at the hospital level. This mitigates bias over @.
In order to account for time-invariant unobservable at hospital level we considered a set of hospital dummies B#$ 62We also considered the average number of chronic
conditions CDEFGH'9#$ 2and Elixhauser comorbidity index CDEI&)JGKLMNH#$ 2 for all
individuals at hospital j as covariates thought to potentially influence readmission frequency, thus influencing SRR. Hence, the new model can be estimated as a fixed effects model:
OPQRS2TU2&9 :!!#$ %=>.@;#$.<$.B#$.CDEFGH'9#$.CDEI&)JGKLMNH#$.A#$
In order to relax the parallel trend assumption we used a DiD model with a differential trend model.[107] Incorporating the assumption we obtain the following fixed effects model:
OPQRS2VU2&9 :!!#$ %=>.@;#$.B#$.CDEFGH'9#$.CDEI&)JGKLMNH#$. W#XYNKHX
Z
[\]
. ^#XYNKHX;#$.
Z
[\]
A#$
The parallel trend assumption can be verified by testing the non-linear restriction _`a
b
cde
f
`a b
cde %
56 Non-rejection of the null hypothesis of WaldÕs statistical test provides
evidence in favour of the parallel trend assumption.
3.5.3.2. Impact on the risk of readmission
We used DiD technique to analyse the effects of vertical integration on the risk of readmission. We considered an unconditional logit model with fixed effects using dummy variables. There is still discussion regarding the use of dummy variables similarly as fixed effects. Greene[108] states that bias in estimators is large when number of years of data is small. Because we have a large number of observations per hospital and the number of years considered in this analysis for each LHU is T=8, according to CoupŽ[109], bias in the unconditional estimator is small and, for the purpose of our research we find it acceptable. Let the dependent variable Y"#$ be a binary variable for episode i in hospital j at
variable taking on value 1 if hospital j at year t is LHU and 0 otherwise; g'M*"#$2 takes
value 1 if admission of individual i occurred in hospital j in the year post-integration and 0 otherwise; hHNK*#"$ takes value 1 if admission happened in a LHU; <$ is a set of year
dummies capturing period specific effects;22!!)i* is the individual risk of readmission for
individual i admitted in hospital j in year t, computed through a logistic generalized linear mixed model as discussed by Horwitz and colleagues[96]; =>2is a constant term and ?"#$ an idiosyncratic term. The Model 1 estimated @ coefficient stands for the DiD. To account
for possible unobservable characteristics that might affect risk of readmission over time, we adjusted standard errors by clustering at the hospital level to mitigate bias over @.
Model 1:&'()* gH'j Y"#$ %7 %=>.@;"#$.kg'M*"#$./hHNK*#"$.<#$.!!"#$2.A"#$
We considered a set of hospital dummies B#$ 2to account for time-invariant
unobservables at hospital level.2We also considered the number of chronic conditions
FGH'9"#$ 2and the Elixhauser comorbidity index I&)JGKLMNH"#$ for each index
admission at hospital j as covariates thought to potentially influence risk of readmission. Hence, the new model can be estimated as a Òfixed effectsÓ unconditional logit model:
OPQRS2TU2&'()* gH'j Y
"#$%7 %=>.@;"#$.kg'M*"#$./hHNK*#"$.<#$.B#$.FGH'9"#$.I&)JGKLMNH"#$.!!"#$.A"#$
We used Wagstaff and Moreno-SerraÕs differential trend model[107] in order to relax the parallel trend assumption. Incorporating this assumption in the model, we obtained the following:
OPQRS2VU2&'()* gH'j Y"#$%7 %=>.@;"#$.kg'M*"#$./hHNK*#"$.B#$.FGH'9"#$.
.2I&)JGKLMNH"#$.!!"#$. W#XYNKHX
Z
[\]
. ^#XYNKHX;"#$. Z
[\]
A"#$
The parallel trend assumption can be verified by testing the non-linear restriction _
`a b
cde
f`a
b
cde %
56 Non-rejection of the null hypothesis of WaldÕs statistical test provides
evidence in favour of the parallel trend assumption.
to interact the treatment variable with time dummies. Let l#$ be a treated/control dummy
equal to 1 if hospital j is in the treatment group and 0 otherwise. Then we construct Model 4 as:
OPQRS2mU2&'()* gH'j Y
"#$%7 %=>. @nl#$ ]
n\+o
.<$.B#$.FGH'9#$.I&)JGKLMNH
#$.2!!"#$.A"#$
All time dummies interacted with l#$ are expressed relatively to the omitted time
period which serves as baseline (year I-5), thus only years I-4 to I+2 will be presented (being I the year when LHU was created). It is possible to see how the effect varies over time, if it stays constant, decreases or increases by analysing2@>, @
,, and @].
3.5.4.
S
ENSITIVITY ANALYSISWe recalculated DiD for risk of readmission under an alternative constitution of the control group to determine the impact of control group choice. This new control group accounted for hospitalÕs organizational evolution between the period of 2002-14. We excluded all specialized and teaching hospitals. We compared the odds ratios results for each LHU against the new control group with those obtained with the initial control group.
We considered that the previous result was stable when there was less than 5% difference between odds ratios results for the same period.
CHAPTER 4
RESULTS
4.1.
C
HARACTERISTICS OF THE SAMPLE
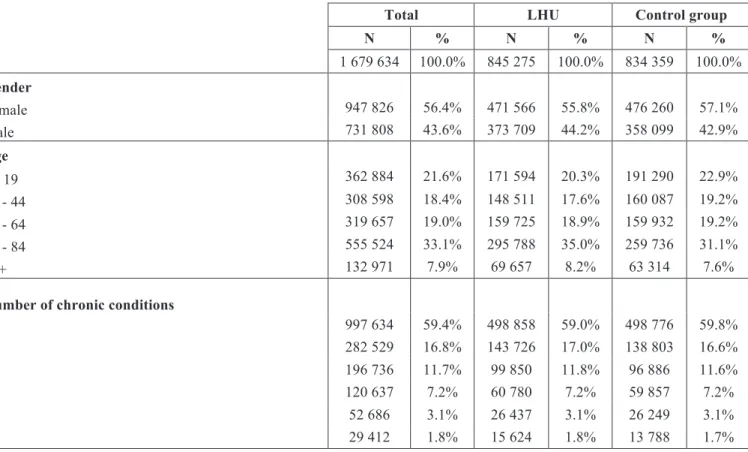
Our sample had 1 679 634 index admissions (Table 2). The sample was evenly distributed, with LHU accounting for 50.3% of index admissions. Index admissions from female individuals were more frequent on both LHU and control group (55.8% and 57.1%). Individuals with admission at LHU were older compared to those from control group. The average age for LHU individuals was 51.3±28.4 years and for control group 48.5±28.9. The distribution of number of chronic conditions and comorbidities was similar in LHU and control hospitals.
Pneumonia was the most prevalent principal diagnosis in LHU and control group hospitals (4.4% in LHU and 4.7% in control group).
Table 2: Characteristics of the sample by gender, age group, number of chronic conditions, Elixhauser comorbidity index, and selected principal diagnosis, in the period 2002-2014, for treatment (LHU) and control
group.
Total LHU Control group
N % N % N %
1 679 634 100.0% 845 275 100.0% 834 359 100.0%
Gender
Female 947 826 56.4% 471 566 55.8% 476 260 57.1%
Male 731 808 43.6% 373 709 44.2% 358 099 42.9%
Age
0 - 19 362 884 21.6% 171 594 20.3% 191 290 22.9%
20 - 44 308 598 18.4% 148 511 17.6% 160 087 19.2%
45 - 64 319 657 19.0% 159 725 18.9% 159 932 19.2%
65 - 84 555 524 33.1% 295 788 35.0% 259 736 31.1%
85+ 132 971 7.9% 69 657 8.2% 63 314 7.6%
Number of chronic conditions
0 997 634 59.4% 498 858 59.0% 498 776 59.8%
1 282 529 16.8% 143 726 17.0% 138 803 16.6%
2 196 736 11.7% 99 850 11.8% 96 886 11.6%
3 120 637 7.2% 60 780 7.2% 59 857 7.2%
4 52 686 3.1% 26 437 3.1% 26 249 3.1%
Total LHU Control group
N % N % N %
1 679 634 100.0% 845 275 100.0% 834 359 100.0%
Elixhauser comorbidity index
0 1 069 822 63.7% 534 957 63.3% 534 865 64.1%
1 293 571 17.5% 151 269 17.9% 142 302 17.1%
2 184 814 11.0% 92 403 10.9% 92 411 11.1%
3 84 654 5.0% 42 128 5.0% 42 526 5.1%
4 31 299 1.9% 16 045 1.9% 15 254 1.8%
5+ 15 474 0.9% 8 473 1.0% 7 001 0.8%
Condition specific indicator (AHRQ CCS)
Diabetes mellitus with complications 23 107 1.4% 13 498 1.6% 9 609 1.2% Congestive heart failure; nonhypertensive 36 821 2.2% 16 643 2.0% 20 178 2.4%
Pneumonia 76 933 4.6% 37 594 4.4% 39 339 4.7%
Acute bronchitis 25 293 1.5% 10 619 1.3% 14 674 1.8%
Chronic obstructive pulmonary disease and
bronchiectasis 22 372 1.3% 11 354 1.3% 11 018 1.3%
Urinary tract disease 35 464 2.1% 14 261 1.7% 21 203 2.5%
4.1.1.
R
EADMISSION RATES BY SAMPLEÕ
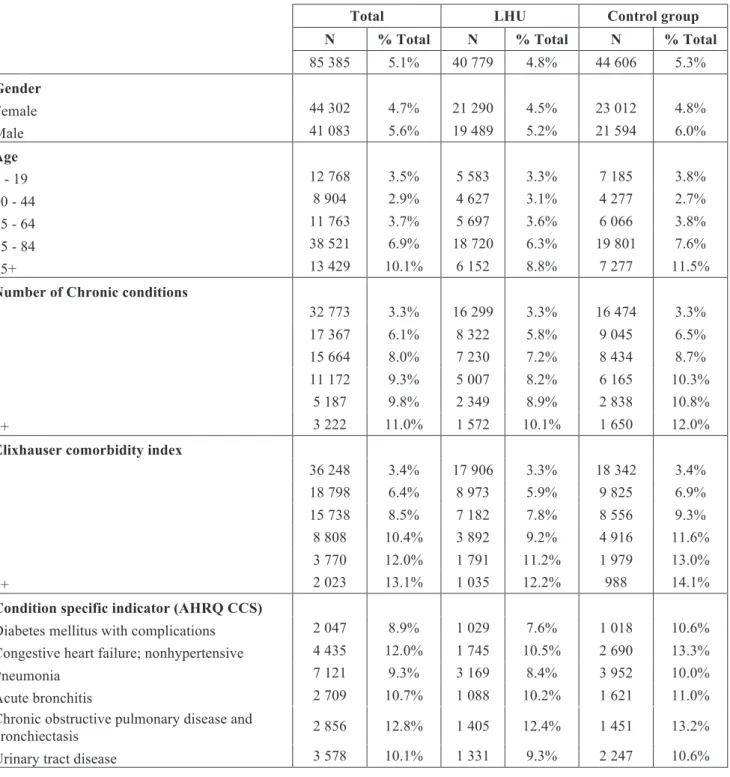
S CHARACTERISTICSTable 3: Readmission rates by gender, age group, number of chronic conditions, Elixhauser comorbidity index, and selected principal diagnosis, in the period 2002-2014, for treatment (LHU) and control group.
Total LHU Control group
N % Total N % Total N % Total
85 385 5.1% 40 779 4.8% 44 606 5.3%
Gender
Female 44 302 4.7% 21 290 4.5% 23 012 4.8%
Male 41 083 5.6% 19 489 5.2% 21 594 6.0%
Age
0 - 19 12 768 3.5% 5 583 3.3% 7 185 3.8%
20 - 44 8 904 2.9% 4 627 3.1% 4 277 2.7%
45 - 64 11 763 3.7% 5 697 3.6% 6 066 3.8%
65 - 84 38 521 6.9% 18 720 6.3% 19 801 7.6%
85+ 13 429 10.1% 6 152 8.8% 7 277 11.5%
Number of Chronic conditions
0 32 773 3.3% 16 299 3.3% 16 474 3.3%
1 17 367 6.1% 8 322 5.8% 9 045 6.5%
2 15 664 8.0% 7 230 7.2% 8 434 8.7%
3 11 172 9.3% 5 007 8.2% 6 165 10.3%
4 5 187 9.8% 2 349 8.9% 2 838 10.8%
5+ 3 222 11.0% 1 572 10.1% 1 650 12.0%
Elixhauser comorbidity index
0 36 248 3.4% 17 906 3.3% 18 342 3.4%
1 18 798 6.4% 8 973 5.9% 9 825 6.9%
2 15 738 8.5% 7 182 7.8% 8 556 9.3%
3 8 808 10.4% 3 892 9.2% 4 916 11.6%
4 3 770 12.0% 1 791 11.2% 1 979 13.0%
5+ 2 023 13.1% 1 035 12.2% 988 14.1%
Condition specific indicator (AHRQ CCS)
Diabetes mellitus with complications 2 047 8.9% 1 029 7.6% 1 018 10.6% Congestive heart failure; nonhypertensive 4 435 12.0% 1 745 10.5% 2 690 13.3%
Pneumonia 7 121 9.3% 3 169 8.4% 3 952 10.0%
Acute bronchitis 2 709 10.7% 1 088 10.2% 1 621 11.0%
Chronic obstructive pulmonary disease and
bronchiectasis 2 856 12.8% 1 405 12.4% 1 451 13.2%
Urinary tract disease 3 578 10.1% 1 331 9.3% 2 247 10.6%
4.1.2.
E
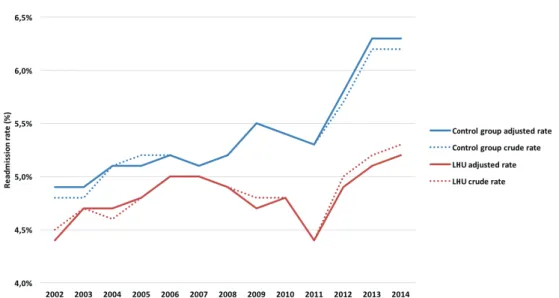
VOLUTION OF READMISSION RATESWhen compared to LHU, the control group presented higher readmission rates throughout the years, but more emphasised since 2007. In both groups, readmission rates were increasing since 2011. In 2014, the standardized readmission rate for LHU was 5.2% and for the control group was 6.3%.
Figure 2: Evolution of crude and standardized readmission rates (%) from 2002 to 2014, for LHU and control group.
4.2.
A
SSOCIATIONS BETWEEN INDIVIDUALS
Õ
RISK FACTORS AND
TIME TO READMISSION
Time to readmission had a similar pattern in LHU and in the control group
(median time to readmission was 10 days). Thus, to develop a better understanding on
how risk factors influenced time to readmission, we used a Cox regression. With this
analysis, we determined the association between the time interval between admissions
and possible covariates thought to influence readmission. Hence, the time variable
considered days until readmission, or days of follow-up (30 days maximum), and the
status variable considered if readmission occurred in a 30-day period. If not, the episode
was censored. The covariates were gender, age group, number of chronic conditions, and
number of comorbidities. This analysis was conducted separately for LHU and control
group.
The approach we considered by using Cox regression not only takes readmission
into consideration but also the time to readmission, providing a deeper understanding than
that offered by logistic regression. In Table 4 we present the number of index admissions
in each covariate.
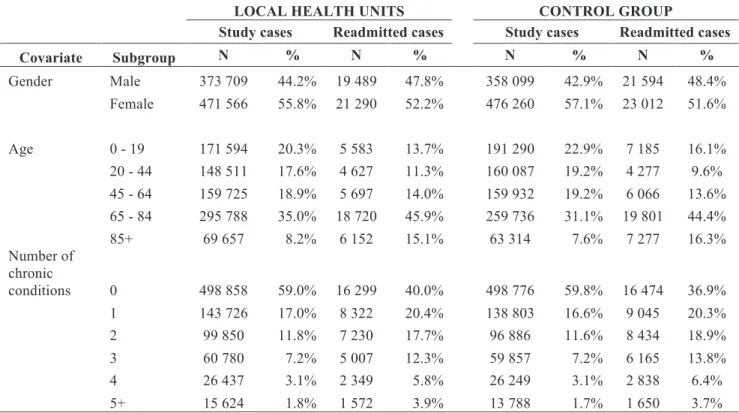
Table 4: Frequency of index admissions and readmissions for LHU and control group by gender, age group, number of chronic conditions, and Elixhauser comorbidity index.
LOCAL HEALTH UNITS CONTROL GROUP
Study cases Readmitted cases Study cases Readmitted cases
Covariate Subgroup N % N % N % N %
Gender Male 373 709 44.2% 19 489 47.8% 358 099 42.9% 21 594 48.4%
Female 471 566 55.8% 21 290 52.2% 476 260 57.1% 23 012 51.6%
Age 0 - 19 171 594 20.3% 5 583 13.7% 191 290 22.9% 7 185 16.1%
20 - 44 148 511 17.6% 4 627 11.3% 160 087 19.2% 4 277 9.6%
45 - 64 159 725 18.9% 5 697 14.0% 159 932 19.2% 6 066 13.6%
65 - 84 295 788 35.0% 18 720 45.9% 259 736 31.1% 19 801 44.4%
85+ 69 657 8.2% 6 152 15.1% 63 314 7.6% 7 277 16.3% Number of
chronic
conditions 0 498 858 59.0% 16 299 40.0% 498 776 59.8% 16 474 36.9%
1 143 726 17.0% 8 322 20.4% 138 803 16.6% 9 045 20.3%
2 99 850 11.8% 7 230 17.7% 96 886 11.6% 8 434 18.9%
3 60 780 7.2% 5 007 12.3% 59 857 7.2% 6 165 13.8%
4 26 437 3.1% 2 349 5.8% 26 249 3.1% 2 838 6.4%
LOCAL HEALTH UNITS CONTROL GROUP
Study cases Readmitted cases Study cases Readmitted cases
Covariate Subgroup N % N % N % N %
Elixhauser comorbidity
index 0 534 957 63.3% 17 906 43.9% 534 865 64.1% 18 342 41.1%
1 151 269 17.9% 8 973 22.0% 142 302 17.1% 9 825 22.0%
2 92 403 10.9% 7 182 17.6% 92 411 11.1% 8 556 19.2%
3 42 128 5.0% 3 892 9.5% 42 526 5.1% 4 916 11.0%
4 16 045 1.9% 1 791 4.4% 15 254 1.8% 1 979 4.4%
5+ 8 473 1.0% 1 035 2.5% 7 001 0.8% 988 2.2%
We conducted a preliminary Cox regression analysis to assess the association of
the covariates with readmission. This analysis revealed that all covariates could be
significant risk factors associated with readmission, thus all were considered in a
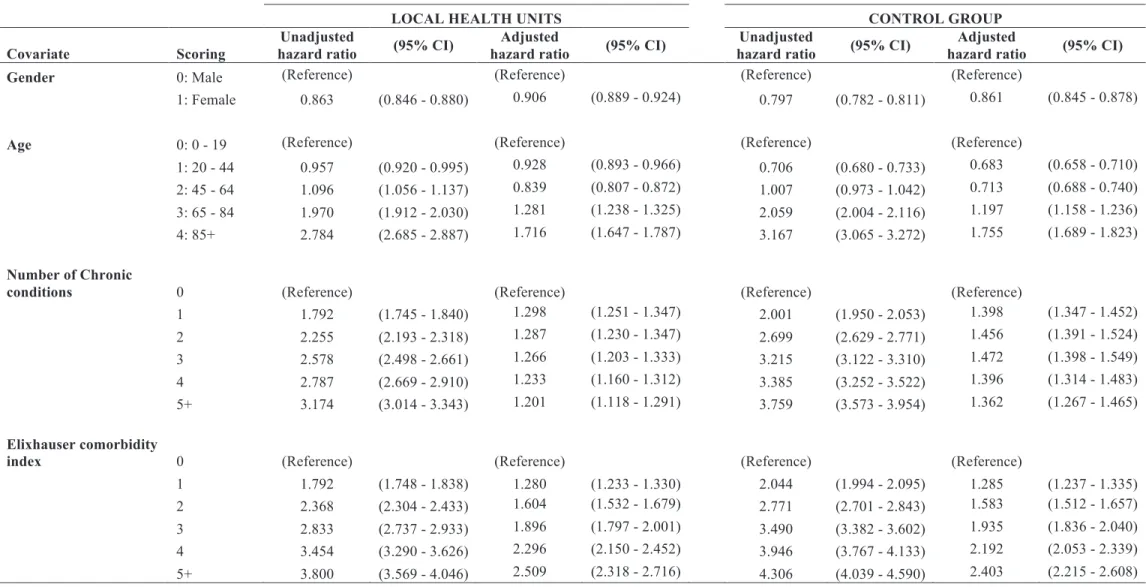
multivariate Cox regression. Table 5 shows the results of unadjusted hazard ratio that
provide the association of the lone covariate with time to readmission, and the results of
the multivariate Cox regression model which we termed adjusted hazard ratio.
The unadjusted hazard ratio showed increased likelihood of readmission for older
age groups, increasing number of chronic conditions and comorbidities, and a decreased
likelihood of readmission for female individuals. Despite LHU and control group
presented the same pattern of unadjusted hazard ratio, data suggests that LHU present a
decreased risk of readmission for individuals with most chronic conditions and
comorbidities when compared to control group.
The multivariate Cox regression models revealed that all covariates were
significant predictors for readmission, both in LHU and control group. We observed
similar risk patterns in both groups regarding gender and age. Female individuals had a
decreased likelihood of readmission when compared to men, with control group
presenting a better hazard ratio [LHU: 0.906 (0.889 Ð 0.924) and Control group: 0.861
(0.845 Ð 0.878)]. The risk of readmission increased throughout age groups, being
consistent with unadjusted hazard ratio (e.g., individuals aged 85+ had an increased
likelihood of readmission 1.716 times higher than those aged 0-19 in LHU, and 1.755 in
the control group). The adjusted hazard ratio in LHU decreased with increasing number
of chronic conditions, contrasting with the pattern for unadjusted hazard ratios. In the
control group, individuals with two chronic conditions were the ones with higher
likelihood of readmission (HR 1.472; 95% CI: 1.398 Ð 1.549) and the ones with five or
Ð 1.465). The increased number of comorbidities represented increasing risk of
readmission, both at univariate and multivariate models. Individuals with five or more
comorbidities in LHU faced a likelihood of readmission 2.509 times higher than those
that had no comorbidities. In the control group, the likelihood of readmission of these
Table 5: Multivariate Cox regression for LHU and control group index admissions.
LOCAL HEALTH UNITS CONTROL GROUP
Covariate Scoring
Unadjusted
hazard ratio (95% CI)
Adjusted
hazard ratio (95% CI)
Unadjusted
hazard ratio (95% CI)
Adjusted
hazard ratio (95% CI)
Gender 0: Male (Reference) (Reference) (Reference) (Reference)
1: Female 0.863 (0.846 - 0.880) 0.906 (0.889 - 0.924) 0.797 (0.782 - 0.811) 0.861 (0.845 - 0.878)
Age 0: 0 - 19 (Reference) (Reference) (Reference) (Reference)
1: 20 - 44 0.957 (0.920 - 0.995) 0.928 (0.893 - 0.966) 0.706 (0.680 - 0.733) 0.683 (0.658 - 0.710)
2: 45 - 64 1.096 (1.056 - 1.137) 0.839 (0.807 - 0.872) 1.007 (0.973 - 1.042) 0.713 (0.688 - 0.740)
3: 65 - 84 1.970 (1.912 - 2.030) 1.281 (1.238 - 1.325) 2.059 (2.004 - 2.116) 1.197 (1.158 - 1.236)
4: 85+ 2.784 (2.685 - 2.887) 1.716 (1.647 - 1.787) 3.167 (3.065 - 3.272) 1.755 (1.689 - 1.823)
Number of Chronic
conditions 0 (Reference) (Reference) (Reference) (Reference)
1 1.792 (1.745 - 1.840) 1.298 (1.251 - 1.347) 2.001 (1.950 - 2.053) 1.398 (1.347 - 1.452)
2 2.255 (2.193 - 2.318) 1.287 (1.230 - 1.347) 2.699 (2.629 - 2.771) 1.456 (1.391 - 1.524)
3 2.578 (2.498 - 2.661) 1.266 (1.203 - 1.333) 3.215 (3.122 - 3.310) 1.472 (1.398 - 1.549)
4 2.787 (2.669 - 2.910) 1.233 (1.160 - 1.312) 3.385 (3.252 - 3.522) 1.396 (1.314 - 1.483)
5+ 3.174 (3.014 - 3.343) 1.201 (1.118 - 1.291) 3.759 (3.573 - 3.954) 1.362 (1.267 - 1.465)
Elixhauser comorbidity
index 0 (Reference) (Reference) (Reference) (Reference)
1 1.792 (1.748 - 1.838) 1.280 (1.233 - 1.330) 2.044 (1.994 - 2.095) 1.285 (1.237 - 1.335)
2 2.368 (2.304 - 2.433) 1.604 (1.532 - 1.679) 2.771 (2.701 - 2.843) 1.583 (1.512 - 1.657)
3 2.833 (2.737 - 2.933) 1.896 (1.797 - 2.001) 3.490 (3.382 - 3.602) 1.935 (1.836 - 2.040)
4 3.454 (3.290 - 3.626) 2.296 (2.150 - 2.452) 3.946 (3.767 - 4.133) 2.192 (2.053 - 2.339)
4.3.
I
MPACT OF VERTICAL INTEGRATION
4.3.1.
R
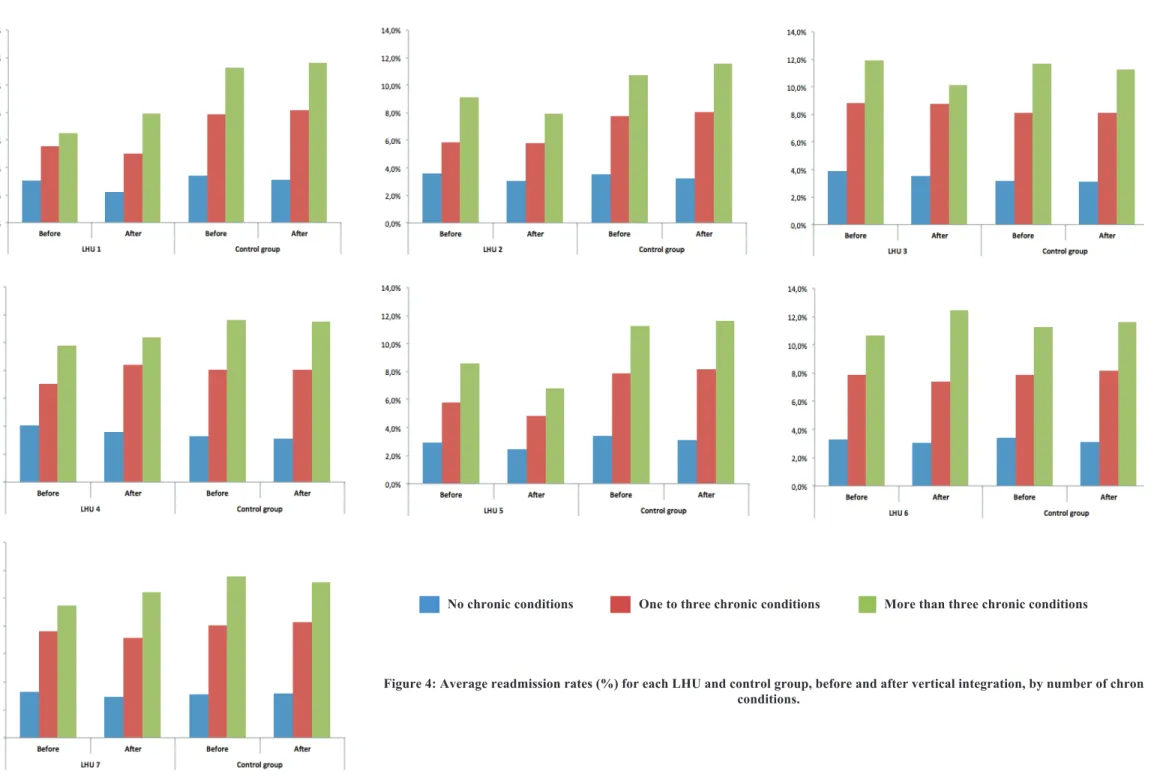
EADMISSION RATES BEFORE AND AFTER VERTICAL INTEGRATIONWe analysed crude readmission rates for LHU and control group, before and after vertical integration, for the group of individuals with no chronic conditions, with one to three chronic conditions, and with more than three chronic conditions (Figure 4). Overall, data suggests the same decreasing pattern for LHU and control group for individuals with no chronic conditions. For individuals with chronic conditions, we obtained mixed results, specifically for the individuals with more than three chronic conditions.
For individuals with no chronic conditions, readmission rates faced a reduction in all LHU after vertical integration, being more expressive in LHU 1 (-0.8%). The same decreasing pattern occurred in the control group.
For individuals with one to three chronic conditions, most of LHU decreased readmission rates after vertical integration, with LHU 5 decreasing by -0.9% and LHU1, LHU 6, and LHU 7 decreasing -0.5%. Only LHU 4 experienced an increase on readmission rates (1.4%). The control group faced an increase in readmission rates for these individuals.
No chronic conditions One to three chronic conditions More than three chronic conditions
4.3.2.
I
MPACT OF VERTICAL INTEGRATION ON THE RISK-
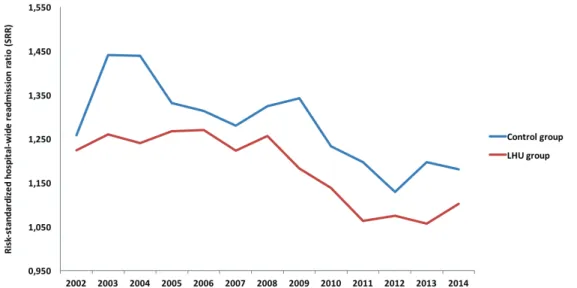
STANDARDIZED READMISSION RATIOWe computed the SRR for LHU and control group in the period 2002 to 2014
(Figure 5). For all years, the control group presented a higher SRR than LHU. From 2007
to 2010, LHU experienced a high decrease of SRR. Later in the control group, from 2009
to 2011, we observed the same effect.
Figure 5: Risk-standardized readmission ratio (SRR) for LHU and control group in the period 2002-2014.
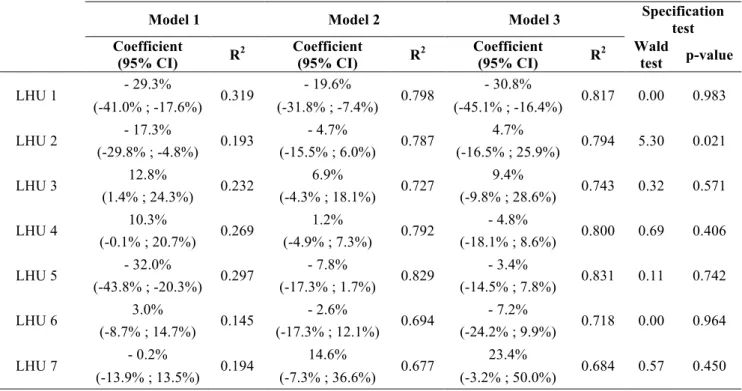
We performed DiD models with different specifications with natural logarithm of
risk-standardized readmission ratio as dependent variable. In the last model we also ran
a Wald test to check the parallel trend assumption for DiD (Table 6). For LHU 1, vertical
integration has promoted a decrease in SRR, consistent with all three models. The result
for LHU 2 shows a decrease in SRR in model 1 and 2, but an increase in model 3.
However, the coefficient from model 3 belongs to the 95% confidence interval of model
2. The Wald test was significant, therefore parallel trend assumption cannot be assured,
and one cannot attribute these results solely to vertical integration.
There is evidence that vertical integration promoted a 9.4% increase in SRR for
LHU 3, but it was not significantly different from the control group. For LHU 4, LHU 5
and LHU 6, we observed a reduction of SRR varying from -4.8% to -7.2%, but without
statistical significance, meaning there is no significant differences in risk-standardized
readmission ratio between the LHU and the control group in the period pre- and
post-integration. For LHU 7, the results show an increase of 23.4% of SRR in model 3, but