ABSTRACT:Objective:To estimate the prevalence of depressive symptoms in the elderly in São Paulo city, Brazil (SABE Study), in 2006 and to identify risk factors associated with the 2006 prevalence and protective factors among those who did not have depressive symptoms in the assessments conducted in 2000 and 2006. Methods: In this cross-sectional and longitudinal study,the Geriatric Depression Scale was used for inclusion in the cohort in 2000 and also in 2006. Results: The prevalence of depressive symptoms in 2006 was 14.2% (95%CI 11.8 – 16.7), and 74.8% of the participants did not present depressive symptoms in 2000 neither in 2006. Logistic regression models were constructed, with different groups of variables (socio-demographic variables, status and perception of health and memory) adjusted for sex and age. In the final logistic regression model, the following factors were associated with depressive symptoms: self-assessment of vision, oral health, memory and of generalhealth as poor, dependence for basic activities of daily living, and moderate or severe family dysfunction. Protective factors against presenting depressive symptoms in the 2000 and 2006 phases were: being male, absence of pulmonary disease and positive self-assessment of health. Conclusion: Depressive symptoms were frequent among the elderly, and were associated with health problems, dependence and family dysfunction. These factors should be addressed in health policy planning for the care of these elderly.
Keywords: Aged. Depression. Aging. Prevalence. Health status. Activities of daily living.
Depressive symptoms among the elderly in
São Paulo city, Brazil: prevalence and
associated factors (SABE Study)
Sintomas depressivos em idosos do município de São Paulo, Brasil:
prevalência e fatores associados (Estudo SABE)
Cristiane Lara Mendes-ChiloffI, Maria Cristina Pereira LimaI, Albina Rodrigues TorresI,
Jair Lício Ferreira SantosII, Yeda Oliveira DuarteIII, Maria Lúcia Lebrão (in memoriam)IV,
Ana Teresa De Abreu Ramos CerqueiraI
IDepartment of Neurology, Psychology and Psychiatry, Medical School of Botucatu, Universidade Estadual “Júlio de Mesquita Filho” – Botucatu (SP), Brazil.
IIDepartment of Social Medicine, Medical School of Ribeirão Preto, Universidade de São Paulo – Ribeirão Preto (SP), Brazil.
IIIDepartment of Medical-Surgical Nursing, Nursing School, Universidade de São Paulo – São Paulo (SP), Brazil.
IVDepartment of Epidemiology, School of Public Health, Universidade de São Paulo – São Paulo (SP), Brazil.
Corresponding author: Cristiane Lara Mendes Chiloff. Universidade Estadual “Júlio de Mesquita Filho”. Faculdade de Medicina
de Botucatu. Departamento de Neurologia, Psicologia e Psiquiatria. Rubião Júnior, sem número, CEP: 18618-970, Botucatu, SP,
Brasil. E-mail: cris.mendeschiloff@gmail.com
Conflict of interests: nothing to declare – Financial support: none.
INTRODUCTION
Depression symptoms have a high prevalence among the elderly, presenting a great vari-ability of these symptoms in this age group, probably due to different diagnostic criteria adopted and the characteristics of the studied population1-6.
Among community-dwelling older adults, the prevalence of depression and depression symptoms ranged from 6.3 to 63.0%1-3,7,8. In Brazilian population studies using screening instru-ments for depression symptoms, prevalence rates were found ranging from 13.0 to 38.0%4,5. Depression symptoms in the elderly were associated with different factors such as loss of life quality6, worse socioeconomic condition2,6-9, presence of common age-related dis-eases10, increased risk of mortality11,12, decline in functional capacity12, and burden on the family and health services13.
This research is a subproject of the SABE Study14,15 and aimed at estimating the prevalence of depression symptoms in the elderly of São Paulo city in 2006 as well as identifying risk fac-tors associated with the prevalence in 2006, in addition to protective facfac-tors among the elderly who did not present depression symptoms in the assessments conducted in 2000 and 2006.
METHODS
A cross-sectional and longitudinal study was realized from the representative probability sample of elderly living in São Paulo (SABE Study). Among the 1,115 participants interviewed
ReSUMO:Objetivo: Estimar a prevalência de sintomas depressivos em idosos do município de São Paulo, Brasil (Estudo SABE), em 2006 e identificar fatores de risco associados a essa prevalência em 2006 e fatores de proteção entre os idosos que não apresentaram sintomas depressivos nas avaliações realizadas em 2000 e 2006. Métodos: Estudo transversal e longitudinal que utilizou a Escala de Depressão Geriátrica na inclusão da coorte em 2000 e em 2006. Resultados: A prevalência de sintomas depressivos em 2006 foi de 14,2% (IC95% 11,8 – 16,7) e 74,8% dos participantes não apresentaram sintomas depressivos em 2000 nem em 2006. Foram construídos modelos de regressão logística, tendo como exposição diferentes grupos de variáveis (sociodemográficas; condições e percepção de saúde e memória) ajustando-se para sexo e idade. No modelo final da regressão logística, associaram-se a sintomas depressivos: autoavaliação da visão, da saúde bucal, da memória e da saúde geral como ruins, dependência para atividades básicas de vida diária e disfunção familiar moderada ou grave. Os fatores de proteção para não ter apresentado sintomas depressivos nas fases de 2000 e 2006 foram: sexo masculino, não referir doença pulmonar e avaliar positivamente a saúde. Conclusão: Sintomas depressivos nos idosos estudados foram frequentes e se associaram com piores condições de saúde, dependência e disfunção familiar e tais fatores devem ser considerados no planejamento de políticas de saúde para prestação de cuidados a esses idosos.
in 2006, 972 elderly who answered the Geriatric Depression Scale (GDS) to detect depres-sion symptoms were analyzed. In the longitudinal analysis, we included 945 elderly who responded to the GDS in the two phases analyzed.
INSTRUMENTS
The primary instrument for data collection of SABE Study was a household survey with questions related to three modules: sociodemographic, health conditions, and use of health-care services. We selected appropriate variables to this study and the following instruments: • GDS16,17: 15-item scale with cutoff from 6 to 10 points for mild depression and 11 or
more for severe depression, according to Almeida and Almeida18;
• Mini-Mental State Examination (MMSE): modified version of the MMSE developed by Folstein et al.20 and validated in Chile by Icaza and Albala19. It established the cutoff in 12/1319;
• Pfeffer Functional Activities Questionnaire: developed by Pfeffer et al.21; it consists of ten items and evaluates the functionality by means of the degree of independence for the performance of instrumental activities of daily living, with scores ranging from 0 to 30, cutoff point of 5/6, and higher scores indicating greater impairment;
• Katz Index for activities of daily living22: used to assess the autonomy reported by the individual in activities related to self-care. Three types of scores were used, indicating the different levels of ability: independent, need some assistance, and dependent; • Lawton Index for instrumental activities of daily living23: used to evaluate the
reported autonomy in instrumental activities,
• The Family Apgar: instrument with five questions to measure the satisfaction of family members in relation to five components considered the basis of union and functionality of any family: adaptation, companionship, development, affectivity, and response capacity24,25. The results obtained were converted into scores starting from a range of responses with five options for each component to be evaluated: “always” corresponds to score = 4, “often” = 3, “sometimes” = 2, “seldom” = 1, and “never” = 0. The sum of the obtained values corresponds to the score that suggests the quality of family functionality25.
PROCEDURE
DATA ANALYSIS
Data were analyzed using STATA 10.026 program in survey function, which allows incorporating aspects related to complex sampling design. In the bivariate analysis, we used the Rao–Scott test, which allows adjusting for sampling design, which is recom-mended in studies with complex samples27. For the analysis in the longitudinal study, we used the merge function of STATA 10.026 to merge the databases related to both 2000 and 2006 cohorts. We conducted logistic regression stepwise-backward type, being included in the models all the variables that presented association with the outcomes at a signifi-cance level of 90% (p < 0.10) in the bivariate analysis, and other variables of theoretical relevance to control free of confounding associations. The variance inflation factor (VIF) was used to evaluate the presence of collinearity between variables in the different logis-tic regression models28.
ETHICAL CONSIDERATIONS
The “SABE Project 2005 - Health, Welfare and Aging: the conditions of health and life of the elderly in São Paulo” (Research Protocol number 1345) was approved by the Research Ethics Committee of the School of Public Health of the Universidade de São Paulo (COEP).
RESULTS
CROSS-SECTIONAL STUDY: PREVALENCE AND ASSOCIATED FACTORS
The occurrence of depression symptoms also associated with cognitive impairment (p < 0.01), with worse self-assessment in relation to memory (p < 0.001), with report of worsening memory loss compared to the previous year (p < 0.001), with worse perception in relation to own health (p < 0.001), and worse assessment of health status compared to a year ago (p < 0.001). Regarding functional capacity, there was an association of depression symptoms with worse performance in basic activities (p < 0.001) and instrumental activi-ties of daily living (p < 0.001), and worse family functioning (p < 0.001).
We used logistic regression to determine the association of cases and noncases of depres-sion symptoms (2006) with different groups of variables (sociodemographic, self-reported diseases, health conditions, perception of health and memory, reported functional capac-ity) that associated with depression symptoms in the bivariate analysis (p < 0.10). The final model was composed of all the variables that were significant in previous models. All mod-els were adjusted for age and gender.
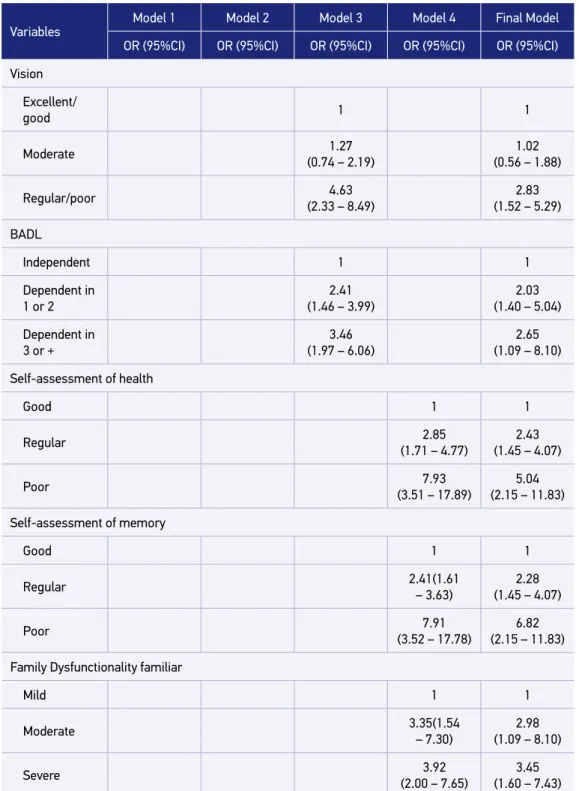
The following variables remained associated with a higher risk for depression symptoms: self-report of vision problems with odds ratio (OR) equal to 2.83 (95%CI 1.52 – 5.29); oral health (OR = 1.77; 95%CI 1.08 – 2.92), self-perception of health as regular (OR = 2.43; 95%CI 1.45 – 4.07) or poor (OR = 5.04; 95%CI 2.15 – 11.83); memory assessment as regular (OR = 2.28; 95%CI 1.45 – 4.07) or poor (OR = 6.82; 95%CI 2.15 – 11.83) , family dysfunction as moderate (OR = 2.98; 95%CI 1.09 – 8.10) or severe (OR = 3.45; 95%CI 1.60 – 7.43); depen-dence on one or two basic activities of daily living (OR = 2.03; 95%CI 1.40 – 5.04) and in three or more of the basic activities (OR = 2.65; 95%CI 1.09 – 8.10) (Table 1).
LONGITUDINAL STUDY: ANALYSIS OF PROTECTIVE FACTORS
In order to identify protective factors, individuals who did not present depression symp-toms in 2000 or 2006 (n = 707) were selected. Those individuals were studied in relation to sociodemographic characteristics, health status, and performance of basic and instrumen-tal activities of daily living.
It was found that 25.2% (n = 238) of the elderly presented depression symptoms in both evaluations or at least in one of them, and 74.8% did not present symptoms in any of the time points of the study. In 2000, 9.9% of the elderly had depression symptoms, and in 2006 this percentage was 7.7% (Table 2).
In the comparison of depression symptoms’ occurrence among male and female, it was observed that presenting depression symptoms in both time points of the study was more frequent among women (p < 0.001).
Variables
Model 1 Model 2 Model 3 Model 4 Final Model
OR (95%CI) OR (95%CI) OR (95%CI) OR (95%CI) OR (95%CI)
Age (continuous)
1.03 (0.99 – 1.06)
1.02 (0.99 – 1.06)
0.99 (0.96 – 1.03)
1.01 (0.98 – 1.05)
0.99 (0.95 – 1.03)
Gender
Female 1 1 1 1 1
Male 2.38
(1.46 – 3.87)
1.88 (1.17 – 3.03)
1.52 (1.01 – 2.28)
1.68 (1.05 – 2.68)
1.41 (0.88 – 2.28)
Perception of income Sufficient 1
Insufficient (1.52 –3.52)2.31
Religious activity
Participate 1
Do not participate
2.24 (1.37 – 3.68)
Previous Stroke
No 1
Yes 2.38
(1.28 – 4.44)
Heart diseases
No 1
Yes 1.58
(1.04 – 2.31)
Previous depression
No 1
Yes 2.28
(1.33 – 3.90)
Oral health
No 1 1
Yes 2.53
(1.61 – 3.93)
1.77 (1.08 – 2.92)
Table 1. Logistic regression: prevalence of depression symptoms and sociodemographic variables, health conditions, self-assessment of health and memory, and performance on the instrumental activities of daily living—SABE study cohort A06 (n = 972).
Table 1. Continuation.
Variables
Model 1 Model 2 Model 3 Model 4 Final Model
OR (95%CI) OR (95%CI) OR (95%CI) OR (95%CI) OR (95%CI)
Vision
Excellent/
good 1 1
Moderate 1.27
(0.74 – 2.19)
1.02 (0.56 – 1.88)
Regular/poor (2.33 – 8.49)4.63 (1.52 – 5.29)2.83
BADL
Independent 1 1
Dependent in 1 or 2
2.41 (1.46 – 3.99)
2.03 (1.40 – 5.04)
Dependent in 3 or +
3.46 (1.97 – 6.06)
2.65 (1.09 – 8.10)
Self-assessment of health
Good 1 1
Regular 2.85
(1.71 – 4.77)
2.43 (1.45 – 4.07)
Poor 7.93
(3.51 – 17.89)
5.04 (2.15 – 11.83)
Self-assessment of memory
Good 1 1
Regular 2.41(1.61
– 3.63)
2.28 (1.45 – 4.07)
Poor 7.91
(3.52 – 17.78)
6.82 (2.15 – 11.83)
Family Dysfunctionality familiar
Mild 1 1
Moderate 3.35(1.54
– 7.30)
2.98 (1.09 – 8.10)
Severe 3.92
(2.00 – 7.65)
3.45 (1.60 – 7.43)
factor for this symptomatology (p < 0.001). There was a significant association between positive assessment of health and memory and the absence of depression symptoms in 2000 and 2006. There was a lower percentage of impairment in the performance of instru-mental activities of daily living (p < 0.0001) among those who did not present depression symptoms in both assessments.
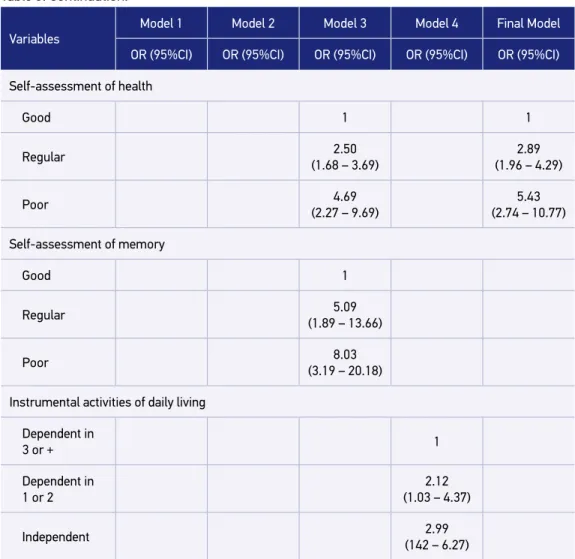
Female gender (OR = 1.75; 95%CI 1.24 – 2.47), presence of chronic lung disease (OR = 2.07; 95%CI 1.33 – 3.22), self-perception of health as regular (OR = 2.89; 95%CI 1.96 – 4.29) or poor (OR = 5.43; 95%CI 2.74 – 10.77), remained independently associated with the pres-ence of depression symptoms, after using the logistic regression also in subsequent models, composed of sociodemographic variables, followed by those related to health, to self-as-sessments of health and memory, and finally by those related to the performance in basic and instrumental activities of daily living (Table 3).
DISCUSSION
DEPRESSION SYmPTOmS
The prevalence of depression symptoms was 14.5% (95%CI 11.8 – 16.7), relatively lower than those described in the vast majority of national population studies that also used screening tools for depression symptoms. This great variability was probably due not only to differences in diagnostic criteria and applied tools but also to the characteristics of each studied population3-5,8,29-36.
In Brazil, back in the 1990s, Veras and Coutinho29 observed different percentages (20.9, 23.0, and 36.8%) of depression symptoms in neighborhoods with populations that differed from a socioeconomic standpoint. They used the SHORT-CARE, but accord-ing to them this is an instrument with which we must be careful when choosaccord-ing the cutoff point to investigate depression symptoms due to its low specificity and sensi-tivity, which were detected in validity and reliability studies. Cerqueira30 studied the first cohort of SABE study in 2000 with the same instrument (GDS-15) and reported
Table 2. Distribution of the population of cohorts A00 and A06, according to the presence or absence of depression symptoms (n = 945).
Depression symptoms 2006 Total
Noncase Case
2000 % % %
Noncase 74.8 7.7 82.5
Case 9.9 7.6 17.5
Variables
Model 1 Model 2 Model 3 Model 4 Final Model
OR (95%CI) OR (95%CI) OR (95%CI) OR (95%CI) OR (95%CI)
Age (continuous) 1.02
(0.99 – 1.14)
1.00 (0.97 – 1.02)
0.99 (0.97 – 1.02)
1.01 (0.99 – 1.04)
0.99 (0.93 – 1.02)
Gender
Female 1 1 1 1 1
Male 1.64
(1.14 – 2.29)
1.70 (1.20 – 2.40)
1.62 (1.14 – 2.30)
2.02 (1.29 – 3.14)
1.75 (1.24 – 2.47)
Income (MW)
< 1 1
1–2.99 1.37
(0.72 – 2.60)
3–4.99 2.13
(1.03 – 4.38)
5 or + 1.99
(1.00 – 3.95)
Hypertension
Yes 1
No 1.48
(1.02 – 2.13)
Lung diseases
Yes 1 1
No 2.18
(1.27 – 2.37)
2.07 (1.33 – 3.22)
Osteoarticular diseases
Yes 1
No 1.72
(1.27 – 2.37)
Table 3. Logistic Regression of absence of depression symptoms in cohorts A00 and A06 and sociodemographic variables, health conditions, self-assessment of health and memory, and performance in instrumental activities of daily living—SABE study, cohorts A00 and A06 (n = 945).
Variables
Model 1 Model 2 Model 3 Model 4 Final Model
OR (95%CI) OR (95%CI) OR (95%CI) OR (95%CI) OR (95%CI)
Self-assessment of health
Good 1 1
Regular 2.50
(1.68 – 3.69)
2.89 (1.96 – 4.29)
Poor 4.69
(2.27 – 9.69)
5.43 (2.74 – 10.77)
Self-assessment of memory
Good 1
Regular 5.09
(1.89 – 13.66)
Poor 8.03
(3.19 – 20.18)
Instrumental activities of daily living
Dependent in
3 or + 1
Dependent in 1 or 2
2.12 (1.03 – 4.37)
Independent 2.99
(142 – 6.27)
OR: odds ratio; 95%CI: 95% confidence interval; MW: minimum wage.
Table 3. Continuation.
in three different socioeconomic levels, with a representative sample of the city similar to this study, and obtained a prevalence of 13% of depression symptoms. This result most resembles that obtained in this study.
In the United States, the Epidemiological Catchment Area Study (ECA)38 showed a prev-alence of 15%. However, other international studies described a higher prevprev-alence than that obtained in this study, like the Share study39, a European study that applied the Euro-D. In this study, the rates ranged from 18.5 to 36.8%, probably due to the instrument used and the specific characteristics of European populations.
The results related to the prevalence of depression symptoms in other international studies3,7,8,32,36 differ from that of this research, once they investigated the socioeconomic impact on the occurrence of these symptoms, focusing only on low-income populations. Borjoquez-Chapella et al.8 studied low-income elderly in Mexico and recorded a preva-lence of 43% by means of CES-D. Wada et al.36 investigated depression symptoms in four small country communities in Japan using the GDS and found a prevalence of 33.5%. A similar study was developed in Korea by Kim et al.3 also using the GDS with elderly liv-ing in urban and rural areas. This study obtained a prevalence of 63%. Torija et al.7 eval-uated elderly in the district area of Guadalajara, Mexico, which included urban and rural areas, and found a prevalence of 19.7% of depression symptoms using the GDS. Chong et al.32 investigated the prevalence of depression symptoms in three different commu-nities in southern Taiwan (rural, semi-urban, and urban) and recorded a prevalence of 15.3% using the GMS-AGECAT.
FACTORS ASSOCIATED WITH DEPRESSION SYmPTOmS
The results of logistic regression of this study indicated a significant association of depres-sion symptoms with some health conditions (self-report of poor visual and oral health), dependence for basic activities of daily living, self-evaluation of memory and health as poor, and dysfunctional family (moderate or severe).
The association of depression symptoms with the decline in visual function, according to Ribeiro et al.40 and Luiz et al.41, often affects the performance of daily activities, restricts social participation, and limits performance in activities that the elderly wish or need to perform, possibly leading to a decrease in the quality of life and high rates of depression in this population. Another frequent problem in aging, but rarely addressed in the litera-ture, is oral health, although it is known that, in this period of life, oral hygiene may be reduced and oral diseases in the elderly may increase. Stressful events, psychological disor-ders, depression symptoms, or the place of residence may influence, directly or indirectly, the oral health of the individual42.
indicates the impact that the functional limitations may have on the state of mind of the elderly and vice versa.
An association of depression symptoms with worst self-assessment of memory was observed; however, it was found that the evaluation of the memory as poor has not indi-cated the presence of cognitive impairment, according to the evaluation performed. Among the high percentage (43%) of the elderly who evaluated their memory performance as regular or poor, only 8.1% scored for cognitive impairment in the MMSE. Some authors suggest that the complaints of memory performance may be more directly linked to psy-chological factors such as anxiety, depression, and high self-demand43, which seem to be confirmed in this study. Negative assessment of memory increased the risk for depres-sion symptoms by 6.82 times compared to the elderly that positively assessed its mne-monic performance.
Self-perception of health as poor seems to be a marker for the presence of depression symptoms. The self-assessment of health by means of a single question has been widely used in population survey44,45. Barros et al.45 reported that the self-assessment of the indi-vidual seems to take into account the overall signs and symptoms of disease (diagnosed or not by health professionals) and the impact of these conditions on the physical, mental, and social well-being of that individual. Studies indicate that the presence of chronic diseases is a strong determinant for the perception of health as poor45-47.
The association between the perception of family dysfunction and depression symptoms also seem to compose the set of perceptions synthesized in the self-rated health. Torres et al.48 discuss the difficulty of the current family structure to provide care for the elderly becom-ing dependent and the consequences on family dynamics and quality of life of the elderly. This research indicates that the elderly who is aware of the family difficulty may present depression symptoms more often. However, it is noteworthy that this is a cross-sectional study, which cannot reveal the direction of that influence.
With the objective of identifying the protective factors, the following variables remained associated with the absence of depression symptoms in 2000 and 2006: male gender, no mention of lung disease, and positive assessment of health, reflecting a reversal in the iden-tified risk factors.
Several population studies indicate higher frequency of depression symptoms in female gender1,6,9,49, suggesting greater social vulnerability in women. It is also common for women the presence of lower levels of education and income, to live alone, to present more phys-ical illnesses, and to have greater functional limitations. This description is very similar to the data from this study, which may indicate a condition of vulnerability in this population. It is worth noting that Cerqueira30 had already pointed out this unfavorable condition for women since the first evaluation of the SABE study.
these individuals. This study revealed that, among the elderly who did not present depression symptoms in any of the evaluations (2000 and 2006), 83% have reported absence of diseases, and the prevalence of depression symptoms increased the greater the number of referred diseases. Among the elderly who did not present depression symptoms, most had auton-omy for basic and instrumental activities of daily living. Thus, a positive self-rated health seems to correspond to a good health condition and functionality, and all of these condi-tions may be considered as protective factors in the occurrence of depression symptoms.
It is worth noting that in this study there was no significant association of depression symptoms and age. Many other studies are also inconclusive in relation to this aspect, but this is still a controversial and relevant topic to the field. The association of depression with increasing age was observed in several studies32,33. Old age is the phase in which individu-als are very exposed to losses and adverse events, on the other hand, there is data showing a decrease or stabilization in the occurrence of depression symptoms with advancing age, and the rates may achieve a peak over the more advanced ages31. Nguyen et al.51 also studied the relationship between age and depression symptoms and found an association between increasing age with more somatic symptoms and physical discomfort, especially in cohorts with 70 years or more. The age alone does not increase the risk of depression; however, the effects of age on depression symptoms can be attributed to common health problems and disability in the elderly. In this study, we observed a similar situation: there was no associa-tion of depression symptoms with increasing age, but there was an associaassocia-tion of depres-sion symptoms with chronic physical multimorbidity, common in aging, as well as with the higher use of drugs and self-perception of health as poor.
LImITATIONS
The tool applied to assess depressive symptoms (GDS17) in elderly in SABE study detects the occurrence of these symptoms in the last month, thus limiting the analy-sis of depressive symptoms throughout their lives. Therefore, in addition to this char-acteristic of the scale, the cyclical nature of depression and depressive symptoms sug-gests that elderly might have presented depressive symptoms between the different time points of the study, preventing from estimating the incidence of depressive symptoms with this study design.
CONCLUSION
reserves to deal with crisis situations, and absence of satisfactory support network. It was also remarkable the association of depressive symptoms to the health condition of the elderly: higher occurrence of diseases, negative perception of their health and memory, dependence for activities of daily living, and perception of family dysfunction.
There is a belief that to ensure a non-debilitating health condition and active aging, the individual must be properly assisted, revealing the importance of planning and implementa-tion of social and health policies and programs for the care of the elderly, once the majority of the diseases and disability causes are subject to preventive or control actions.
1. Sherina M, Rampal SL, Aini M, Norhidayati H. The prevalence of depression among elderly in an urban area of Selangor Malaysia. Int Med J Malaysia 2005; 4(2): 57-63.
2. Romero LJ, Ortiz IE, Finley MR, Wayne S, Lindeman RD. Prevalence of depressive symptoms in New Mexico Hispanic and non-Hispanic white elderly. Ethn Dis 2005; 15(4): 691-7.
3. Kim JI, Choe MA, Chae YR. Prevalence and predictors of geriatric depression in community-dwelling elderly. Asian Nurs Res 2009; 3(3): 121-9.
4. Barcelos-Ferreira R, Pinto Junior JA, Nakano EY, Steffens DC, Livtoc J, Bottino CM. Clinically significant depressive symptoms and associated factors in community elderly subjects from São Paulo, Brazil. Am J Geriatr Psychiatry 2009; 17(7): 582-90.
5. Castro-Costa E, Lima-Costa MF, Carvalhais S, Firmo JOA, Uchoa E. Factors associated with depressive symptoms measured by the 12-item General Health Questionnaire in Community-Dwelling older adults (The Bambuí Health Aging Study). Rev Bras Psiquiatr 2008; 30(2): 104-9.
6. McDougall FA, Kvaal K, Mattews FE, Paykel E, Jones PB, Dewey ME, et al. Prevalence of depression in older people in England and Wales: the MRC CFA study. Psychol Med 2007; 37(12): 1787-95.
7. Torija JRU, Mayor JMF, Salazar MPG, Buisan LT, Fernandez RMT. Sintomas depressivos en personas mayores: prevalencia y factores asociados. Gac Sanit 2007; 21(1): 37-42.
8. Bojorquez-Chapela I, Villalobos-Daniel VE, Manrique-Espinoza BS, Tellez-Rojo MM, Salinas-Rodríguez A. Depressive symptoms among poor older adults in Mexico: prevalence and associated factors. Rev Panam Salud Publica 2009; 26(1): 70-7.
9. Ma X, Xiang YT, Li SR, Xiang YQ, Guo HL, Hou YZ, et al. Prevalence and sociodemographic correlates of depression in an elderly population living with family members in Beijing, China. Psychol Med 2008; 38(12): 1723-30.
10. Teng CT, Humes EC, Demetrio FN. Depressão e comorbidades clínicas. Rev Psiquiatr Clín 2005; 32(3): 149-59.
11. Schoevers RA, Beekman AT, Deeg DJ, Geerlings MI, Jonker C, Van Tilburg W. Risk factors for depression in later life: results of a prospective community based study (AMSTEL). J Affect Disord 2000; 59(2): 127-37.
12. Mendes-Chiloff CL, Ramos-Cerqueira AT, Lima MC, Torres AR. Depressive symptoms among elderly inpatients of a Brazilian university hospital: prevalence and associated factors.Int Psychogeriatr 2008; 20(5): 1028-40.
13. Blazer DG, Hybels CF, Pieper CF. The association of depression and mortality in elderly persons: a case for multiple, independent pathways. J Gerontol A Biol Sci Med Sci 2001; 56(8): M505-9.
14. Lebrão ML, Laurenti R. Condições de saúde. In: SABE – Saúde, Bem-estar e Envelhecimento – O Projeto SABE no Município de São Paulo. São Paulo: OPAS/ OMS; 2003. Cap. 4, p.73-91.
15. Lebrão ML, Duarte YAO. Desafios de um estudo longitudinal: o Projeto SABE. Saúde Coletiva 2008; 5(24): 166-7.
16. Yesavage JA, Brink TL, Rose TL, Lum O, Huang V, Adey M, et al. Development and validation of a geriatric depression screening scale: a preliminary report. J Psychiatr Res 1982-1983; 17(1): 37-49.
17. Sheik JI, Yesavage JA. Geriatric Depression Scale (GDS): recent evidence and development of a short version. Clin Gerontol 1986; 5: 165-73.
18. Almeida OP, Almeida SA. Confiabilidade da versão brasileira da Escala de Depressão em Geriatria (GDS) versão reduzida. Arq Neuro-Psiquiatr 1999; 57(2B): 421-6.
19. Icaza MC, Albala C. Projeto SABE. Minimental State Examination (MMSE) del studio de dementia em Chile: análisis estatístico. OPAS; 1999. p. 1-18.
20. Folstein, MF, Folstein SE, McHugh PR. Mini-Mental State: a practical method for grading the cognitive state of patient for clinician. J Psychiatr Res 1975; 12(3): 189-98.
21. Pfeffer RI, Kurosaki TT, Harrah Junior CH, Chance JM, Filos S. Measurement of functional activities in older adults in the community. J Gerontol 1982; 37(3): 323-9.
22. Katz S, Ford AB, Moskowitz RW, Jackson BA, Jaffe MW. Studies of illness in the aged. The index of ADL: a standardized measure of biological and psychosocial function. JAMA 1963; 914-9.
23. Lawton MP, Brody EM. Assessment of older people: self-maintaining and instrumental activities of daily living. Gerontologist 1969; 9(3): 179-86.
24. Smilkstein G. The family APGAR: a proposal for a family function test and its use by physicians. J Fam Pract 1978; 6(6): 1231-9.
25. Duarte YAO. Família: rede de suporte ou fator estressor – A ótica de idosos e cuidadores familiares. [Tese de doutorado]. São Paulo: Universidade de São Paulo; 2001.
26. STATA CORP. Stata Statistical Software: Release 10. College Station: StataCorp LP; 2007
27. Lee ES, Forthofer RN. Analyzing complex survey data. 2nd ed. Beverly Hills: Sage; 2006.
28. Kleinbaum DG, Kupper LL, Muller KE. Applied regression analysis and other multivariate methods. 2nd ed. Belmont: Duxbury Press; 1988. p. 210. 29. Veras RP, Coutinho ESF. Estudo de prevalência de
depressão e síndrome cerebral orgânica na população de idosos, Brasil. Rev Saúde Pública 1991; 25(3): 209-17.
30. Cerqueira ATAR. O estudo da saúde mental no projeto SABE: deterioração cognitiva e depressão. In: SABE – Saúde, Bem-estar e Envelhecimento – O Projeto SABE no Município de São Paulo. São Paulo: OPAS/OMS; 2003. Cap. 7, p. 143-65.
31. Beekman AT, Copeland JR, Prince MJ. Review of community prevalence of depression in later life. Br J Psychiatry. 1999; 174: 307-11.
32. Chong MY, Tsang HY, Chen CS, Tang TC, Chen CS, Yeh TL, et al. Community study of depression in old age in Taiwan: prevalence, life events and socio-demographic correlates. Br J Psychiatry 2001; 178(1): 29-35.
33. Stek ML, Vinkers DJ, Gussekloo J, van der Mast RC, Beekman AT, Westendorp RG. Natural history of depression in the oldest old: population-based prospective study. Br J Psychiatry 2006; 188: 65-9.
34. Lima MTR, Silva RS, Ramos LR. Fatores associados à sintomatologia depressiva numa coorte urbana de idosos. J Bras Psiquiatr 2009; 58(1): 1-7.
35. Blay SL, Ramos LR, Mari JJ. Validity study of a Brazilian version of the Older Americans Resources and Services (OARS) mental health screening questionnaire. J Am Geriatric Soc 1988; 36(8): 687-92.
36. Wada T, Ishine M, Sakagami T, Okumiya K, Fujisawa M, Murakami S, et al. Depression in Japanese community-dwelling elderly: prevalence and association with ADL and QOL. Arch Gerontol Geriatr 2004; 39(1): 15-23.
37. Goldberg D, Williams P. A user’s guide to the General Health Questionnaire. Windsor: NFER-Nelson; 1988.
38. Robins LN, Regier DA. Psychiatric disorders in America: the Epidemiologic Cathcment Area Study. New York: The Free Press; 1991.
39. Castro-Costa E, Dewey M, Stewart R, Banerjee S, Huppert F, Mendonça-Lima C, et al. Prevalence of depressive symptoms and syndromes in later life in ten European countries. Br J Psychiatry 2007; 191: 393-401.
40. Ribeiro JEC, Freitas MM, Araújo GS, Rocha THR. Associação entre aspectos depressivos e déficit visual causado por catarata em pacientes idosos. Arq Bras Oftalmol 2004; 67(5): 795-9.
41. Luiz LC, Rebelatto JR, Coimbra AMV, Ricci NA. Associação entre déficit visual e aspectos clínico-funcionais em idosos da comunidade. Rev Bras Fisioter 2009; 13(5): 444-50.
42. Kurihara E. Relação entre saúde bucal e fatores psicológicos de idosos institucionalizados e não institucionalizados. [Tese de doutorado] Piracicaba: Unicamp; 2010.
43. Paulo DLV, Yassuda MS. Queixas de memória de idosos e sua relação com escolaridade, desempenho cognitivo e sintomas de depressão e ansiedade. Rev Psiquiatr Clín 2010; 37(1): 23-6.
44. Ramos LR, Rosa TEC, Oliveira ZM, Medina MCG, Santos FRG. Perfil do idoso em área metropolitana na região sudeste do Brasil: resultados de inquérito domiciliar. Rev Saúde Pública 1993; 27(2): 87-94.
45. Barros MBA, Zanchetta LM, Moura EC, Malta DC. Auto-avaliação da saúde e fatores associados, Brasil, 2006. Rev Saúde Pública 2009; 43(Suppl 2): 27-37.
47. Rabelo DF, Maia CLF, Freitas PM, Santos JC. Qualidade de vida, condições e autopercepção da saúde entre idosos hipertensos e não hipertensos. Kairós 2010; 13(2): 115-30.
48. Torres GV, Reis LA, Reis LA, Fernandes MH. Qualidade de vida e fatores associados em idosos dependentes em uma cidade do interior do Nordeste. J Bras Psiquiatr 2009; 58(1): 39-44.
49. van der Wurff FB, Beekman AT, Dijkshoorn H, Spijker JA, Smits CH, Stek ML, et al. Prevalence and risk-factors for depression in elderly Turkish and Moroccan migrants in the Netherlands. J Affect Disord 2004; 83(1): 33-41.
50. Van Manen JG, Bindels PJ, Dekker FW, IJzermans CJ, van der Zee JS, Schadé E. Risk of depression in patients with chronic obstructive pulmonary disease and its determinants. Thorax 2002; 57(5): 412-6.
51. Nguyen HT, Zonderman AB. Relationship between age and aspects of depression: consistency and reliability across two longitudinal studies. Psychol Aging 2006; 21(1): 119-26.
Received on: 04/23/2015 Accepted on: 07/08/2015