IBS – ISCTE Business School
CSR COFFEE BRAND VALUE: A RETAILERS PERSPECTIVE
André Augusto Tavares de Mello Soalheira Moreira
A Dissertation presented in partial fulfilment of the Requirements for the Degree of Master in Marketing
Supervisor:
Doutor Nelson Ramalho, Assistant Professor, ISCTE-IUL
1 Acknowledgements
A very special thanks to my supervisor, Doutor Nelson Ramalho, that did not only supervise and guided my work as well as gave me a very strong encouragement along the way.
Furthermore, I would like to thank my father for the support he as always given me, generically in all matters in life and towards the elaboration of this dissertation, in particular.
Lastly I want to thank to all the intervenients that made directly or indirectly led to the elaboration and conclusion of this dissertation.
2
Resumo
O comércio justo, como um afloramento da responsabilidade social das organizações, ganhou importância com o comércio de café onde os consumidores finais, alegadamente, tendem a dar importância a marcas que adotam o comércio justo. No entanto, a escolha da marca é de facto feita pelos retalhistas que condicionam em primeira mão as escolhas dos consumidores. Esta questão tem vindo a ser objeto de estudo, especialmente em Portugal, facto que é de relevo se considerarmos sobretudo o facto do comércio de café em Portugal ser especialmente expressivo.
Este estudo tem por objetivo compreender até que ponto é que a escolha da marca de café pelos retalhistas reflete os atributos e preferências de RSO dos consumidores simultaneamente comparando a sua capacidade explicativa contra as variáveis não relacionadas com a RSO, tais como o preço, a qualidade do produto, na determinação do valor global da marca.
Os resultados obtidos com um inquérito efetuado a 88 retalhistas de café mostra uma clara associação entre as opções de compra dos retalhistas de café e refletem os atributos e preferências de RSO dos consumidores finais. Mais, demonstra ainda que o comércio justo é um preditor do valor global das marcas de café, enquanto que as variáveis não relacionadas com a RSO não o são.
Os resultados são discutidos à luz da teoria existente e dos resultados relativamente a ela existentes.
Palavras-chave: Responsabilidade social, Café, Comércio justo, Valor da marca
3
Abstract
Fair trade, as an expression of corporate social responsibility, gained especial importance in coffee business where end consumer allegedly give preference for brands endorsing fair trade. However, brand choice is actually made by retailers who condition first-hand the end consumer choices. This issue has been under researched, especially in Portugal, which is of relevance especially if we take into account the fact that Portuguese coffee trade has considerable expression.
This study is set to understand to which extent do retailers’ coffee brand choices reflect attributed CSR preferences to end consumers while also comparing its explanative power against non-CSR variables, such as price or product quality, in predicting overall brand equity.
Results with 88 coffee retailers show a clear association between retailer coffee brand choices and attributed CSR brand preferences of end consumers. Also, that fair trade is a predictor of overall coffee brand equity while non-CSR variables failed to be so.
Results are discussed at the light of extant theory and conclusions draw pertaining
Key-words: Social responsibility, Coffee, Fair trade, Brand equity
4
INDEX
1. INTRODUCTION ... 6
2. LITERATURE REVIEW ... 7
2.1. CSR: Origins and dimensions... 7
2.2. CSR as a competitive advantage ... 14
3. METHOD ... 20
3.1 Data analysis strategy ... 20
3.2 Measures ... 20
3.3 Procedure and sample ... 29
4. RESULTS ... 31
5. DISCUSSION AND CONCLUSION... 38
5
TABLE INDEX
Table 3.2.1 – Factorial analysis of retailer buying analysis………..26
Table 3.2.2 – Variables under study……….28
Table 3.2.3 – Age bands………30
Table 3.2.4 – Descriptive and bivariate analysis………..33
Table 3.2.5 – Model summary for extra-CSR………...37
6
1. INTRODUCTION
The Corporate Social Responsibility had its debut in the beginning of the XXth century, as a theoretical concept with Maurice’s Clark article: “The Changing Basis of Economic
Responsibility” in 1916 (Clark, 1916). Practical applications had already been seen nearly
half a century before in 1879 with Cadbury’s Bourneville village. Several other movements followed but it wasn’t until 1986, with the appearance of the Fair Trade Coffee Company, that it would impact coffee trade (Lyon, 2006) and this commodity would become the most important single product in the Fair Trade market (Dragusanu et al., 2013). As such the study of CSR is mostly well achieved when analysed in this products’ market, this being the reason why our survey will focus on the impact of CSR in coffee purchases.
It is as self-evident that CSR and Fair Trade, as a result of the former, has a direct positive impact on the promotion of better living conditions for coffee farmers (Aranda & Morales, 2002), as it is that fair trade certification programs appear to increase consumer welfare (Podhorsky, 2008).
Hertel et al. (2009) conducted a survey that shows that the large majority (75%) of the inquired consumers would be willing to pay a higher price for Fair Trade Certified Coffee. Sales data presents more modest results but it also shows the consumers who want to purchase fair trade coffee seem to be more insensitive to price increases (Arnot et al, 2006).
None of the studies presented focus on the Portuguese coffee market and most especially none addresses the impact that the consumers’ options have on coffee retailers’ purchasing decisions. As such, our study will focus on determining retailers’ perception on the impact that fair trade, as a CSR concretization, has on consumers’ coffee brand choices and, as a consequence, on their own purchase choices.
For this purpose, we shall review literature on CSR, fair trade, and CSR business outcomes with a special emphasis on coffee trade. Then, we will explain the methodological options made, namely about data collection and analysis, measures (interview script and questionnaire) presenting their respective psychometric figures, procedure and sample. After this, we show results firstly the descriptive and later those pertaining each hypothesis so to discuss and conclude on the subject.
7
2. LITERATURE REVIEW
2.1. CSR: Origins and dimensions
2.1.1 Historical background
Corporate Social Responsibility, as a concept, can be traced back more than a hundred years ago. In fact, as early as 1916 (Clark, 1916: 224) noted that: “Law and custom can at best never
keep pace with the needs which they are made to meet, for the simple reason that the need must be there before it can be felt, and it must be felt in a substantial way to be worth making a law about, and felt for a long time and by a considerable number to give rise to a custom”.
Considerable time before the cited author starting working on this subject, there were already some CSR initiatives promoted by companies even though the concept of CSR had not yet been crafted. A good example of this is Cadbury chocolate makers and the setup of the Bourneville factory, that by 1900 had workers’ committee, medical department, pension funds, education and training for employees and a village meant to promote housing for the employees, infrastructures and green environment (Dellheim, 1987).
Other good examples are Hewlett Packard, with the statement by the co-founder Dave Packard in 1939: “…a group of people get together and exist as an institution that we call a company
so that they are able to accomplish something collectively that they could not accomplish separately – they make a contribution to society…” (Ellsworth, 2002: 99) and Johnson &
Johnson, whose chairman in 1944, Robert Wood Johnson, published a credo in which it evidenced that its primary stakeholders were its customers, employees and the communities in which it operated in (Church & Rotolo, 2013).
Later references can be found in “Social Responsibilities of the Businessman” (Bowen 1953). The concept behind this author’s theory is based on the repeal of the 18th century of the “Laissez
Faire” given that society is unable to govern itself on grounds other than capitalism. These
authors also emphasize the growing loss of control from businessman given the need they had to share it with other stakeholders. In their own words (120):
8
“The modern businessman cannot be locked upon as an absolute monarch ruling by divine right and interpreting his social responsibilities as the carrying out of his own decisions as to what is “good” for the people. The businessman, rather, is subject to the standards of the community and to the pressures exerted by various interest groups.”
The free market theory was formerly presented by Adam Smith in 1776 in: “An inquiry into the
Nature and Causes of the Wealth of Nations”. Three elementary ideas are underlined by this
author in his book: The concept of the “invisible hand” that magically provides for the meeting between demand and supply, the idea that the individual pursuit of interests by the individuals always results in the greatest overall good to society, and that levels and kinds of goods and services in the market are to be determined by the market alone without any intervention.
Centuries later this concept would also be embraced by Milton Friedman (Friedman 1970/2007) when this author criticizes the CRS facing the company simply as an organisation meant to be profitable. The idea that companies should contribute to the development of society and the promotion of values is seen by Friedman as a distortion on the purposes of companies. In his book one citation stands out to express his true feelings about the subject (Friedman, 1962, 133):
“It shows a fundamental misconception of the character and nature of a free economy. In such an economy, there is one and only one social responsibility of business – to use its resources and engage in activities designed to increase its profits so long as it stays within the rules of the game, which is to say, engages in open and free competition, without deception or fraud.”
However, we believe that when Friedman mentions the “rules of the game” he was implying that companies should take into account the economic and social context. The same may be said about Drucker’s argument. As such, CSR - a phenomenon that was still at a very early stage when these authors made their statements - would become a paramount element in the market. As a result, to be within the rules of the game one must take CSR into account or, otherwise, the company as such cannot survive in the present social context due to lack of legitimation. Moreover, the customers’ choice is growingly more related to the alignment they feel with the companies’ values.
9
This message was asserted by this author, and reiterated by others (e.g. Henderson, 2001; Prieto-Carrón, et al 2006) which shows that its acceptance is contingent upon the doctrine positioning concerning the State, the Civil society, and the economic agents in building and preserving the social contract. Drucker (1973) presents a similar perspective. Later in time, addressing corporations’ managers, he argues: “They are responsible (...) for the community as
a whole… This (…) above all (…) requires commitment, conviction, dedication to the common good. Yes, each institution is autonomous and has to do its own work the way each instrument in an orchestra plays only its own part. But there is also the score, the community. And only if each individual instrument contributes to the score there is music. Otherwise there is only noise.” (Hesselbein et al 17)
All in all, although there is a large consensus on the added value of CSR the truth is that the position favourable or against CSR is mostly doctrinaire in nature, i.e. value-based. Both sides endeavour to add also evidence-based arguments by means of empirical testing. Notwithstanding such endeavours, extant findings are yet not able to offer a clear answer to the underlying question of knowing if CSR is indeed an asset or a liability. Reasons for this situation are multifactor and arise from the complexity of the issue, from conceptual diffused boundaries, from methods in use, from the specificity of samples, or possible from publication biases among other. We shall address some of these in the following sections.
2.1.2 Definitions and Dimensions
The CSR is one rather vague and wide concept corresponding to a set of actions and practices developed by organisations (Louche et al., 2010) and which has found expression both concerning the definition and the dimensions it includes. The World Business Council for Sustainable Development (cit. in Hopkins 2007) has defined CSR as: “the continuing
commitment by business to behave ethically and contribute to economic development while improving the quality of life of the workforce and their families as well as of the local community and the society at large.”. For the International Chamber of Commerce, CSR is “the voluntary commitment by business to manage its activities in a responsible way” (ICC,
2016). The International Organisation for Standardisation (ISO) defines CSR as: “a balanced
approach for organizations to address economic, social and environmental issues in a way that aims to benefit people, communities and society". Eells and Walton (1961 cit. in Crane et al.,
10
2008) referred to CSR as: “the problems that arise when the corporate enterprise casts its
shadow on the social scene, and of the ethical principles that ought to govern the relationships between the corporation and the society”.
Of the gathering of these concepts it results that, generically speaking, CSR reports to a set of actions developed by organisations having the society as the ultimate beneficiary. This should not, however, be confused with altruism. CSR may or may not be altruistic but in the large majority of the situations it is not (Information Resources Management Association, 2015).
Further developments in defining CSR actions have led to the theoretical construction of CSR dimensions which are to be divided into three or four, depending on the interpretations given by authors. As an example Carroll (1999) e Loew et al. (2004) have suggested four dimensions: Economic, Legal, Ethic, and Philanthropic. Other authors such as Uddin et al. (2008) and Kanji (2010) identified three dimensions: Economic, Social, and Environmental. In the origin of this trilogy we find the “Triple Bottom Line” by Elkington (1994). Still, regardless of the number of dimensions that have been proposed the principles are always the same and the number of dimensions varies only with the arranging and rearranging of the same CSR responsibilities. In our opinion, Elkington’s model (Elkington 1994) is the most parsimonious and comprises three dimensions as follows:
1. Economic dimension: The substratum that underlies this dimension is easily explainable and it is perhaps the most evident of the CSR dimensions. By definition the main purpose of any for-profit-company is profit (monsieur the La Palisse would definitely agree with). However, maximizing companies’ profits implicates promoting the companies’ among shareholders which ultimately is strongly achieved through CSR. The economic dimension concerns the effects of the business impacts as defined by the G4 Sustainability Reporting Guidelines (GRI, 2013, 48): “The economic dimension of
sustainability concerns the organization’s impacts on the economic conditions of its stakeholders, and on economic systems at local, national, and global levels.”
2. Social dimension: This dimension includes several sub dimensions such as legal, ethical and philanthropic (Carroll, 1977). As for the legal dimensions it means that no corporation can be considered to be socially responsible without full legal compliance. (Blanpain, 2011). As for the philanthropic dimension it is meant to give the company a positive public image among the members of the community. In fact, it relates to how
11
the company carries out philanthropy in a way that is beneficial to society. (Aagaard 2016).
3. Environmental dimension: Inside this dimension we mainly find sustainability which although it could be said to be a derivative of the environmental movement ended up being extended into multi-stakeholders’ initiatives (Hopkins 2016). Furthermore, sustainable development is defined by the Brundtland Comission as the ability to present generations have to meet their needs without compromising the ability of the future generations to meet their own needs. (WOED 1987)
Further developments by the same author around this concept would end up clarifying the existence of a bridge between Friedman’s conception of the role of a company and CSR. In fact, Elkington’s concept was further developed around the idea that the company’s responsibility should be to its’ shareholders hence deepening the Stake Holder’s theory first coined by Edward Freeman (Freeman 1984/2010). Among the shareholders we find everyone that is potentially affected by the company’s behaviour in the market. As such Elkington’s purpose of a company would evolve to the idea that the companies’ fundamental purpose should be to coordinate stakeholder interests, instead of simply maximizing shareholders’ profits. In practical terms we believe that Friedman’s idea of maximizing shareholders’ profits ends up being necessarily and intimately correlated to the coordination of stakeholders’ interests.
Taking into consideration the specific empirical object of this research (coffee trade) it is necessary to highlight a related concept of CSR: that of fair-trade. In fact, fair trade parallels many corporate social responsibility (CSR) initiatives in appealing to the altruistic sensibilities of consumers as a primary strategy for conveying economic benefits to poor workers. (Anderson 2014).
As the aim of our study is to assess the impact of CSR initiatives in coffee sales, we could not avoid talking about fair trade as the main outcome of CSR in this business.
2.1.3 Fair Trade
According to Dragusanu et al. (2013) coffee is the most important single product in the Fair Trade market, started in the mid-1950s and can be traced back to 1988 with the debut, in
12
Netherlands, of the first Fair Trade consumer label, the Max Havelaar” (Lyon, 2006) and because fair trade begun with this industry, coffee is quantitatively the most commonly certified product. According to this same author, certifications like Fair Trade can increase market efficiency. In his own words: By providing information, they create new products and help create markets that facilitate mutually beneficial transaction that otherwise would not occur.” Some authors address this tendency as a conscious social decision making, e.g. Barham (2002) or as the creation of new arenas for responsibility-taking (Micheletti, 2003).
Furthermore, Fair Trade helps to promote social and environmental responsibilities (Aranda & Morales, 2002; Dragusanu et al., 2013; Pérez-grovas & Cervantes, 2002). Also Fair Trade contributes to the improvement of farmers’ living conditions (Dragusanu et al., 2013) as certification programs also increase consumer welfare (Podhorsky, 2008).
Dragusanu et al. (2013) starts his study with the key question of if there is a factual concern from consumers with the conditions under which the goods are produced in what concerns social and environmental factor. According to this author, some studies seem to point in this direction. (Hertel et al., 2009) findings show that according to the survey they have conducted 75% of coffee buyers would be willing to pay 50 cents extra for a pound of coffee if it was Fair Trade certified and over half would be willing to pay one dollar more. This author makes an important remark as to whether these facts show a conceptual ideology that would be applied in practical terms or not.
Other studies e.g. Hainmueller et al. (2014) and Arnot et al. (2006) have shown that the placing of Fair Trade labels on coffee stands increases the sales of such coffee by 10%. In this study it was also demonstrated that the demand for more expensive (and arguably higher quality) Fair Trade coffee was insensitive to price. Some authors point this phenomenon as a defetishization of commodities such as coffee as the hidden layers of information are peeled away to reveal the social and environmental conditions of the commodity’s production (Goodman, 2004).
Furthermore, Mendez at al. (2010) have shown through a survey conducted in the years of 2003 and 2004 in El Salvador, Guatemala, Mexico and Nicaragua, that there is a significant positive relationship between average sales price for coffee and both Fair Trade and Organic certification.
13
Similarly, Weber (2011) and Bacon (2005) have shown that farmers who possessed theses certifications could successfully sell their coffee for higher prices. Presenting a radically different perspective Dragusanu (2013) shows that Fair Trade certification does increase incomes, but this is only limited to skilled coffee growers and farmers. All the other formers appear to have no benefit with such certification.
Arnould, Plastina, and Ball (2009), Jaffee (2009), have also shown that besides to sell their coffee for higher prices, farmers with any or both of these certifications did also experience greater sales and consequently higher incomes. Conversely Ruben et al. (2009) and Ruben and Fort (2012) conducted similar studies and concerning producers with Fair Trade certifications and producers without Fair Trade Certification, found no significant evidence of correlation between such certification and higher sales prices. Again, conversely, Dragusanu (2013) study comes to conclude that no evidence is perceived that links Fair Trade certification with more sales in the US whether internally or for exporting.
As to fully understand the benefits of Fair Trade, Dragusanu et al. (2013) conducted interviews with members of Fair Trade certified cooperatives and conventional Mills in Costa Rica. Among the many findings made by these authors they found that the perceived benefits of Fair Trade varied significantly depending on these forecast the path of future prices. As such a forecast of price drop in the future spurs the need to add value to their product, namely through Fair Trade certification. These authors did also conclude that the values of the producers have a direct impact on the adoption of this certification.
Although on the one hand education, knowledge and ignorance appear to play a critical determinant in the flow of commodities as pointed by (Appadurai, 1986) and constituting a barrier to making moral choices on consumption (Wilk, 2001), curiously, on the other hand, some studies seem to point to a negative relationship between education of farmers and the adoption of Fair Trade certification, e.g. Saenz-Segura and Zuniga-Arias (2009) and Ruben et al. (2009) and Ruben and Fort’s (2012). A study conducted by (Lyon, 2006) shows that only 3 out of 53 inquired co-operative coffee producers were familiar with the term fair trade. Emphasized by (Renard, 2003) is the fact that the lack of awareness appears to be symptomatic of the international fair trade structure in which producers have limited decision-making power and administrative control.
14
On a relevant note, Janvry et al. (2015) have presented evidences that show that as the Market price falls below a determined price floor, the proportion of coffee that the producers sold as Fair Trade also falls, meaning that when the benefits to Fair Trade increase it becomes harder to sell Coffee as Fair Trade. This may be related to the fact that more fair trade coffee is produced than is currently sold which challenged the markets ability to meet the needs of the many smallholders as shown by Daviron and Ponte (2005) and Fridell (2006). However, it may also have a direct relation to the willingness to pay from consumers. Consumers are willing to pay extra for fair trade products until a determined limit, limit over which price takes a preponderant position over fair trade hence placing fair trade in a secondary position (Eliot & Freeman, 2003).
2.2. CSR as a competitive advantage
As previously alluded to Friedman’s idea of staying within the rules of the game and to Drucker’s idea of companies’ being part of the community, we deemed these ideas are intricately related to that of preserving stakeholders’ interests. A stakeholder as defined by Laczniak and Murphy (1993) is any group or individual who can affect or is affected by the achievement of the organization’s objectives. In a broad conception, a stakeholder is an individual or a group of individuals that are typically affected by the achievement of the organization’s objectives (Laczniak & Murphy, 1993).
These authors also divide stakeholders in two groups: Primary and Secondary stakeholders. On the one hand primary stakeholders are all those who have a direct interest in the organisation and shall include investors, clients and employees. Secondary stakeholders, on the other hand, include suppliers, distributers and all those who have any sort of business relationship with the organisation, local communities where the organisation is established, the media and, in general, all the individuals that make part of it.
Considering the aforesaid, the stakeholders’ interests have come to grow in importance in social terms, we find labours rights, human rights, and environmental protection. These are areas of strategic importance which intervention used to belong exclusively to governments and governmental organisations and that are, in recent times, being gradually transferred to other economic agents, namely organisations (Lindfelts, 2002). These areas are intrinsically
15
correlated to Elkington’s Triple Bottom Line to which we have previously alluded in this literature review. As noted by Johnson & Smith (1999) these international organisations do include international trade networks which policies and actions can threaten or spur the natural environment, political stability and prosperity of the sites where they are located in.
2.2.1 Primary stakeholders
According to Waddock et al. (2002), socially responsible investment represents a significant source to influence investors and potential investors in firms to manage all of the corporation’s responsibilities. Boubaker et al. (2012) have also shown that CSR is highlighted by the development of socially responsible investment and a growing concern from investors with aspects other than simply the financial performance of organizations. Furthermore, evidence suggests that investors prefer to purchase shares from social responsible corporations as well as consumers prefer to purchase products from those companies (Déniz & Suarez, 2005). The positive impact of CSR in consumer buying behaviour has also been widely demonstrated (e.g. Brown & Dacin, 1997) as well as it has been shown to strengthen positive corporate and brand images (Holt et al., 2004). An identification from the employees with an organisation relates to how their values correspond to the promoted practices (Strand et al., 1981). Other studies also suggest that a strong CSR reputation of a company influences corporate attractiveness for prospective employees (Albinger & Freeman, 2000; Backhaus et al., 2002).
2.2.2 Secondary stakeholders
Suppliers are one of the main type of stakeholders we find in this group and CSR compliance regarding these has a double perspective: On the one hand organisations are striving to ensure that their suppliers are CSR compliant and in order to ensure it many organisations are either growingly demanding their suppliers share details of their own CSR policies or demand improvement (Smith et al., 2010). On the other hand, organisations’ concerns must address the social needs of their suppliers. In this sense by ensuring their suppliers or their suppliers’ employees, organizations effectively collect benefits from trade and enjoy fair and adequate working conditions (Strong, 1997). The extension of CSR to supply chain results from an increasing demand for accountability (Mamic, 2005).
16
Furthermore, companies are growingly looking at governments as key stakeholders of their operational structures as a consequence of increasing public sector’s effort to promote CSR. Through this engagement companies can effectively increase the impact of their CSR strategy and improve the sustainability of their programs (Ascoli & Benzaken, 2009).
Likewise, local communities have been widely shown to enhance their quality of life due to CSR (Gutiérrez, 2003). Also Carroll et al. (2009) refer that the promotion of intervention from organisations in solving social issues will potentially decrease the governments’ intervention in such matters. The general concept behind this statement is that government intervene in reaction to a certain action by presenting a statutory solution to a growing social problem. If companies adjust their behaviour forehand, governmental intervention will be unnecessary.
2.2.3 Commercial benefits and market value
It is increasingly accepted that CSR provides numerous commercial benefits and this corresponds to a sentiment that merges particularly strongly amongst local level respondents working in the commercial sector (Arrowsmith & Kunzlik, 2009; Bhattacharya & Sen, 2004; Brejning 2012) have also shown that CSR policies may be driven by commercial motives and that, as such, the European Community is placing increasing weight on the commercial reasons for CSR policies to justify its intervention in the field. Furthermore, on a different approach some authors claim that often the potential commercial benefits of adopting a sustainable approach are ignored in favor of short-term profits (Hawkins, 2005).
The value of CSR in Marketing and, as such, the correlation between the development of CSR activities and the sales of products is not an evident one (Bhattacharya & Luo, 2006). Among the reasons for this lack of correlation we find the lack of uniformity in organisations in planning, developing and executing such CSR initiatives in the market (Brown, 1997; Sen & Bhattacharya, 2001).
A relevant fact is that the organisations with greater adaptability and flexibility skills (such as a continuous increase in the products quality and innovation) are prone to obtain higher returns from the CSR programs they develop. Conversely, organisations that do not file these characteristics are prone to obtain lower returns from the development of such programmes.
17
(Bhattacharya & Luo, 2006). As a consequence, we believe that such topic deserves a deeper study.
According to these authors (2006) three reasons explain why CSR appears to add value to organisations: First, both the institutional theory (Scott, 1987) as the stakeholders’ theory (Mainan et al., 2005) suggest that the actions practiced by a company constitute an appeal to the multidimensionality of consumers facing them as member of a family, instead of mere economical entities (Bhattacharya & Luo, 2006). Secondly, a renowned record of CSR actions promotes a favorable background that will leverage the perception and attitudes of consumers towards the organisation (Sen & Bhattacharya, 2001). The third and last reason pointed out by this author for the added value promoted by the development of CSR initiatives is related to the value perceived by the persons. According to such context, coeteris paribus, consumers are more prone to choose a product from a company that develops CSR actions than from one who does not (Bhattacharya & Luo, 2006).
On a personal note we believe that it the awareness by consumers that a certain organisation is developing CSR initiatives that increases, the proneness for consumption among consumers. On a similar line of thought and adding to it, Mohr et al. (2001) suggest the coinage of this debutant consuming behaviour as a “socially responsible consumer behaviour”. According to these authors this new type of consumer is more prone to look up information related to the product or service, such as the impact of its consumption in sustainability, as a means of maximizing the advantages and minimizing harmful side effects to society.
Adding up to this ideological framework Lacznikak & Murphy (1993) support the idea that CSR actions have a negative impact in the short term given their cost and lack of awareness but a positive impact in the long term referring to this aspect as a correlation between ethics and profit.
On the negative side the loss of value results from the absence of an ethically responsible conduct from organisations. In this sense Laczniack and Murphy (2006) illustrate this phenomenon with the lack of care for safety flaws in tyres produced by Firestone in the 1980s and the several indictments for sexual harassment in woman in Astra Zeneca pharmaceutical company in the United States of America in the 1990s.
18
As demonstrated by Page and Fearn (2005), although consumers do claim to make an interest in CSR issues and companies’ responsible behaviour, purchasing decisions appear to be influenced by other criteria such as perceptions of fairness towards customers and corporate leadership. Also Bhattacharya and Luo (2006) present a similar perspective.
What also becomes apparent in several studies is that consumers’ articulated preference for CSR-related products is only given in the ceteris paribus event that quality and price are equal (Cone, 2007; Fearn, 2005; Bhattacharya & Sen, 2004)
All in all, there is plenty indication that CSR is mostly beneficial for all stakeholders and the society at large. Fair trade, in coffee business, is particularly paramount in translating CSR policies into practice. However, this has been studied with the hopes that customer preference for socially responsible products and services actually condition corporations’ options about their own policies. This link is not as direct as one may be led to think within the coffee business because in the coffee shops it is the retailer that makes the decision, not directly the end consumer. Therefore, we believe it is worthwhile to ask:
Q#1: Is there alignment between attributing CSR buying motivations to customers and retailers’ preference to buy brands with positive CSR reputation?
The corresponding hypothesis (H1) establishes that retailers’ choices are dependent on their
perception of end consumers’ options regarding CSR coffee brands.
Likewise, the overall literature accepts some tradeoff between CSR and price but also shows indication that coffee as a commodity is less elastic for the segment of consumers more aware of CSR issues. Thus, we questioned:
Q#2: Are markers of CSR reputation predictors of overall brand equity?
Q#3: Extra-CSR markers (price, quality, etc) are predictors of Overall Brand Equity
19
CSR indicators (fair trade) are positively associated with overall brand equity (H2) and Extra-CSR (price, quality, taste, service) are positively associated with overall brand equity (H3)
If indeed both are predictors, one may ask then, which one prevails? And therefore, we questioned, and hypothesized that:
Q#4: CSR markers explain more variance of in the overall brand equity than extra-CSR markers? (H4)
20
3. METHOD
The method will focus firstly on presenting the data analysis strategy, followed by measures including the interview script and quantitative measures used in the survey, procedure and sample.
3.1 Data analysis strategy
Data analysis starts with testing the psychometric quality of measures especially due to the distinct context from previous studies they were used. For a measure to be taken as psychometrically sound, it is required to be both valid and reliable. Technically, validity is tested via a factorial analysis while reliability is tested via Cronbach’s alpha. Factorial analysis is considered good whenever some technical requisites are observed, namely KMO, MSAs and commonalities all above .500; significant Bartlett test for p<.01; explained variance after rotation above 60%. Each scale is reliable whenever Cronbach alfa reaches at least 0.70 to the exception of novel scales where it may be provisory accepted at the 0.60. After testing the psychometric quality, we shall test hypotheses with multiple linear regression, checking its assumptions and using a confidence interval of 95%, with the corresponding p value of 0.05.
3.2 Measures
Considering there was an exploratory qualitative initial phase we will show the interview script followed by variables included in the survey.
Interview script - We build the script based on literature review designing questions to direct interviewee
semi-21
structured interview (Rowley, 2012; Schmidt, 2004) that allows a line of flow while offering the possibility of new emerging aspects. Considering the heterogeneity as well as scarce characterization of the coffee retailer market in Portugal, we made this choice to have a better grasp of reality.
The interview script comprehends two sections. The first one, introductory, which starts with a presentation of the study and invitation to participate. Then is questions generally about the business and establishment (for how long is the coffee shop open, if coffee is an important part of business turnover and activity per se). The second section focuses on the specific object of analysis and contains 5 questions as follows:
Q1 – How many coffee suppliers are available in your market?
Q2 – Why do you opt for your present supplier?
Q3 – Does brand make any difference at all? If positive, in which aspects is that difference felt?
Q4 – Is your customer aware of your coffee brand? Do customers react to different coffee batches/products of the same brand?
Q5 – What would make you increase the coffee sales?
The interview ended thanking for the participation and offering an email to which the interviewee could send a request for short final results of the study.
Sociodemopgraphics: Because the sample is made of retailers in food sector, we opted to characterize
them on the basis of gender, age, geographical location, number of coffee units sold each day, and volume of coffee bought to stores (kg/month). Complementary we asked for the degree of liberty retailers have on choosing the coffee brand, a necessary condition to participate in the study.
Fair trade brand: This variable was measured with an adjusted scale from Pelsmacker and Janssens
(2007) scale that comprehends five items measured on a 5-point Likert scale (1=Totally agree; 5=Totally disagree). Respondents were invited to signal their position ensuing a sentence: “To which extend do you think that, by comparison with competitors’ brands the one you buy …”. The five items are: “Is concerned with social issues that affect people in developing countries”, “Considers itself part of a larger community”, “Is concerned with abusive work conditions and workers’ rights”, “Feels responsible for
22
helping answer the most basic needs of their employees”, and “Feels responsible for helping providing the most basic needs of the poor”.
The factorial analysis is valid (KMO=.802; MSAs>.755; Bartlett X2=252.736, 10gl, p<.001) with a
single factor explaining 68.4% and preserving the five original items. The scale is reliable (Cronbach alpha=0.881).
KMO and Bartlett's Test
Kaiser-Meyer-Olkin Measure of Sampling Adequacy. .802
Bartlett's Test of Sphericity
Approx. Chi-Square 252.736
df 10
Sig. .000
Communalities
Initial Extraction FairTrade1 - Is concerned with social issues that affect people in developing countries 1.000 .739
FairTrade2 - Considers itself part of a larger community 1.000 .785 FairTrade3 - Is concerned with abusive work conditions and workers’ rights 1.000 .780 FairTrade4 - Feels responsible for helping answer the most basic needs of their employees 1.000 .610 FairTrade5 - Feels responsible for helping providing the most basic needs of the poor 1.000 .506 Extraction Method: Principal Component Analysis.
Total Variance Explained
Component Initial Eigenvalues Extraction Sums of Squared Loadings
Total % of Variance Cumulative % Total % of Variance Cumulative %
1 3.420 68.392 68.392 3.420 68.392 68.392
2 .743 14.866 83.259
3 .412 8.248 91.507
4 .259 5.175 96.682
5 .166 3.318 100.000
23
Component Matrixa
Component 1 FairTrade1 - Is concerned with social issues that affect people in developing countries .886
FairTrade2 - Considers itself part of a larger community .883
FairTrade3 - Is concerned with abusive work conditions and workers’ rights .859 FairTrade5 - Feels responsible for helping providing the most basic needs of the poor .781 FairTrade4 - Feels responsible for helping answer the most basic needs of their employees .712 Extraction Method: Principal Component Analysis.
a. 1 components extracted.
Client’s motivation: This measure was built on the basis of compiling the main motivations attached to
coffee consumption in literature review. We included five main motivations answered in a 5 point scale of importance (1=Very important; 5=Unimportant): Commodity, Ambiance, Preference for the coffee brand, Reputation of the coffee brand; and Quality / Taste of the coffee. Commodity was taken as central due to findings of previous studies (Glanz et al., 1998; Scholderer & Grunert, 2005; Denney-Wilson et al., 2009). Also Yu & Fan (2009) study comprehends three central issues, namely “quality” (generally and regarding taste) and ambiance (decor, sympathy). Obermiller et al. (2009) study highlight the centrality of reputation and brand preference that, in the present case, we associated with social-motives reputation. The chosen items were “Commodity (close to home, work place, or the like), “Ambiance (decor, sympathy or the like)”, “Preference for the coffee brand served in the place (due to social causes)”, “Quality/Taste of the coffee”.
The factorial analysis identified some items that failed to meet the technical requisites and thus made the solution unfit. After their removal we found a valid solution with a single factor (KMO=.604, MSAs>.565, Bartlett X2=113.849, 3gl, p<.001) explaining 72.6% of total variance. The scale has good
reliability (Cronbach alpha=0.796).
KMO and Bartlett's Test
Kaiser-Meyer-Olkin Measure of Sampling Adequacy. .604
Bartlett's Test of Sphericity
Approx. Chi-Square 113.849
df 3
24
Communalities
Initial Extraction AttributedCustomerMotivation3-Preference for the
coffee brand 1.000 .865
AttributedCustomerMotivation 4-Reputation of the
coffee brand (as linked to social causes) 1.000 .772
AttributedCustomerMotivation 5-Coffe quality /
taste 1.000 .540
Extraction Method: Principal Component Analysis.
Total Variance Explained
Component Initial Eigenvalues Extraction Sums of Squared Loadings
Total % of Variance Cumulative % Total % of Variance Cumulative %
1 2.178 72.605 72.605 2.178 72.605 72.605
2 .631 21.021 93.625
3 .191 6.375 100.000
Extraction Method: Principal Component Analysis.
Component Matrixa
Component 1
AttributedCustomerMotivation3-Preference for the coffee brand .930
AttributedCustomerMotivation 4-Reputation of the coffee brand (as linked to social causes) .879
AttributedCustomerMotivation 5-Coffe quality / taste .735
Extraction Method: Principal Component Analysis. a. 1 components extracted.
25
Retailer buying motivation: We created this measure based on the exploratory interviews with
coffee retailers that brought light upon the commercial and managerial processes implied in buying and selling coffee, namely their decision criteria to choose a supplier or a brand. These motivations were crossed with other found in literature and hence transformed into response items (five-point importance scale where 1=Very important and 5 = Unimportant) intending to represent motivation with and without logical link to social responsibility issues.
The scale comprehends nine items as follows: “Taste”, “Price”, “Benefits in equipment installation and support by the brand”, “The customer prefers the brand”, “Sales and post-sales services efficiency”, “Quality / price relation”, “Quality of the coffee”, “Brand corporate social responsibility”, and “Trust in the supplier (does not fails compromises)”. Considering the objective of the study (to distinguish the weight perceived CSR has in coffee buying decision by retailers) it is not advisable to factor analyzing this scale per se because its elaboration followed a principle of parsimony and item diversification, hence disavowing the search for a common latent variable. Applying a theoretic criterion from the nature of the items, we grouped the following sets of variables: a) Supplier services (3 items), b) quality (coffee + taste, 2 items) and c) price (price+ quality/price relation, 2 items). The remaining items were, for practicality sake, measured by a single item each, namely: preference-customer (1 item) and CSR reputation (1 item). The contrasting nature of items advises for separate factorial analyses although, for clarity sake, they are presented in the same table (Table 3.2.1).
Table 3.2.1 – Factorial analyses of retailer buying motivations
Supplier services Price Quality
Validity KMO .653 .500 .500 Validity MSAs [.603, .855] =.500 =.500 Validity X2 Bartlett 125.681, 3df, p<.001 1.867, 1df, p=.172 37.415, 1df, p<.001 Explained variance 75.4% 57.3% 79.9% Factor loadings MCM5 .924 MCM2 .757 MCM6 .757 MCM1 .894 MCM7 .894
26
MCM3 .904 MCM9 .768
Reliability Cronbach alpha = .836 rsb = .256 rsb = .749
Findings corroborate the existence of a single factor concerning supplier services but reassert doubts regarding the remaining couple factors (price and quality). KMO for price and quality reach liminal acceptable threshold, Bartlett sphericity test indicates a statistic value that precludes further factorial analyses for the “price”. Accordingly, we opted to treat items individually concerning price (price and price/quality relation). The results are: Supplier services (3 items), “Taste”, “Price”, “Customer’s preference for the brand”, “Quality/price relation”, “Quality of the coffee”, “Brand corporate social responsibility”.
Overall brand equity: This was measured with the single factor Yoo and Donthu (2001) scale
comprising 4 items. These were answered in a 7-point Likert scale (1=Strongly disagree; 7=Strongly agree) as follows: “It makes sense to buy the coffee brand I buy instead of any other brand, even if their benefits are the same”, “Even if another coffee brand has the same features as the one I buy, I would prefer to keep buying it”, “If there is another coffee brand as good as the one I buy, I prefer to keep buy this one”, and “If another coffee brand is not different from the one I buy in any way, it seems smarter to keep purchasing the one I buy”.
The factorial analysis is valid (KMO=.768; MSAs>.707; Bartlett X2=292.558, 6, p<.001) showing a
single factor explaining 81.2% variance, which kept the four original items. The scale is reliable (Cronbach alpha=0.918) but the value is high thus indicating probable item redundancy.
KMO and Bartlett's Test
Kaiser-Meyer-Olkin Measure of Sampling Adequacy. .768
Bartlett's Test of Sphericity
Approx. Chi-Square 292.558
df 6
27
Communalities
Initial Extraction OverallBrandEquity1- It makes sense to buy the coffee brand I buy instead of any other brand, even if
their benefits are the same 1.000 .828
OverallBrandEquity2- Even if another coffee brand has the same features as the one I buy, I would
prefer to keep buying it 1.000 .879
OverallBrandEquity3- If there is another coffee brand as good as the one I buy, I prefer to keep buy
this one 1.000 .862
OverallBrandEquity4- If a new coffee brand with a better quality/price relation showed up in the
market it seems smarter to keep purchasing the one I buy 1.000 .677
Extraction Method: Principal Component Analysis.
Total Variance Explained
Component Initial Eigenvalues Extraction Sums of Squared Loadings
Total % of Variance Cumulative % Total % of Variance Cumulative %
1 3.246 81.150 81.150 3.246 81.150 81.150
2 .429 10.732 91.882
3 .229 5.730 97.612
4 .096 2.388 100.000
Extraction Method: Principal Component Analysis.
Component Matrixa
Component 1 OverallBrandEquity2- Even if another coffee brand has the same features as the one I buy, I would prefer to
keep buying it .937
OverallBrandEquity3- If there is another coffee brand as good as the one I buy, I prefer to keep buy this one .929 OverallBrandEquity1- It makes sense to buy the coffee brand I buy instead of any other brand, even if their
benefits are the same .910
OverallBrandEquity4- If a new coffee brand with a better quality/price relation showed up in the market it
seems smarter to keep purchasing the one I buy .823
Extraction Method: Principal Component Analysis. a. 1 components extracted.
28
Overall, as regards psychometrics, the scales have sufficient factorial validity and reliability so to be used in further analyses. The ad hoc generated scales, namely “Customer motivation attribution” and “Retailer buying motivation”, present several cases where expected factorial solutions failed. This implies that meaning given to items by participants shifted from what we expected upfront. Consequently, instead of discarding items that failed to factorialize, we understood they were singled out (due to inter-item insufficient redundancy), but still they convey informational value to judge on motivations, as found in literature.
The final variables retained for the ensuing empirical analyses are the following (Table 3.2.2):
Table 3.2.2 – Variables under study
Sociodemographic Gender, age, geographical location, number of coffee units per day, monthly coffee consumption (kg)
Fair trade 5 items (Pelsmacker & Janssen, 2007) 1-TD, 5-TA
Attributed customer motivation
Brand (3 items, preference+ reputation+ quality)
Comodity (q7_1) Ambiance (q7_2) No determined motive (17_6) 1-TA, 5-TD Retailer buying motivation
Supplier services (3 items, post-sales services, trustworthiness, equipment)
Price (q8_2)
Quality/price relation (q8_6)
Product quality (q8_7)
Taste (q8_1)
Preference for the brand (q8_4)
Brand social responsibility (q8_8)
1-VI, 5-UI
Overall brand equity 4 items (Yoo & Donthu, 2001) 1-TA, 7-TD
29
3.3 Procedure andsample
The sample comprises 88 valid questionnaires (one excluded due to missing values). Criteria to be included in the study were the following: to have an open coffee shop or restaurant with public coffee unit selling, and to acknowledge that the brand choice is within their decision scope. Due to practicality reasons, the geographical location is mostly in the Metropolitan Lisbon although some occasions made other retailers, operating outside Lisbon, to participate in the study. The sample is thus nonrandom and has no intention of representativeness of the national situation. However, we see no reason to anticipate strikingly divergent buying decision processes between Metropolitan Lisbon retailers and some other location, e.g. Setubal, because it is a market that operates under the same regulatory framework with culturally similar individuals.
Please indicate the council of your establishment
Frequency Percent Valid Percent Cumulative Percent Valid Alfragide 1 1.1 1.1 1.1 Amadora 7 8.0 8.0 9.1 Benavente 1 1.1 1.1 10.2 Cascais 1 1.1 1.1 11.4 Estoril 1 1.1 1.1 12.5 Lisboa 56 63.6 63.6 76.1 Oeiras 12 13.6 13.6 89.8 Salvaterra de Magos 1 1.1 1.1 90.9 Santarem 1 1.1 1.1 92.0 Setubal 5 5.7 5.7 97.7 Sintra 2 2.3 2.3 100.0 Total 88 100.0 100.0
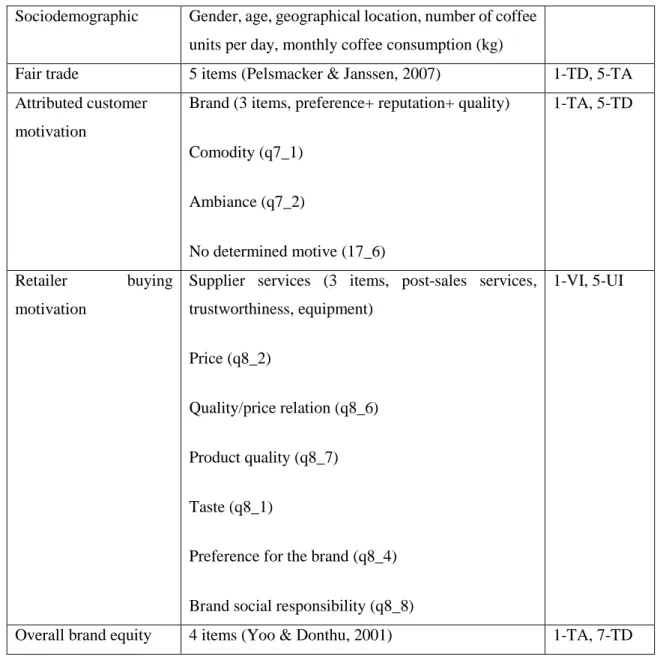
The sample predominantly comprehends male individuals (70.5%) with age range between 39 and 46 years old as shown in table 3.2.3.
30
Table 3.2.3 - Age bands
Frequency Percent Valid Percent Cumulative Percent Valid 18 - 25 3 3.4 3.4 3.4 25 - 32 26 29.5 29.5 33.0 32 - 39 21 23.9 23.9 56.8 39 - 46 30 34.1 34.1 90.9 Over 46 8 9.1 9.1 100.0 Total 88 100.0 100.0
31
4. RESULTS
This section evolves in a twofold manner. Firstly, we shall report on the exploratory interviews conducted mainly to gain insight on the market and coffee trade and to inform on the survey building, so to design better fitted questions to the market. The second part of results concern questionnaire findings and hypotheses testing.
Interviewees highlighted a set of issues that overlap with core variables seen in literature review. Namely, that retailer-supplier relations reflect multiple choice criteria, e.g. the trustworthiness of supplier in keeping the service level as well as some equipment or merchandising. Price and quality are always mentioned but to a lesser extent. Also the reactions of customers to the taste of coffee, in order to check if any new blend might be detrimental to business or the need to tune up the coffee machine. In some other cases the retailers actually mentioned a preference for a determined brand without much qualification on the reasons for that preference other than being used to that brand and supplier, and having a particular like on how the brand deals with. As family business, some retailers mentioned the fact that some brands were alike minded and so, would give it preference.
Concerning customers’ buying criteria, retailers report commodity as inertia plays a role in coffee consumption. According with interviewees, customers tend to create habits and opt for the nearest coffee shop either because they are used to having a coffee or because they used it as a social ritual to chat or have a brief conversation. In some occasions, it is but an excuse to rest a while and be seated with people without much expense. The ambiance of the shop will attract more people to spend their leisure time while drinking coffee is a part of that ambiance.
As regards brand issues, retailers mostly state the consumer is aware of the coffee brand, mainly due to advertising in the consumption place as well as merchandising they use to serve the coffee but that this issue is rarely mentioned by customers. Retailers stated some are well known brands and they think consumers expect to see those, also that some brands clearly bet on differentiating reputation by means of CSR while most of the brands do not do that option.
Retailer think brands make a difference but most importantly that within the same brand, the batch of blend of coffee makes the most difference as well as the working conditions of the coffee machines. So, they search to attain the blend that better suits customers flavor, as a poor blend or a poorly maintained coffee machine will render the coffee a distasteful bitter flavor that may lead customers to opt out for someone in the competition. Retailers always mention that the customer has many nearby options to drink a coffee other than their establishment.
32
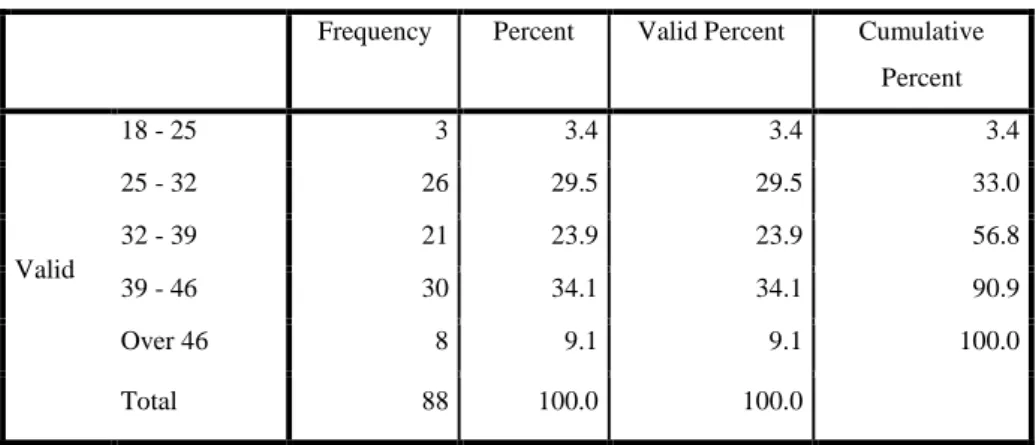
Quantitative findings will start by showing descriptive and bivariate statistics (Table 3.2.4) among indicators under study.
Table 3.2.4 – Descriptives and bivariate analysis
Scale Median (sd) 1 2 3 4 5 6
1. Overall Brand Equity
1-7TA 4.66 (1.65) 1
2. Fair trade
1-5TA 3.36 (0.70) .250* 1
3. Buying_Motiv_ Social responsibility
1-5VI 2.34 (1.29) .221* .583** 1
4. Buying_Motivation _ Price
1-5VI 4.64 (0.66) -.077 -.266* -.249* 1
5. Buying_Motivation _ Quality / price
1-5VI 4.29 (0.85) -.100 .093 .170 .147 1 6. Buying_Motivation _Service 1-5VI 3.31 (1.12) .080 .514** .664** -.209 .344** 1 7. Buying_Motivation _Quality 1-5VI 3.64 (0.90) .184 .577** .758** -.152 .328** .765** ** p<.01, * p<.05
Descriptives show divergent evaluations made by participants concerning variables under study. Amongst buying motivations the most salient is “price” (m=4.64, dp=.66) and quality/price relation (M=4.29, dp=.85) that are both positioned quite above the midpoint of the scale. Product quality however was assessed as having modest importance in buying decision.
Overall brand equity, thought of as the preferential attachment to the brand comparing with the alternatives (Yoo & Donthu, 2001) has equally modest values (M=4.66, dp=1.65) placing itself approximately at 2/3 of the full scale.
33
Acknowledging fair trade practices (as defined by Pelsmacker & Janssen, 2007) is modestly judged as important, at the midpoint of the scale.
The bivariate patterns have also informative value. Among buying motivations the quality and service strong association is noticeable (r=.765, p<.01), as well as between quality and social responsibility (r=.758, p<.01). The positive association between fair trade, social responsible brand, and overall brand equity is also informative (r=.250 and r=.221, p<.05 respectively).
Q#1: Is there alignment between attributing CSR linked buying motivations and retailers’ preference to buy brands with positive CSR reputation?
The first question concerns eventual consistencies between the value retailers give to brands on the basis of their perception of customers’ preference for CSR-based brands. Their alignment implies value consistency or, at least, that business decision criteria intends to align retailer buying choices with end customers buying choices in order to maximize sales.
To empirically test this, we conducted a linear regression taking attributed buying motivation in customers as a predictor and retailer buying motivation linked with CSR as a criterion variable (also called dependent variable).
The model showed that attributed buying motivation in customer linked to CSR is the best predictor in retailer buying decision for a coffee brand with CSR connotation. Individually, this predictor explains 39.9% os variance with a positive significant association coefficient (Beta=.637, t= 7.664, p<.01).
Coefficientsa
Model Unstandardized Coefficients Standardized
Coefficients t Sig. B Std. Error Beta 1 (Constant) 1.318 .323 4.075 .000 Attibuted_motiv_customer 4-Coffe brand reputation (social causes)
.660 .086 .637 7.664 .000
34
Q#2: Are markers of CSR reputation predictors of overall brand equity?
We conducted a linear regression taking “Fair trade” and predictor and “Overall brand equity” as criterion variable. The model found has contradictory elements that may indicate the data analysis technique is not suitable for the data. On the one hand we found a significant ANOVA value as well as some explained variance but on the other hand the association coefficient is non-significant (p<.05). By studying the curve adjustment between Overall brand equity and Fair trade we indeed found indication that linear relation should be rejected (F (1, 82)= 5.871, p=.018). The best adjustment was found for exponential function (F (1,82)=2.903, p=.092), which means some transformation of the variables is required. Considering the nature of the function we have transformed the variables on the baseis of the natural logarithm of the gamma distribution probability density function, (Boros & Moll, 2004: 201-203) that corresponds to the following formula:
This procedure was previously conducted in published research works in Marketing (e.g. Allenby et al., 1999; Habel & Goodman, 2008; Fader & Hardie, 2002).
The regression model, controlling for effects of age and gender, shows that Fair Trade is a significant predictor, albeit modest in magnitude (merely 7.8% R2, 4.3% R2 adjusted) with a positive association
coefficient (Beta=.234, t= 2.148, p<.05).
Model Summary
Model R R Square Adjusted R
Square
Std. Error of the Estimate
1 .157a .025 .000 1.66443
2 .279b .078 .043 1.62849
a. Predictors: (Constant), Age band, Gender
35
Coefficientsa
Model Unstandardized Coefficients Standardized
Coefficients
t Sig. Collinearity Statistics
B Std. Error Beta Tolerance VIF
1 (Constant) 6.024 .958 6.287 .000 Gender -.518 .429 -.143 -1.208 .231 .857 1.167 Age band -.213 .183 -.138 -1.162 .249 .857 1.167 2 (Constant) 3.875 1.371 2.826 .006 Gender -.371 .425 -.102 -.872 .386 .834 1.199 Age band -.184 .180 -.119 -1.021 .310 .852 1.174 FairTrade .558 .260 .234 2.148 .035 .974 1.027
a. Dependent Variable: OverallBrandEquity
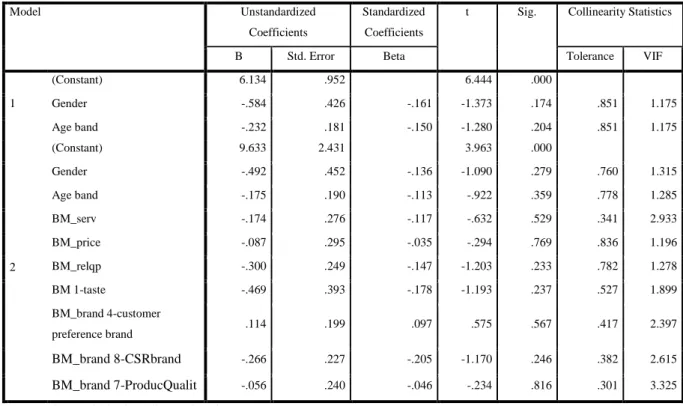
Q#3: Extra-CSR markers (price, quality, etc) are predictors of Overall Brand Equity
We have conducted the distribution adjustment test upfront to all possible predictors in the regression equation, namely BuyingMotiv_Price/Quality_relation, BuyingMotiv_Price, BuyingMotiv_CSRbrand,
BuyingMotiv_Taste, BuyingMotiv_customer_preference, BuyingMotiv_Service,
BuyingMotiv_ProductQuality. The tests showed non-significant statistics for linear distribution and therefore we opted to conduct a linear regression analysis, without any transformation of the original variables.
The hierarchical linear regression analysis was not able to explain any meaningful variance both for the socio-demographic (gender and age) as well as for the potential extra-CSR predictors (Tables 3.2.5 & 3.2.6). No multicollinearity was found (all VIFs are below 5).
36
Table 3.2.5 – Model summary for extra-CSR
Model Summary
Model R R Square Adjusted R
Square
Std. Error of the Estimate
1 .172a .030 .006 1.65367
2 .327b .107 .001 1.65808
a. Predictors: (Constant), Age band, Gender
b. Predictors: (Constant), Age band, Gender, MC_relqp, MC_price,
BM_brand 8-CSRbrand, BM_brand 1-taste, BMbrand 4-customer preference for brand, BM_brand_service, BM_brand 7-product quality
Table 3.2.6 – Coefficients for extra-CSR regression on Overall Brand Equity Coefficientsa
Model Unstandardized
Coefficients
Standardized Coefficients
t Sig. Collinearity Statistics
B Std. Error Beta Tolerance VIF
1 (Constant) 6.134 .952 6.444 .000 Gender -.584 .426 -.161 -1.373 .174 .851 1.175 Age band -.232 .181 -.150 -1.280 .204 .851 1.175 2 (Constant) 9.633 2.431 3.963 .000 Gender -.492 .452 -.136 -1.090 .279 .760 1.315 Age band -.175 .190 -.113 -.922 .359 .778 1.285 BM_serv -.174 .276 -.117 -.632 .529 .341 2.933 BM_price -.087 .295 -.035 -.294 .769 .836 1.196 BM_relqp -.300 .249 -.147 -1.203 .233 .782 1.278 BM 1-taste -.469 .393 -.178 -1.193 .237 .527 1.899 BM_brand 4-customer preference brand .114 .199 .097 .575 .567 .417 2.397 BM_brand 8-CSRbrand -.266 .227 -.205 -1.170 .246 .382 2.615 BM_brand 7-ProducQualit -.056 .240 -.046 -.234 .816 .301 3.325
a. Dependent Variable: Overall Bramd Equity
Findings show that no potential predictors of extra-RSO are actually able to predict in a statistically significant way, the overall brand equity.
37
Q#4: CSR markers explain more variance of in the overall brand equity than extra-CSR markers
This hypothesis requires no empirical additional test because none of the extra-CSR indicators was a significant predictor, hence there is sufficient evidence to allow for conclusions as regards the hypothesis.
38
5. DISCUSSION AND CONCLUSION
The strong association between quality, service and social responsibility – as brand buying decision factors – reflect the strategic positioning concerning a market segment that values elements that add distinctiveness to the brand other than price (Anderson, 2014).
Evidence also shows that there is a relationship between fair trade, attached to the brand and the building of a value added concept of that brand among consumers which converges with Waddock et al. (2002) or Bhattacharya & Luo (2006). It is important, however, to keep in mind that fairness towards customer and corporate leadership, however, seem to play a major role in adding value to the business as well which reduces the sole impact of CSR in adding value to the business (Page & Fearn 2005; Bhattacharya & Luo 2006).
The results of our study show that fair trade apparently plays a unique role in explaining coffee overall brand equity ruling out price or quality, is comes as a surprise. However, this finds explanation in Page & Fearn (2005) Bhattacharya & Sen (2004) assertion that consumers prefer to purchase products from social responsible companies if the prices and quality of such products are the same as the ones from other brands that do not follow CSR policies. We did not anticipate a direct brand comparison study that could provide the necessary information to judge on price-comparison as related with CSR-preferences. However, it is our belief that price range varies more between blends than between brands. With such a mature market as the Portuguese coffee market, it is possible to find similar blends with similar prices which turns price a less relevant criterion for buying decisions.
The choice for a certain coffee brand from the retailers is, to some extent, related to the choice of clients for that same brand. This may also in some cases be explained by the preference from the client for certain large franchise coffee shops in which in fact the relevance related to the brand of the coffee shop as a whole. All in all, this study gives fair trade a critical role in choosing which brand to buy.
As limitations our study is grounded on a rather small, unrepresentative sample of the national market, especially given the geographical location of collection of the data (essentially greater Lisbon). Other limitations relate the lessened consideration of merchandising policies in decision making and some limitations regarding a binding period to which retailers may be
39
subject to as a result of a purchasing agreement. This would have to be considered in future studies to better grasp reality.
Also, no distinction is made between generic coffee retailers whose establishments are not bound to any franchise and in which the choice from the client may result solely from the coffee brand individually considered, from those establishments that belong to franchise chains and in which the choice from clients may result from other factors that makes them prefer such brand and which may not be coffee related.
The preference shown by the client is indeed a relevant factor that influences the purchasing decision by the retailer. As such, consumption based in CSR reputation has repercussions in the supply chain that go all the way up to the wholesaler.
Fair trade as a natural result of CSR appears to be related, as expected, with the brand value which evidences the importance of the values in which this concept is grounded.