Received October 23, 2008 and accepted September 25, 2009. Corresponding author: detmann@ufv.br
www.sbz.org.br
Intake and digestibility in cattle under grazing supplemented with nitrogenous
compounds during dry season
1Janderson Florencio Figueiras2, Edenio Detmann3, Mário Fonseca Paulino3, Tiago Neves Pereira Valente2, Sebastião de Campos Valadares Filho3, Isis Lazzarini2
1Pesquisa financiada pela FAPEMIG (Programa Pesquisador Mineiro), pelo CNPq e pelo INCT-Ciência Animal. 2Programa de Pós-Graduação em Zootecnia, Universidade Federal de Viçosa, Viçosa-MG.
3Departamento de Zootecnia, Universidade Federal de Viçosa, Viçosa-MG. Pesquisador do CNPq e INCT-Ciência Animal.
ABSTRACT - The objective of this work was to evaluate the effects of supplementation with nitrogenous compounds
on intake and digestibility in cattle under grazing during dry season. It was used five Holstein × Zebu steers with average initial live weight of 236 kg, kept in five Brachiaria decumbens Stapf. paddocks (0.34 ha). The experiment was carried out according to a 5 × 5 Latin square design, with five supplementation levels and five experimental periods. The supplementation levels were the following: 0; 0.35; 0.70; 1.05, and 1.40 g of crude protein/kg live weight. A mixture of urea, ammonium sulfate and albumin (4.5:0.5:1.0, respectively) was used as nitrogen supplement. The average crude protein levels in the diet were 7.39; 8.92; 10.98; 12.55; and 13.62%, as dry matter basis, for the respective supplementation levels. Linear-response-plateau relationships were observed between intake estimates and diet crude protein levels. The linear-response-plateau pattern showed that intake was increased up to crude protein levels close to 9%, as dry matter basis. The estimates became unchangeable from this level. The total and ruminal digestibility coefficients of dry matter and neutral detergent fiber, and diet level of total digestible nutrients presented a positive linear pattern according to diet crude protein levels. The rumen ammonia nitrogen concentration was linearly increased by diet crude protein levels. This variable assumed the value of 8.00 mg/dL when the intake estimates reached the maximum values. Supplementation with nitrogen compounds in quantities that raise the crude protein content in the diet to levels close to 9% optimizes the use of low-quality forage by cattle under grazing.
Key Words: microbial nitrogen, rumen ammonia nitrogen, supplementation, urea
Consumo e digestibilidade em bovinos em pastejo durante o período seco
recebendo suplementação com compostos nitrogenados
RESUMO - Objetivou-se avaliar os efeitos da suplementação com compostos nitrogenados sobre o consumo e a digestibilidade em bovinos em pastejo durante o período seco do ano. Foram utilizados cinco novilhos mestiços Holandês × Zebu, com peso vivo (PV) médio inicial de 236 kg, mantidos individualmente em piquetes de Brachiaria decumbens Stapf. (0,34 ha). Utilizou-se delineamento em quadrado latino 5 × 5, com cinco níveis de suplementação (0; 0,35; 0,75; 1,05; e 1,40 g de proteína bruta (PB)/kg PV) e cinco períodos experimentais. Como fonte de compostos nitrogenados empregou-se mistura de ureia, sulfato de amônia e albumina (4,5:0,5:1,0, respectivamente). Os níveis médios de PB nas dietas foram de 7,39; 8,92; 10,98; 12,55 e 13,62%, com base na matéria seca (MS), para os respectivos níveis de suplementação. Verificou-se relação do tipo linear-responVerificou-se-plateau (LRP) entre as estimativas de consumo e os níveis de PB da dieta. O comportamento do tipo LRP permitiu evidenciar aumento no consumo até níveis próximos a 9% de PB, com base na MS, a partir do qual houve estabilidade das estimativas. Os coeficientes de digestibilidade total e ruminal da MS e da fibra em detergente neutro e o nível de nutrientes digestíveis totais na dieta apresentaram relação linear e positiva com os níveis de PB na dieta. A concentração de nitrogênio amoniacal ruminal (NAR) aumentou de forma linear e positiva de acordo com os níveis de PB na dieta, com valor estimado de 8,00 mg NAR/dL, equivalente à otimização do consumo voluntário. A suplementação com compostos nitrogenados em quantidades que permitam elevar o teor de PB da dieta a níveis próximos a 9% proporciona otimização na utilização de forragem de baixa qualidade por bovinos em pastejo.
Introduction
The beef cattle production in Brazil is based, in most of cases, on pasture as the main food resource for animals. Thereby, the production systems are dependent on climate to produce adequate quantities of potentially digestible dry matter, which is the main nutritional resource that can be converted into animal product (Paulino et al., 2006).
During dry season, the tropical forage available for grazing present high contents of insoluble fiber and lignin and low nitrogenous compounds contents (Detmann et al., 2009). Under these circumstances, the basic nutritional resources may not be considered as a completely adequate diet for animal production because they have multiple deficiencies, such as minerals, energy and protein (Paulino et al., 2001). That pattern incurs high demand for supplementary resources in which nitrogenous compounds are supposed to be priority (Paulino et al., 2006). The low crude protein (CP) contents in the forage limit the microbial activity in the rumen and reduce intake, digestibility, and animal performance (Van Soest, 1994).
The nitrogen supplementation for animals fed low-quality tropical pasture improves the microbial growth in the rumen, noticeably fibrolytic bacteria, and it favors fiber degradation and microbial protein synthesis. From this, it will be observed increase in voluntary intake of pasture and energy production from fiber. Thus, the nitrogenous compounds supplementation causes positive effects on low-quality pasture utilization (Lazzarini et al., 2009a; Sampaio et al., 2010).
However, there are few results in the literature that allow the exact description of the quantitative relationship between the mass of supplementary nitrogenous compounds and their effects on nutritional characteristics in cattle fed low-quality tropical pastures.
Thus, the objective of this work was to evaluate the effects of nitrogenous compound supplementation on intake, digestibility, and microbial protein synthesis in cattle under grazing during dry season.
Material and Methods
The experiment was carried out from June to October 2007 in the Setor de Bovinocultura de Corte at the Departamento de Zootecnia of Universidade Federal de Viçosa, Viçosa, Brazil.
It was used five crossbred steers (Holstein×Zebu), with an average body weight of 236 kg and fitted with ruminal and abomasal cannulaes. The animals were kept in individual paddocks (0.34 ha) formed by signal grass
(Brachiaria decumbens Stapf.). Water and mineral mixture
were available to steers all the time. The experiment was carried out according to a 5 x 5 Latin square design with five supplementation levels and five 15-day experimental periods. In each period, the first five days were used for adapting the animals to the supplementation levels. The animals were randomly located to the paddocks in each experimental period.
Near to experimental paddocks there was a corral where the animals were contained for weighting, marker and supplement supplying, and samples collecting.
The five supplementation levels were the following: 0; 0.35; 0.70; 1.05; and 1.40 g CP/kg live weight. A mixture of urea, ammonium sulfate and albumin was used as a source of nitrogenous compounds at the ratios of 4.5:0.5:1.0, respectively. The supplements were calculated based on the animal live weight at the beginning of each experimental period.
The supplement ingredients were chosen based on their lack of carbohydrate, so supplementation effects with nitrogenous compounds could be evaluated without any supplementary source of fiber or energy interfering on the measurements. Albumin was included in the supplement to meet the microbial requirements of true degradable protein, allowing the supply of essential substrates, such as branched chain volatile fatty acids.
The supplements, in two portions of equal weight, were placed in the rumen of the animals at 6 a.m. and 6 p.m. on every day of the experiment.
The evaluation of consumed forage was done through hand plucking samples (De Vries, 1995), which were obtained on the 1st, 4th and 10th days of each experimental period. The samples were oven-dried (60ºC) and processed in a Wiley mill (1- and 2-mm). Composite samples were produced for each paddock and experimental period.
Samples of feces and abomasal contents were oven-dried (60ºC) and processed in a Wiley mill (1- and 2-mm). After that, composite samples were produced for each animal and experimental period.
To evaluate the ruminal pH and rumen ammonia nitrogen (RAN) concentration, samples of ruminal fluid were taken on the 9th day of each experimental period at 6 a.m., 12 p.m., 6 p.m. and 12 a.m. The samples were manually collected from the liquid:solid interface of the rumen mat, filtered through a triple layer of cheesecloth and submitted to pH assessment. A 40-mL aliquot was then separated, fixed with 1 mL H2SO4 (1:1) and frozen (-20ºC) for later analysis.
Samples of rumen contents were also taken on the 9th day at 12 p.m. and 6 p.m. to isolate ruminal microorganisms according to Cecava et al. (1990).
On the last day of each experimental period, urine spot samples were obtained, approximately two hours before and four hours after morning supplementation. The samples were filtered through cheesecloth and a 10-mL aliquot was separated, diluted with 40 mL H2SO4 (0.036N) (Valadares et al., 1999) and frozen at -20ºC.
Blood samples were collected from the jugular vein simultaneously with urine sampling, using test tubes with separator gel and coagulation accelerator (BD Vacuntainer® SST II Advance). The samples were centrifuged at 2,700×g,
for 20 minutes to obtain the serum that was frozen (-20°C). The handing plucking, abomasal contents and feces samples processed at 1-mm were analyzed for DM, organic matter (OM), CP, ether extract, acid detergent fiber, and lignin (H2SO4 72% w/w) according to methods described by Silva & Queiroz (2002) (Table 1). Contents of neutral detergent fiber (NDF) were evaluated according to Mertens (2002), without sodium sulfite and using a heat-stable α-amilase. The NDF were corrected for ash
(Mertens, 2002) and nitrogenous compounds (Licitra et al., 1996) (NDFap). Supplement was analyzed for DM, OM and CP, as described above (Table 1).
Feces samples were evaluated for titanium dioxide as described by Titgemeyer et al. (2001). The fecal excretion was estimated as ratio of daily dose upon fecal concentration. The estimates of pasture intake and abomasal flow were obtained by using indigestible NDF (iNDF) as internal marker. Contents of iNDF were estimate in samples processed at 2-mm by a 240-hours in situ incubation
procedure as suggested by Casali et al. (2008).
The RAN content in rumen fluid samples was determined by the micro-Kjeldahl system, without acid digestion and after distillation with potassium hydroxide (2N), after previous centrifugation of the sample to 1,000×g,
for 15 min. The concentrations obtained at the different sampling times were combined by animal and period in order to obtain a single value that represented the average daily RAN concentration. Rumen pH values were combined in a similar way.
Samples of ruminal microorganisms were evaluated for DM, CP (Silva & Queiroz, 2002) and purine bases (Ushida et al., 1985). However, some problems were detected on estimates of purine base contents. Therefore, it was used the microbial NRNA:NTOTAL ratio of 0.139 g/g, which is the average estimate obtained from values presented by Lazzarini et al. (2009a), Sampaio et al. (2010) and Souza et al. (2010).
The urine samples, after thawing, were composed per animal and experimental period and analyzed regarding nitrogen (Kjeldhal method; Silva & Queiroz, 2002), creatinine (modified Jaffé method; Bioclin® K016-1), uric
acid (LCF enzymatic-colorimetric method; Human® 10689)
and alantoin (colorimetric method; Chen & Gomes, 1992). The urea content in serum was obtained using the LCF enzymatic-colorimetric method (Human® 10505).
The total urinary volume was estimated by the ratio of creatinine concentration in the urine on its excretion per unit of live weight (Chizzotti, 2004):
CE = 32.27 – 0.01093 x LW (1),
where CE is the daily creatinine excretion (mg/kg of LW); and LW the live weight (kg).
Purine derivatives excretion was calculated by the sum of the quantities of allantoin and uric acid excreted in the urine.
The absorbed purines were calculated from purine derivatives excretion by the equation (Verbic et al., 1990):
(2),
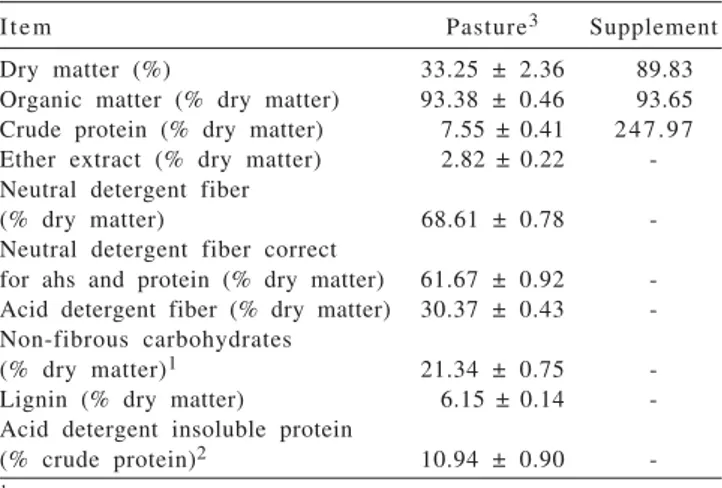
Item Pasture3 Supplement
Dry matter (%) 33.25 ± 2.36 89.83 Organic matter (% dry matter) 93.38 ± 0.46 93.65 Crude protein (% dry matter) 7.55 ± 0.41 247.97 Ether extract (% dry matter) 2.82 ± 0.22 -Neutral detergent fiber
(% dry matter) 68.61 ± 0.78
-Neutral detergent fiber correct
for ahs and protein (% dry matter) 61.67 ± 0.92 -Acid detergent fiber (% dry matter) 30.37 ± 0.43 -Non-fibrous carbohydrates
(% dry matter)1 21.34 ± 0.75
-Lignin (% dry matter) 6.15 ± 0.14 -Acid detergent insoluble protein
(% crude protein)2 10.94 ± 0.90
-Table 1 - Chemical composition of pasture and supplement
1 NFC = OM-(CP+EE+NDFap).
where AP = the absorbed purines (mmol/d); PD = the purine derivatives excretion (mmol/d); 0.85 = the recovery of absorbed purines as purine derivatives in the urine (mmol/ mmol); and 0.385 = the endogenous purine derivatives excretion in the urine per unit of metabolic size (mmol).
Microbial synthesis of nitrogenous compounds in the rumen was estimated as function of the absorbed purines and the NRNA:NTOTAL ratio in the microorganisms (Chen & Gomes, 1992):
(3),
where NMIC = the microbial nitrogenous compounds flow in the small intestine (g/d); R = the NRNA:NTOTAL ratio in the microorganisms (mg/mg); 70 = the nitrogen contents in purines (mg/mol); and 0.83 = the intestinal digestibility of the microbial purines (mg/mg).
The average crude protein levels in the diets were used for representing the treatments (supplementation levels).
These estimates were obtained by the ratio of CP intake (pasture plus supplement) upon total DM intake.
After analysis of variance, an orthogonal partition of the sum of squares of treatments into linear, quadratic, third (cubic) and fourth degree effects was obtained. A linear regression model was then fitted. All the statistical procedures were carried out using SAS (Littell et al., 1991) (α = 0.10).
Results and Discussion
The average crude protein levels in the diets, which were calculated from the ratio of total CP intake (forage and supplement) to total DM intake, were 7.39; 8.92; 10.98; 12.55; and 13.62%, on DM basis, for the supplementation levels of 0; 0.35; 0.70; 1.05; and 1.40 g CP/kg live weight, respectively.
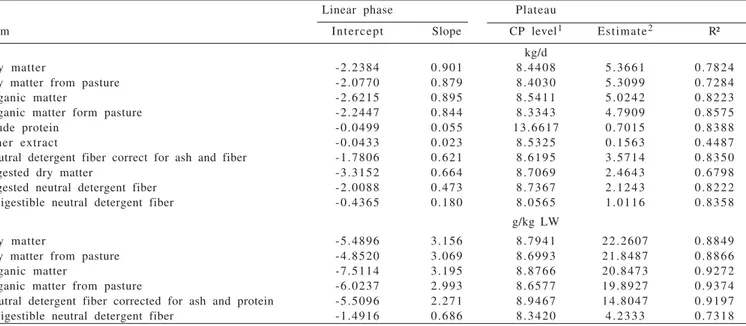
A cubic effect (P<0.10) of the CP levels in the diet on the intake was detected for all variables, except for non-fibrous carbohydrates intake, which presented a fourth degree pattern (P<0.05) (Table 2).
Crude protein level in the diet (%) Effect1, 2
Item 7.39 8.92 10.98 12.55 13.62 CV (%) L Q C F
kg/d
Dry matter3 4.419 5.797 5.074 5.230 5.793 15.5 ns ns * * ns
Dry matter from pasture4 4.419 5.764 5.006 5.129 5.659 15.7 ns ns * * ns
Dry matter from supplement - 0.033 0.068 0.101 0.134 - - - -
-Organic matter5 3.998 5.363 4.725 4.949 5.397 15.4 * * ns * * ns
Organic matter from pasture6 3.998 5.285 4.568 4.716 5.088 15.9 ns ns * * ns
Crude protein7 0.319 0.515 0.529 0.632 0.778 17.7 * * * ns * * ns
Ether extract8 0.129 0.165 0.144 0.144 0.180 22.3 ns ns * ns
Neutral detergent fiber
correct for ash and protein9 2.808 3.758 3.405 3.470 3.838 16.2 ns ns * * ns Non-fibrous carbohydrates10 0.736 0.924 0.647 0.703 0.599 16.4 * * ns * * *
Digested dry matter11 1.590 2.605 2.061 2.472 2.859 27.6 * * ns * ns
Digested neutral detergent fiber12 1.487 2.212 1.941 2.102 2.329 25.1 * ns * ns Indigestible neutral detergent fiber13 0.891 1.166 1.037 0.941 1.056 16.2 ns ns * * ns Total digestible nutritens14 1.952 2.965 2.484 2.904 3.264 23.9 * * ns * ns
g/kg LW
Dry matter15 17.30 22.65 22.06 21.34 23.38 12.2 * * ns * * ns
Dry matter from pasture16 17.83 22.53 21.74 20.94 22.85 12.1 * * ns * * ns
Organic matter17 16.10 20.97 20.57 20.17 21.80 12.7 * * ns * ns
Organic matter from pasture18 16.10 20.68 19.86 19.25 20.57 12.4 * ns * ns Neutral detergent fiber
correct for ash and protein19 11.27 14.74 14.80 14.14 15.46 13.1 * * ns * ns Indigestible neutral detergent fiber20 3.58 4.63 4.50 3.87 4.33 17.7 ns ns * ns
Table 2 - Voluntary intake in cattle under grazing supplemented with nitrogenous compounds
1 (ns), (*), (**) and (***): non-significant (P>0.10) and significant at 10%, 5% and 1% of probability by F test, respectively. 2 L, Q, C, and F: linear, quadratic, cubic and fourth degree, respectively.
3Yˆ = –65.6880 + 20.7699X – 1.988525X² + 0.06212X³ (R² = 0.9472). 4Yˆ = –65.0443 + 20.5935X – 1.96931X2 + 0.06158X³ (R² = 0.9411). 5Yˆ = –60.3753 + 18.9718X –
1.80311X² + 0.05617X³ (R² = 0.9341). 6Yˆ = –58.8973 + 18.5686X – 1.76669 X2 + 0.05497X³ (R² = 0.9140). 7Yˆ = –7.5950 + 2.3264X – 0.22225 X2 + 0.0079 X³ = ( R2 = 0.9952). 8Yˆ = –2.3112 + 0.7360X -0.07187 X² + 0.0230 X³ (R² = 0.9997). 9Yˆ = –42.4310 + 13.3010X – 1.26095X² + 0.03920X³ (R² = 0.9732). 10Yˆ = –85.2020 + 33.5510X – 4.81753X²
+ 0.30230X³ – 0.00701X4 (R² > 0.9999). 11Yˆ = –45.7083 + 14.0474X – 1.34846 X² + 0.042553 X³ (R2 = 0.8982). 12Yˆ = -30.2979 + 09.3275X – 0.88280X² + 0.02746X³
(R2 = 0.9427). 13Yˆ = –14.5068 + 4.5359X – 0.42992X² + 0.01327X³ (R² > 0.9999). 14Yˆ = – 43.1484 + 13.3477X – 1.27663X² + 0.04018X³ (R² = 0.9060). 15Yˆ = –204.2578
+ 64.5392X – 6.03728X² + 0.18545X³ (R² = 0.9997). 16 Yˆ = –201.9886 + 63.9511X – 5.98735X² + 0.18384X³ (R² = 0.9998). 17 Yˆ = –189.8656 + 59.4446X – 5.51660X² +
However, inspecting intake means suggested a linear-response-plateau (LRP) pattern. From adjustment of such
functions, it was bring into evidence an increase in intake (P<0.05) up to limits close to 8-9% CP, as DM basis. From these crude protein levels the intake was unchanged (Table 3; Figure 1). On the other hand, the CP intake presents a different pattern, because the linear phase of
linear-response-plateau function was extended up to
13.66% CP (P<0.05). This value is out of CP levels interval obtained in this study (7.39 to 13.62%) and indicates that CP intake should be interpreted as a simple linear function according to CP levels in the diet.
The increasing voluntary intake until the CP level in the diet was near to 9% (assuming this value as approximated estimate of plateau beginning of intake expressed as g/kg live weight) supports the idea of a higher productive efficiency for cattle fed low-quality tropical pastures during dry season when supplemented with nitrogenous compounds (Paulino et al., 2006; Costa et al., 2008; Detmann et al., 2009).
That positive effect can be attributed to the stimulus caused by the increased availability of nitrogenous compounds on microbial activity in the rumen, particularly on insoluble fiber, which presents high rumen fill effect. Under these circumstances, the nitrogenous compounds supplementation increases the NDF degradation rate (Costa et al., 2008), the rumen turnover of non-degraded and non-degradable insoluble fibrous compounds (Allen, 1996; Paulino et al., 2006; Detmann et al., 2008),
and the voluntary forage intake, as observed in this study (Table 3).
The positive effects of nitrogen supplementation on rumen rate of passage can be indirectly verified through iNDF intake (Table 3). Assuming a steady-state in the rumen, it may be assumed that resident mass of iNDF is approximately constant. As indigestible neutral detergent fiber leaves the rumen only by passage, a new iNDF input will be obtained just after transit of a part of iNDF from rumen to posterior gastrointestinal tract (Paulino et al., 2006; Sampaio et al., 2010). Therefore, the increased iNDF intake (P<0.05) makes evident an improvement in ruminal rate of passage of fibrous particles, which is intimately associated with improvement in NDF intake in diets based on low-quality tropical forages (Detmann et al., 2009).
Lazzarini et al. (2009a) and Sampaio et al. (2010) evaluated increasing levels of supplementary nitrogenous compounds in cattle fed low-quality tropical forages and concluded that maximum voluntary intake was reached when CP level of the diet is increased up to 10%, as DM basis.
Apparently, the estimates presented by those authors are above the CP level corresponding to intake optimization in this work (approximately 9% crude protein). Although the forage used in those studies was the same in this work (B. decumbens), it must be emphasized that those were
obtained by cutting the whole available forage on pasture. The evaluation of chemical characteristics of the forages used by Sampaio et al. (2010) and Lazzarini et al. (2009a)
Linear phase Plateau
Item Intercept Slope CP level1 Estimate2 R²
kg/d
Dry matter -2.2384 0.901 8.4408 5.3661 0.7824
Dry matter from pasture -2.0770 0.879 8.4030 5.3099 0.7284
Organic matter -2.6215 0.895 8.5411 5.0242 0.8223
Organic matter form pasture -2.2447 0.844 8.3343 4.7909 0.8575
Crude protein -0.0499 0.055 13.6617 0.7015 0.8388
Ether extract -0.0433 0.023 8.5325 0.1563 0.4487
Neutral detergent fiber correct for ash and fiber -1.7806 0.621 8.6195 3.5714 0.8350
Digested dry matter -3.3152 0.664 8.7069 2.4643 0.6798
Digested neutral detergent fiber -2.0088 0.473 8.7367 2.1243 0.8222
Indigestible neutral detergent fiber -0.4365 0.180 8.0565 1.0116 0.8358
g/kg LW
Dry matter -5.4896 3.156 8.7941 22.2607 0.8849
Dry matter from pasture -4.8520 3.069 8.6993 21.8487 0.8866
Organic matter -7.5114 3.195 8.8766 20.8473 0.9272
Organic matter from pasture -6.0237 2.993 8.6577 19.8927 0.9374
Neutral detergent fiber corrected for ash and protein -5.5096 2.271 8.9467 14.8047 0.9197
Indigestible neutral detergent fiber -1.4916 0.686 8.3420 4.2333 0.7318
Table 3 - Parameterization of voluntary intake in cattle under grazing supplemented with nitrogenous compounds according to linear-response-plateau function
indicates higher contents of acid detergent insoluble protein (ADIP) (32.45 and 24.46% of CP, respectively) compared to the forage used in this study (10.94% of CP). Thereby, assuming an inverse relationship between ADIP content and CP availability (Sniffen et al., 1992), the lower supplement input to optimize the intake in this study can be supported by higher protein availability in the forage used here.
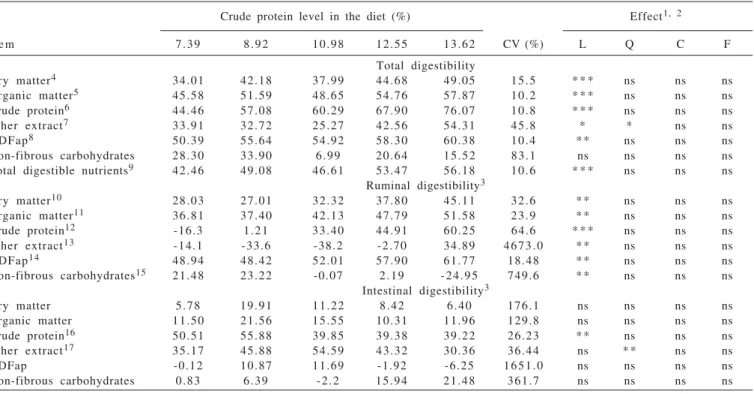
The total digestibility coefficients of DM, OM, CP and NDFap, and the total digestible nutrients (TDN) levels in the diet presented positive linear relationships (P<0.10) with the CP levels in the diet (Table 4). It was observed that supplementation caused few alterations on intestinal digestibility. So, the pattern of total digestibility seems to be resultant of stimulus on ruminal digestibility, such as previously discussed. This argument is supportable because all ruminal digestibility coefficients, excepting NFC, were linear increased by nitrogen supplementation (P<0.05) (Table 4).
In a particular point of view, the ruminal digestibility of CP deserves special attention because the estimates
changed from negative into positive as supplementary protein was added to the diet (Table 4).
When positive ruminal digestibility of crude protein is observed, there is no quantitative deficiency of nitrogenous compounds in the diet (Detmann et al., 2005). On other words, this is a situation where nitrogen availability is higher compared to energy availability in the rumen and increasing supplementation would cause ruminal spoilage of nitrogenous compounds.
On the other hand, negative ruminal digestibility of crude protein is observed when the abomasal flow of nitrogen is higher than nitrogen intake, what occurs because nitrogen recycling in the rumen becomes highly significant in front of nitrogen intake (Titgemeyer, 1997; Detmann et al., 2005). Under these circumstances, there is an overall deficiency of nitrogenous compounds in the diet.
Theoretically, an ideal nutritional condition would be obtained when the ruminal digestibility of CP is zero. It would represent a perfect relative balance between energy and nitrogen availability in the rumen.
Crude protein level in the diet (%) Effect1, 2
Item 7.39 8.92 10.98 12.55 13.62 CV (%) L Q C F
Total digestibility
Dry matter4 34.01 42.18 37.99 44.68 49.05 15.5 * * * ns ns ns
Organic matter5 45.58 51.59 48.65 54.76 57.87 10.2 * * * ns ns ns
Crude protein6 44.46 57.08 60.29 67.90 76.07 10.8 * * * ns ns ns
Ether extract7 33.91 32.72 25.27 42.56 54.31 45.8 * * ns ns
NDFap8 50.39 55.64 54.92 58.30 60.38 10.4 * * ns ns ns
Non-fibrous carbohydrates 28.30 33.90 6.99 20.64 15.52 83.1 ns ns ns ns
Total digestible nutrients9 42.46 49.08 46.61 53.47 56.18 10.6 * * * ns ns ns Ruminal digestibility3
Dry matter10 28.03 27.01 32.32 37.80 45.11 32.6 * * ns ns ns
Organic matter11 36.81 37.40 42.13 47.79 51.58 23.9 * * ns ns ns
Crude protein12 -16.3 1.21 33.40 44.91 60.25 64.6 * * * ns ns ns
Ether extract13 -14.1 -33.6 -38.2 -2.70 34.89 4673.0 * * ns ns ns
NDFap14 48.94 48.42 52.01 57.90 61.77 18.48 * * ns ns ns
Non-fibrous carbohydrates15 21.48 23.22 -0.07 2.19 -24.95 749.6 * * ns ns ns Intestinal digestibility3
Dry matter 5.78 19.91 11.22 8.42 6.40 176.1 ns ns ns ns
Organic matter 11.50 21.56 15.55 10.31 11.96 129.8 ns ns ns ns
Crude protein16 50.51 55.88 39.85 39.38 39.22 26.23 * * ns ns ns
Ether extract17 35.17 45.88 54.59 43.32 30.36 36.44 ns * * ns ns
NDFap -0.12 10.87 11.69 -1.92 -6.25 1651.0 ns ns ns ns
Non-fibrous carbohydrates 0.83 6.39 -2.2 15.94 21.48 361.7 ns ns ns ns
Table 4 - Total, ruminal and intestinal digestibility coefficients and levels of total digestible nutrients in the diet in cattle under grazing supplemented with nitrogenous compounds
NDFap = neutral detergent fiber corrected for ash and protein.
1 (ns), (*), (**) and (***): non-significant (P>0.10) and significant at 10%, 5% and 1% of probability by F test, respectively. 2 L, Q, C, and F: linear, quadratic, cubic and fourth degree, respectively.
3 The digestibility coefficients are expressed as % of the material that arrived in the digestion site.
4Yˆ = 20.9197 + 1.9324X (r² = 0.7182). 5Yˆ= 34.0001 + 1.6545X (r² = 0.7602). 6Yˆ= 12.7849 + 4.5243X ( r2 = 0.9488). 7Yˆ = 190.6789 -33.8719X + 1.75020X² (R² = 0.8977). 8Yˆ = 41.2341 + 1.3742X (r² = 0.8635). 9Yˆ = 29.0899 + 1.9146X (r2 = 0.8096) 10Yˆ = 5.3080 + 2.7711X (r² = 0.8881). 11Yˆ = 17.1314 – 2.4803X (r2 = 0.9635). 12Yˆ = –106.4842
+ 12.3091X (r² = 0.9766). 13Yˆ = –85.2763 + 7.9269X (r² = 0.5848).14Yˆ = 31.1763 + 2.1779X (r² = 0.9333). 15Yˆ= 78.3228 – 6.9342X (r² = 0.8121). 16Yˆ = 72.0925 – 2.5368X
According to regression equation that describe the relationship between this variable and the diet level of CP (Table 4), the ruminal digestibility of CP becomes zero on 8.65% CP in the diet. This estimate is close to the CP level associated with maximum voluntary intake (Table 3).
In this way, crude protein levels lower than 8.65% (approximately 9%) would implicate deficiency of nitrogenous compounds in the diet. On the other hand, crude protein levels higher than that would cause a relative excess of nitrogen compared to energy available in the forage. For this former case, improvements on intake would not be observed anymore because surplus of nitrogenous compounds is associated with inhibition or causes no stimulus on voluntary intake (Detmann et al., 2007; 2009). The linear increasing of ruminal digestibility as a function of CP levels in the diet (Table 4) agrees with Satter & Slyter (1974) and Lazzarini et al. (2009b), who verified through in vitro and in situ studies, respectively, that
rumen degradation rate was increased when the CP levels was increased up to 13-14%, which is close to higher protein level in this study.
The concomitant evaluation of intake and digestibility variables leads to some divergences concerning the recommendation of CP level in the diet (Tables 3 and 4). Therefore, the measurement of the intake of digested compounds must be considered because it allows the integration of the effects of supplementation on intake and digestibility simultaneously (Sampaio et al., 2010). From this statement, the intake of both digested DM (DDM) and NDF (DNDF) were found presenting a linear-response-plateau relationship with CP levels (P<0.05), with plateau
beginning at 8.71 and 8.74% CP, respectively.
Considering a low-quality diet, the linear-response-plateau pattern with ascendant linear phase of DDM and
DNDF brings into evidence that ruminal degradation is a second order process, where both feed characteristics and enzymatic systems availability are determinant factors (Detmann et al., 2008; 2009).
In this case, one may speculate that nitrogen deficiency for microbial synthesis of enzymatic systems is observed when diet levels of crude protein are lower than 9%, which decreases the ingested forage through compromising the degradation rate of insoluble fiber (Detmann et al., 2008). As discussed before, the degradation rate affects directly the passage rate (Allen, 1996; Detmann et al., 2008). Thus, a deficiency of enzymatic systems could reduce the intake, such as observed in this work (Table 3).
Therefore, during linear phase of DDM and DNDF intakes the rumen degradation dynamics would be
predominantly defined by zero order reaction, where the events become limited by availability of microbial enzymatic systems. Under similar situations, the supplemental nitrogenous compounds supply precursors for microbial synthesis of fibrolytic enzymes (Detmann et al., 2009). However, the plateau observed from 9% CP (Table 3) indicates that effects of supplemental nitrogen are not so evident and an adequate rumen supplying of enzymes could be assumed. Under these circumstances, the rumen degradation dynamics is supposed to be predominantly determined by first order reactions, where the feed characteristics are the most important factors to define degradation (Detmann et al., 2008; 2009).
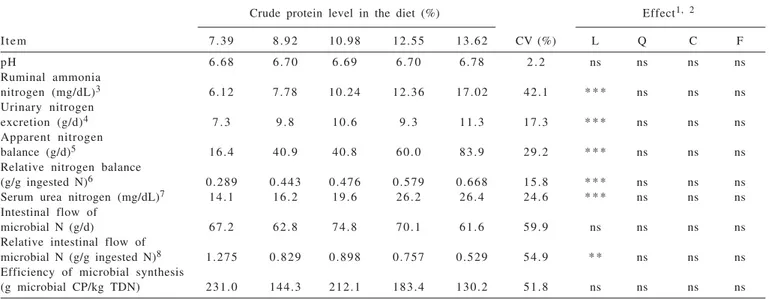
Rumen pH values were not affected by crude protein levels (P>0.10) and remained over critical limits for fibrolytic activity (Mould et al., 1983) (Table 5). Moreover, the RAN concentration was linearly increased (P<0.01) by CP levels in the diet (Table 5).
There are several reference estimates of RAN concentration in the literature to qualify rumen environment regarding low-quality forage utilization (McAllan & Smith, 1983; Hoover, 1986; Leng, 1990). However, those can reduce the accuracy of inferences because there are many variations in the microbial requirements according to substrate, rumen pH, and microbial species (Lazzarini et al., 2009a; Sampaio et al., 2010).
In this context, by considering 9% CP as the optimizing point (Table 3) and using the regression equation applied to describe the relationship between RAN and CP levels (Table 5), it can be verified that optimization occurred when 8.00 mg RAN/dL of rumen fluid was reached.
Detmann et al. (2009) defined the concept of the constant of optimization of ruminal degradation (kDEG) from analogy to Michaelis-Menten constant (km). According those
authors, kDEG represents the minimal RAN concentration where first order reactions become predominant in ruminal degradation of NDF. In other words, from kDEG the enzymatic limitations would not be the main constraint for ruminal fiber utilization and the feed characteristics would become the major determinant of rumen degradation, which would be essentially a second order process.
Detmann et al. (2009) defined for animals fed low-quality tropical forage the kDEG similar to 8 mg RAN/dL rumen fluid. This estimate converges to RAN concentration obtained at 9% CP in the diet. It corroborates the previous discussion regarding integration of intake and digestibility variables.
RAN concentration overcomes 15 mg/dL. The average value of highest crude protein level is close to this (Table 5). So, it seems to be justified the stable pattern of intake from the optimization point (approximately 9% CP; Table 3; Figure 1) when compared to other results, which made evident the intake reduction under excessive supplementary nitrogenous compounds (Del Curto et al., 1990; Lazzarini et al., 2009a; Sampaio, et al. 2010).
The urinary excretion of nitrogen, the serum urea nitrogen, and the apparent nitrogen balance were linearly increased (P<0.01) by CP levels in the diet (Table 5), which is consonant with the increase in the ruminal availability of nitrogenous compounds caused by supplementation.
In a similar way, the estimates of relative nitrogen balance were linear and positively associated (P<0.01) with CP levels (Table 5). However, this variable differs from another present above because the relative nitrogen balance encompass aspects related to form or intensity of nitrogen assimilation besides ruminal availability.
The increase in the nitrogen urinary excretion indicates that higher nitrogen mass was lost as the supplementation level increased (Table 5). Nevertheless, the increased relative nitrogen balance bring into evidence that nitrogen assimilation in the rumen became more efficient even considering the increase in absolute nitrogen loss. In this case, the increase in supplementation level enhanced the fraction of nitrogenous compounds retained by the animal.
The relative nitrogen balance pattern could be attribute to an improvement in the energy extraction from fiber caused by nitrogen supplementation (Paulino et al., 2006), which can enhance the microbial assimilation of nitrogen (Costa et al., 2008) and the relative retention of nitrogen by the ruminant animal.
The crude protein levels in the diet did not exert effects (P>0.10) on intestinal flow of microbial nitrogen or efficiency of microbial synthesis (Table 5). The average efficiency (180.2 g microbial CP/kg TDN) was higher than theoretical reference described by Valadares Filho et al. (2006) for tropical conditions (120 g microbial CP/kg TDN). However, high microbial efficiencies have been obtained in cattle fed low-quality forages (Lazzarini et al, 2009a; Sampaio et al, 2010; Souza et al., 2010). This pattern seems to be caused by a
Figure 1 - Pasture and neutral detergent fiber intake in cattle under grazing supplemented with nitrogenous compounds.
Crude protein level in the diet (%) Effect1, 2
Item 7.39 8.92 10.98 12.55 13.62 CV (%) L Q C F
pH 6.68 6.70 6.69 6.70 6.78 2 . 2 ns ns ns ns
Ruminal ammonia
nitrogen (mg/dL)3 6.12 7.78 10.24 12.36 17.02 42.1 * * * ns ns ns
Urinary nitrogen
excretion (g/d)4 7 . 3 9 . 8 10.6 9 . 3 11.3 17.3 * * * ns ns ns
Apparent nitrogen
balance (g/d)5 16.4 40.9 40.8 60.0 83.9 29.2 * * * ns ns ns
Relative nitrogen balance
(g/g ingested N)6 0.289 0.443 0.476 0.579 0.668 15.8 * * * ns ns ns
Serum urea nitrogen (mg/dL)7 14.1 16.2 19.6 26.2 26.4 24.6 * * * ns ns ns Intestinal flow of
microbial N (g/d) 67.2 62.8 74.8 70.1 61.6 59.9 ns ns ns ns
Relative intestinal flow of
microbial N (g/g ingested N)8 1.275 0.829 0.898 0.757 0.529 54.9 * * ns ns ns Efficiency of microbial synthesis
(g microbial CP/kg TDN) 231.0 144.3 212.1 183.4 130.2 51.8 ns ns ns ns
Table 5 - Ruminal pH and characteristics of nitrogen metabolism in cattle under grazing supplemented with nitrogenous compounds
1 (ns), (*), (**) and (***): non-significant (P>0.10) and significant at 10%, 5% and 1% of probability by F test, respectively. 2 L, Q, C, and F: linear, quadratic, cubic and fourth degree, respectively.
higher relative contribution of metabolic fecal fraction in the TDN estimates.
Despite of constant intestinal flow of microbial nitrogen across crude protein levels (P>0.10), it was verified that relative intestinal flow of microbial nitrogen (the ratio of microbial nitrogen upon nitrogen intake) was linearly reduced (P<0.05) by protein level in the diet (Table 5; Figure 2). In this case, one may observe that average estimates were higher than 1 in the lower supplementation levels and became lower as the nitrogenous compounds supply was increased.
Relative microbial nitrogen flow higher than 1 indicates that intestinal flow of microbial nitrogen is higher than ingested nitrogen. In other words, the ingested nitrogen was not enough to adequately sustain the microbial growth in the rumen, demanding mobilization of animal reserves that are led to the ruminal system by recycling mechanisms (NRC, 1985; Van Soest, 1994). This pattern corroborates the behaviour of ruminal digestibility of crude protein (Table 4).
According to regression equation that describe the relationship between relative microbial flow and CP levels in the diet (Table 5), the equilibrium between nitrogen intake and microbial flow is observed on 9.46% CP in the diet (Figure 2). It once more emphasizes that productive optimization was reached with crude protein levels close to a 9%.
The overall results of this work agree with suggestions of Sampaio et al (2010). According to this author, the supplementary CP should be analyzed from the point of view of two different pools. The first one should be planned to optimize the use of the energy substrates
within the forage, providing sufficient crude protein to raise the protein content of the forage close to 9%, as dry matter basis. Thus a greater amount of low cost energy is provided to the animal metabolism from fibrous carbohydrates of the forage. The second protein pool should, therefore, focus on the use of the carbohydrate sources present in the supplements and, when necessary, on the protein requirements of the animal so that the planned weight gain levels be attained.
Conclusions
Supplementation with nitrogen compounds in quantities that raise the crude protein content in the diet to levels close to 9%, as dry matter basis, optimizes the use of low-quality tropical forage by cattle under grazing.
References
ALLEN, M.S. Physical constrains on voluntary intake of forages by ruminants. Journal of Animal Science, v.74, p.3063-3075, 1996.
CASALI, A.O.; DETMANN, E.; VALADARES FILHO, S.C. et al. Influência do tempo de incubação e do tamanho de partículas sobre os teores de compostos indigestíveis em alimentos e fezes bovinas obtidas por procedimentos in situ. Revista Brasileira de Zootecnia, v.37, p.335-342, 2008.
CECAVA, J.M.; MERCHEN, N.R.; GAY, L.C. et al. Composition of ruminal bacteria harvested from steers as influenced by dietary energy level, feeding frequency, and isolation techniques.
Journal of Dairy Science, v.73, p.2480-2488, 1990. CHEN, X.B.; GOMES, M.J. Estimation of microbial protein
supply to sheep and cattle based on urinary excretion of purine derivatives - an overview of the technical details. Buchsburnd Aberdeen: Rowett Research Institute,1992. 21p. CHIZZOTTI, M.L.; VALADARES FILHO, S.C.; VALADARES,
R.F.D. et al. Consumo, digestibilidade e excreção de uréia e derivados de purinas em novilhas de diferentes pesos. Revista Brasileira de Zootecnia, v.35, p.1813-1821, 2006. COSTA, V.A.C.; DETMANN, E.; VALADARES FILHO, S.C. et al.
Degradação in vitro da fibra em detergente neutro de forragem tropical de baixa qualidade em função de suplementação com proteína e/ou carboidratos. Revista Brasileira de Zootecnia, v.37, p.494-503, 2008.
DelCURTO, T.; COCHRAN, R.C.; CORAH, L.R. et al. Supplementation of dormant Tallgrass-Prarie forage: II. Performance and forage utilization characteristics in grazing beef cattle receiving supplements of different protein concentrations. Journal of Animal Science, v.68, p.532-542,
1990.
DETMANN, E.; PAULINO, M.F.; VALADARES FILHO, S.C. et al. Níveis de proteína em suplementos para terminação de bovinos em pastejo durante o período de transição seca/águas: digestibilidade aparente e parâmetros do metabolismo ruminal e dos compostos nitrogenados. Revista Brasileira de Zootecnia, v.34, p.1380-1391, 2005.
DETMANN, E.; PAULINO, M.F.; VALADARES FILHO, S.C. et al. Fatores controladores de consumo em suplementos múltiplos fornecidos ad libitum para bovinos manejados a pasto. Cadernos Técnicos de Veterinária e Zootecnia, v.55, p.73-93, 2007. DETMANN, E.; PAULINO, M.F.; VALADARES FILHO, S.C. Avaliação nutricional de alimentos ou de dietas? Uma abordagem Figure 2 - Relationship between relative intestinal flow of
conceitual. In: SIMPÓSIO DE PRODUÇÃO DE GADO DE CORTE, 6., 2008, Viçosa, MG. Anais... Viçosa, MG: SIMCORTE, 2008. p.21-52.
DETMANN, E.; PAULINO, M.F.; MANTOVANI, H.C. et al. Parameterization of ruminal fibre degradation in low-quality tropical forage using Michaelis-Menten kinetics. Livestock Science, v.126, p.136-146, 2009.
De VRIES, M.F.W. Estimating forage intake and quality in grazing cattle: a reconsideration of the hand-plucking method.
Journal of Range Management, v.48, p.370-375, 1995. HOOVER, W.H. Chemical factors involved in ruminal fiber
digestion. Journal of Dairy Science, v.69, p.2755-2766, 1 9 8 6 .
LAZZARINI, I.; DETMANN, E.; SAMPAIO, C.B. et al. Intake and digestibility in cattle fed low-quality tropical forage and supplemented with nitrogenous compounds. Revista Brasileira de Zootecnia, v.38, p20-21-2030, 2009a.
LAZZARINI, I.; DETMANN, E.; SAMPAIO, C.B. et al.Dinâmicas de trânsito e degradação da fibra em detergente neutro em bovinos alimentados com forragem tropical de baixa qualidade e compostos nitrogenados. Arquivo Brasileiro de Medicina Veterinária e Zootecnia, v.61, p.635-647, 2009b.
LENG, R.A. Factors affecting the utilization of “poor-quality” forages by ruminants particularly under tropical conditions.
Nutrition Research Reviews, v.3, p.277-303, 1990. LICITRA, G.; HERNANDEZ, T.M.; Van SOEST, P.J.
Standardization of procedures for nitrogen fractionation of ruminant feeds. Animal Feed Science and Technology, v.57, p.347-358, 1996.
LITTELL, R.C.; FREUND, R.J.; SPECTOR, P.C. SAS System for linear models. 3.ed. Cary: SAS Institute Inc., 1991. 329p. McALLAN, A.B.; SMITH, R.H. Factors influencing the digestion
of dietary carbohydrates between the mouth and abomasum of steers. British Journal of Nutrition, v.50, p.445-454, 1983. MERTENS, D.R. Gravimetric determination of amylase-treated neutral detergent fiber in feeds with refluxing in beakers or crucibles: collaborative study. Journal of AOAC International, v.85, p.1217-1240, 2002.
MOULD, F.L.; ØRSKOV, E.R.; MANNS, O. Associative effects of mixed feeds. I. Effects of type and level of supplementation and the influence of the rumen fluid pH on cellulolysis in vivo and dry matter digestion of various roughages. Animal Feed Science and Technology, v.10, p.15-25, 1983.
NATIONAL RESEARCH COUNCIL - NRC. Ruminant nitrogen usage. Washington D.C.: National Academic Press, 1985. 148p. PAULINO, M.F.; DETMANN, E.; ZERVOUDAKIS, J.T. Suplementos múltiplos para recria e engorda de bovinos em pastagens. In: SIMPÓSIO DE PRODUÇÃO DE GADO DE CORTE, 2., 2001, Viçosa, MG. Anais... Viçosa, MG: SIMCORTE, 2001. p.187-233. PAULINO, M.F.; DETMANN, E.; VALADARES FILHO, S.C. Suplementação animal em pasto: energética ou protéica? In:
SIMPÓSIO SOBRE MANEJO ESTRATÉGICO DA PASTAGEM, 3., 2006, Viçosa, MG. Anais... Viçosa, MG: SIMFOR, 2006. p.359-392.
SAMPAIO, C.B.; DETMANN, E.; PAULINO, M.F. et al. Intake and digestibility in cattle fed low-quality tropical forage and supplemented with nitrogenous compounds. Tropical Animal Health and Production, 2010, in press. DOI: 10.1007/s11250-010-9581-7.
SATTER, L.D.; SLYTER, L.L. Effect of ammonia concentration on rumen microbial protein production i n v i t r o. British Journal of Nutrition, v.32, p.199-208, 1974.
SILVA, D.J.; QUEIROZ, A.C. Análise de alimentos: Métodos químicos e biológicos. 3.ed. Viçosa, MG: Editora UFV, 2002. 235p.
SNIFFEN, C.J.; O’CONNOR, J.D.; Van SOEST, P.J. et al. A net-carbohydrate and protein system for evaluating cattle diets: II. Carbohydrate and protein availability. Journal of Animal Science, v.70, p.3562-3577, 1992.
SOUZA, M.A.; DETMANN, E.; PAULINO, M.F. et al. Intake, digestibility, and rumen dynamics of neutral detergent fibre in cattle fed low-quality tropical forage and supplemented with nitrogen and/or starch. Tropical Animal Health and Production, 2010, in press, DOI: 10.1007/s11250-010-9566-6. TITGEMEYER, E.C. Design and interpretation of nutrient digestion studies. Journal of Animal Science, v.75, p.2235-2247, 1997.
TITGEMEYER, E.C.; ARMENDARIZ, C.K.; BINDEL, D.J. et al. Evaluation of titanium dioxide as digestibility marker for cattle.
Journal of Animal Science, v.79, p.1059-1063, 2001. USHIDA, K.; LASSALAS, B.; JOUANY, J.P. Determination of assay
parameters for RNA analysis in bacterial and duodenal samples by spectrophotometry. Influence of treatment and preservation.
Reproduction Nutrition Development, v.25, p.1037-1046, 1985.
VALADARES, R.F.D.; BRODERICK, G.A.; VALADARES FILHO, S.C. et al. Effect of replacing alfalfa silage with high moisture corn on ruminal protein synthesis estimated from excretion of total purine derivatives. Journal of Dairy Science, v.82, p.2686-2696, 1999.
VALADARES FILHO, S.C.; PINA, D.S.; CHIZZOTTI, M.L. et al. Degradação ruminal da proteína dos alimentos e síntese de proteína microbiana. In: VALADARES FILHO, S.C.; PAULINO, P.V.R.; MAGALHÃES, K.A. (Eds.) Exigências nutricionais de zebuínos e tabelas de composição de alimentos. Viçosa, MG: DZO-UFV, 2006. p.13-44.
Van SOEST, P.J. Nutritional ecology of the ruminant. 2.ed. Ithaca: Cornell University Press, 1994. 476p.