_____________________________________
1 Researcher Ph.D., Embrapa Western Region Agriculture, PO BOX 661, Dourados - MS, [email protected] 2 Undergraduate Student of Computer Science, State University of Mato Grosso do Sul, UEMS, [email protected] 3 Professor Ph.D., Entomology Department, Federal University of Lavras, UFLA, [email protected]
Recebido pelo Conselho Editorial em: 10-11-2008 Aprovado pelo Conselho Editorial em: 16-10-2009
IN THE STATE OF MATO GROSSO DO SUL, BRAZIL
RÔMULO P. SCORZA JÚNIOR1, JOÃO P. DA SILVA2, RENÊ L. DE O. RIGITANO3
ABSTRACT: The understanding of unsaturated soil water flow at process-level is essential to develop proper management actions for environmental protection in agricultural systems. One important tool for simulation of soil water flow that has been used worldwide is the SWAP model. The aim of this work was to test and to calibrate the SWAP model by inverse modeling to describe moisture profiles in a Brazilian very clayey Latossol in Dourados, State of Mato Grosso do Sul, Brazil. The SWAP model was tested in an experimental field of 0.09 ha cultivated with soybean and soil profiles were sampled eight times between December 2006 and October 2007. The SWAP input values (i.e. soil water retention curves and meteorological data) were based on in-situ measurements. Simulations with uncalibrated soil water retention curves resulted in moisture profiles that were too wet for almost all sampling dates, in particular between 0-10 cm depth. After calibration of soil water retention curves, there was a good improvement in the simulated moisture profiles, which were within the range of measured values for almost all depths and sampling dates.
KEYWORDS: soil water flow, SWAP, inverse modeling.
SIMULAÇÃO DOS PERFIS DE UMIDADE EM UM LATOSSOLO NA REGIÃO DE DOURADOS, MATO GROSSO DO SUL
RESUMO: O entendimento, em nível de processos, do fluxo de água não saturado no solo é essencial para desenvolver ações de manejo apropriadas para proteção ambiental em sistemas agrícolas. Uma ferramenta importante para a simulação do fluxo de água no solo que tem sido utilizada em todo o mundo é o simulador SWAP. O objetivo deste trabalho foi testar e calibrar o simulador SWAP, pela modelagem inversa, para descrever os perfis de umidade em um Latossolo muito argiloso, em Dourados, Mato Grosso do Sul. O simulador SWAP foi testado em área experimental de 0,09 ha, cultivada com soja, e os perfis de umidade foram amostrados em oito datas, no período de dezembro de 2006 a outubro de 2007. Os dados de entrada para o simulador SWAP (curvas de retenção de água no solo e dados meteorológicos) foram baseados em medições na área experimental. Simulações baseadas nas curvas de retenção não calibradas resultaram em perfis de umidade com níveis superiores às observadas em quase todas as datas de amostragem, especialmente para a profundidade de 0-10 cm. Após a calibração das curvas de retenção, obteve-se boa melhora nas simulações dos perfis de umidade, que ficaram dentro dos valores medidos para quase todas as profundidades e datas de amostragem.
PALAVRAS-CHAVE: fluxo de água no solo, SWAP, modelagem inversa.
INTRODUCTION
Unsaturated soil water flow is a key factor in the hydrological cycle because it determines the rate of soil evaporation, recharge to groundwater, plant transpiration and runoff. An accurate understanding of unsaturated soil water flow is essential to derive proper management conditions for environmental protection in agricultural systems.
and simulation tools (SCORZA JÚNIOR, 2006; MONTEIRO et al., 2009). BOESTEN (2000) mentioned two important advantages of modeling tools compared to experimental assessments, that are: i) possibility to investigate the effect of weather conditions using multiyear simulations and thus avoiding long-term experiments that are expensive and time consuming; ii) modeling enables the integration of the actual knowledge of the processes and thus can be useful in identifying gaps and research priorities.
An important tool for simulation of soil water flow that has been used is the SWAP model (KROES & DAM, 2003; DAM et al., 2008), which simulates transport of water, solutes, and heat in the unsaturated zone in interaction with vegetation development. SWAP has also been linked to other models with the aim to generate accurate soil water fluxes for detailed chemical transport, such as PEARL (LEISTRA et al., 2002) for pesticides and ANIMO (GROENENDIJK et al., 2005) for nutrients. SWAP has been used worldwide for many different applications (e.g. groundwater conservation, nutrient transport, water balance prediction etc). DAM (2000) tested SWAP to simulate water flow in a cracked clay soil in the Netherlands and concluded that the solution of Richards’s equation considering the soil as only one domain could not mimic the average behavior of solute transport.
Also in the Netherlands, SCORZA JÚNIOR & BOESTEN (2005) tested SWAP to simulate soil moisture profiles in a cracked clay soil and obtained good simulations after calibration of soil water retention curves. Studies showing SWAP performance in Brazil are scarce. More recently, LOUZADA et al. (2008) used the SWAP model to simulate groundwater levels in a drained area with rice crop at the state of Rio Grande do Sul, Brazil, and found good agreement between measured and simulated groundwater levels. Until now, the SWAP model has not been tested to simulate soil moisture profiles in Brazilian soils. The aim of this work was to test and to calibrate the SWAP model to describe moisture profiles in a Brazilian very clayey Latossol in Dourados, in the state of Mato Grosso do Sul, Brazil.
MATERIAL AND METHODS
SWAP model is described in detail elsewhere (KROES & DAM, 2003; DAM et al., 2008) and will be briefly described here. It describes water flow using Darcy equation considering one-dimensional, vertical and transient flow. The combination of Darcy equation with the conservation equation results in the well-known Richards equation:
(1)
in which,
C - water capacity, cm-1;
h - soil water pressure head, cm; t - time, day;
z - depth in soil, cm;
K - hydraulic conductivity, cm day-1, and S - rate of water uptake by plant roots, day-1.
The analytical functions proposed by GENUCHTEN (1980) are used to describe the hydraulic functions (h) and K(h):
(2)
(3) where,
- soil moisture content, cm3 cm-3;
r - residual soil moisture content, cm3 cm-3; S - saturated soil moisture content, cm3 cm-3;
KS - saturated hydraulic conductivity, cm day-1, and
(cm-1), (-) and n (-) - fitting parameters.
The rate of water uptake is given by:
(4) in which,
red - reduction factor (-), and
SP - potential rate of water uptake, day-1.
SP can be obtained from:
(5)
where,
TP - potential transpiration rate, cm day-1, and
dr - root layer thickness, cm.
Based on the calculation of potential evapotranspiration rate (ETP) using the
Penman-Monteith method, TP is given by:
(6) in which,
fw - fraction of the day that canopy is wet (-), and
EP - potential soil evaporation rate, cm day-1.
EP is calculated using:
(7) in which,
- extinction coefficient for global solar radiation (-), and LAI - leaf area index (-).
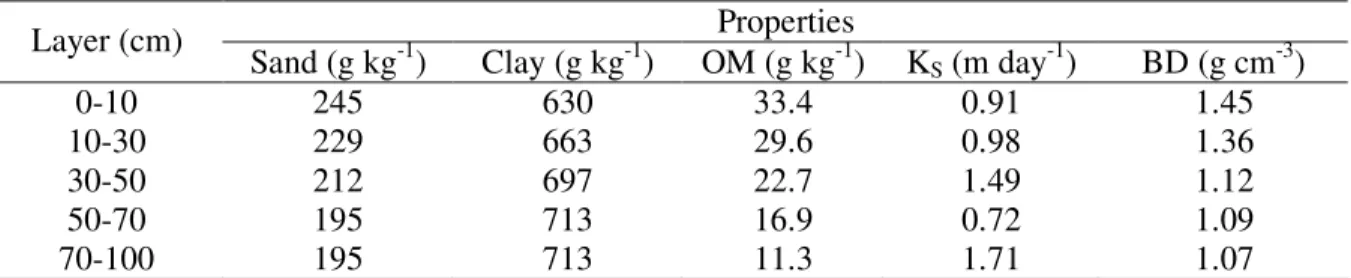
The SWAP model was tested in an experimental field (30 m long and 30 m wide) cultivated with soybean located at Embrapa Western Region Agriculture (22°16’26’’S, 54°48’50’’W), in Dourados, state of Mato Grosso do Sul. The experimental field consisted of 100 subplots of 3 m long by 3 m wide. The soil is a very clayey typical dystroferric Red Latossol (EMBRAPA, 1999). Soil properties of the experimental field are shown on Table 1. Soil profiles were sampled eight times on the following dates: 18 December 2006, 26 January 2007, 23 March 2007, 17 May 2007, 27 June 2007, 31 July 2007, 12 September 2007 and 30 October 2007. On each sampling date, four subplots were randomly selected and each subplot was sampled only once during the duration of the experiment. A pit (1 x 1 x 1m) was dig on each selected subplot and soil cores were collected from 0-10; 10-30; 30-50; 50-70, and 70-100 cm depth. All samples were put in a hermetic box and transported to the laboratory for determination of the moisture content by drying at 105 °C for 24 h.
15,000 cm using Richards’s pressure chamber. Soil water retention curves were described by fitting the Genuchten model [eqs.(2) and (3)] to the measured data using RETC (GENUCHTEN et al., 1991).
TABLE 1. Soil properties at the experimental field in Dourados, State of Mato Grosso do Sul, Brazil.
Properties Layer (cm)
Sand (g kg-1) Clay (g kg-1) OM (g kg-1) KS (m day-1) BD (g cm-3)
0-10 245 630 33.4 0.91 1.45
10-30 229 663 29.6 0.98 1.36
30-50 212 697 22.7 1.49 1.12
50-70 195 713 16.9 0.72 1.09
70-100 195 713 11.3 1.71 1.07
OM - organic matter; KS - saturated hydraulic conductivity; BD - soil bulk density.
Genuchten parameters used as input in SWAP are shown on Table 2. Saturated hydraulic conductivities in the field were measured at 0-10; 10-30; 30-50; 50-70; and 70-100 cm depth using a Guelph-type permeameter (VIEIRA, 1998). For these measurements, head ponded of 3 and 6 cm were used in the wells. Crop characteristics were obtained from measurements or taken from literature. Soybean was planted on October 30, 2006 and harvested on March 6, 2007. LAI values [eq.(7)] were obtained from literature (VISSOTTO JÚNIOR, 2003). The estimation of dr [eq.(5)]
was based on visual observations at different sampling dates. The factors red [eq.(4)] as a function
of soil water pressure head were obtained from WESSELING (1991).
TABLE 2. Uncalibrated and calibrated Genuchten input parameters used as input in SWAP to describe soil water retention curves at different depths.
Uncalibrated Calibrated
Depth (cm)
r (m3 m-3) (cm-1) n (-) r (m3 m-3) (cm-1) n (-)
0-10 0.310 0.0130 3.20 0.195 0.0186 1.955
10-30 0.311 0.0127 3.20 0.269 0.0294 1.957
30-50 0.298 0.0123 2.00 0.137 0.0097 1.437
50-70 0.282 0.0125 1.80 0.127 0.0084 1.447
70-100 0.266 0.0123 1.70 0.059 0.0052 1.478
The bottom boundary condition used in the simulations was free drainage of soil profile. Meteorological data as input for SWAP model were obtained from an automatic meteorological station at Embrapa Western Region Agriculture, which is located about 500 m from the experimental field. The potential evapotranspiration rate was estimated based on the Penman-Monteith method (ALLEN et al., 1998).
SWAP calibration of moisture profiles was carried out using the package PEST (DOHERTY, 2000) and the objective function ( ) to be minimized was:
(8) where,
b - vector with the fitting parameters;
ymeas - measured soil water content at time t and depth z, cm3 cm-3;
ysim - simulated soil water content at time t and depth z (cm3 cm-3) for the corresponding set of
Model performance was assessed using graphic display (i.e. visual comparison between measured and simulated soil moisture contents at each sampling date and depth) and the statistical indices Normalized Root-Mean Squared Error (NRMSE) and Modeling Efficiency (ME). These indices are given as:
(9)
(10)
where,
Si - simulated soil moisture content at depth, i;
Oi - measured soil moisture content at depth, i;
- average of measured soil moisture contents in the soil profile, and n - number of values.
NRMSE shows the spread around the average of the measurements and ME indicates if the model describes the data better than simply the average of the measurements. Optimal values of NRMSE and ME are zero and one, respectively.
RESULTS AND DISCUSSION
Cumulative rainfall during the entire experimental period (i.e. between Dec. 18, 2006 and Oct. 31, 2007) was 1,004 mm (Figure 1). The highest rainfall rates and frequencies did occur between December 2006 and March 2007 that corresponds to a period of 90 days after trials started. About 60% of total cumulative rainfall did occur within these 90 days.
Time (days)
0 40 80 120 160 200 240 280 320
R
a
in
fa
ll
(m
m
d
ia
-1
)
0 10 20 30 40 50 60 70
C
u
m
u
la
tiv
e
ra
in
fa
ll
(m
m
)
0 200 400 600 800 1000 1200
Daily rainfall Cumulative rainfall
FIGURE 1. Rainfall for the experimental period between December 18, 2006 and October 30, 2007 in Dourados, state of Mato Grosso do Sul, Brazil.
Cumulative evapotranspiration was slightly greater than cumulative rainfall during the experimental period, resulting in a negative water balance of -114 mm. Average values of cumulative rainfall and evapotranspiration during the last 28 years (between 1979 and 2007) at the experimental area are 1,160 (±308) and 1,191 (±71) mm, respectively. These average values were calculated considering only the period between December 18, and October 31 for the last 28 years. Based on this information, the cumulative values of rainfall and evapotranspiration obtained during the experimental period correspond, in average, to 87% and 94%, respectively.
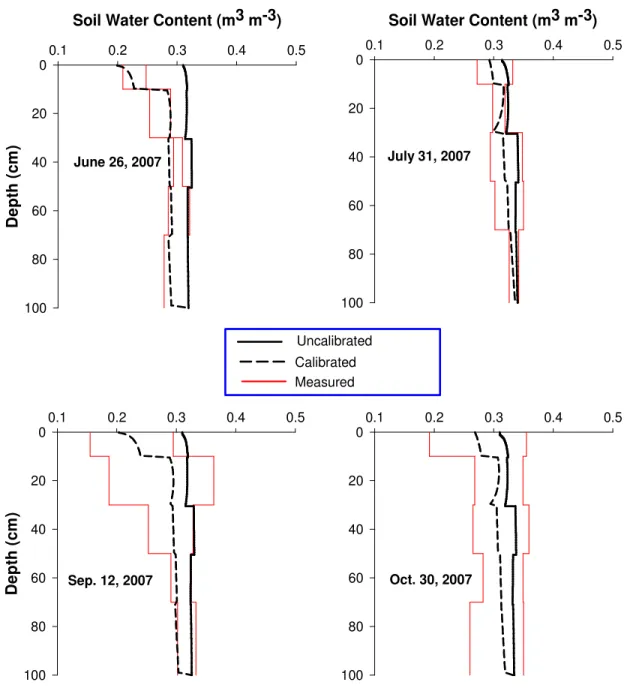
Soil moisture profiles measured during the experimental period are shown in Figures 2 and 3. The greatest variations on soil moisture contents as a function of time were observed at 0-30 cm depth. These most pronounced variations of moisture content on the top soil are the result of high influence of evapotranspiration. On the other hand, small variations on soil moisture contents were observed for soil layers below 30 cm. The range of measured soil moisture contents was large for some sampling dates and depths with the average value plus and minus two times the standard deviation close to 0.2 m3 m-3 (Figures 2 and 3).
18 Dec. 2006
Soil Water Content (m3 m-3)
0.1 0.2 0.3 0.4 0.5 0
20
40
60
80
100
Jan. 26, 2007
0.1 0.2 0.3 0.4 0.5
D
e
p
th
(
c
m
)
0
20
40
60
80
100
March 23, 2007
0.1 0.2 0.3 0.4 0.5 0
20
40
60
80
100
May 17, 2007
Soil Water Content (m3 m-3)
0.1 0.2 0.3 0.4 0.5
D
e
p
th
(
c
m
)
0
20
40
60
80
100
Dec. 18, 2006
Uncalibrated Calibrated Measured
Soil Water Content (m3 m-3)
0.1 0.2 0.3 0.4 0.5
D
e
p
th
(
c
m
)
0
20
40
60
80
100
June 26, 2007
Soil Water Content (m3 m-3)
0.1 0.2 0.3 0.4 0.5 0
20
40
60
80
100
July 31, 2007
0.1 0.2 0.3 0.4 0.5
D
e
p
th
(
c
m
)
0
20
40
60
80
100
Sep. 12, 2007 30 Oct. 2007
0.1 0.2 0.3 0.4 0.5 0
20
40
60
80
100
Oct. 30, 2007 Uncalibrated
Calibrated Measured
FIGURE 3. Moisture profiles in Dourados, state of Mato Grosso do Sul, Brazil. The area within the red lines is the range of measured values plus or minus two times the standard deviation.
Uncalibrated simulations resulted in moisture profiles that were too wet, with the exception on January 26, 2007, July 31, 2007 and October 30, 2007. The largest differences between measured and uncalibrated simulated values were found in the top 10 cm on December 18, 2006, March 23, 2007 and September 12, 2007. Large deviations (i.e. simulated values outside the range of measured values plus and minus two times the standard deviation) between measured and uncalibrated simulation values were also found at 30-100 cm on May 17, 2007 and at 0-50 cm soil depth on June 27, 2007. ME values were negative for uncalibrated simulations for almost all sampling dates (Table 3). These negative values suggest that the average of the measurements is a better data representation than the values of uncalibrated simulations.
experimental field. This lack of representativeness may have been caused by inadequate handling of spatial variability for the soil water retention in the experimental area. Soil cores for measurements of soil water retention curves at different depths were collected in a single pit of the experimental area (i.e. in only one location).
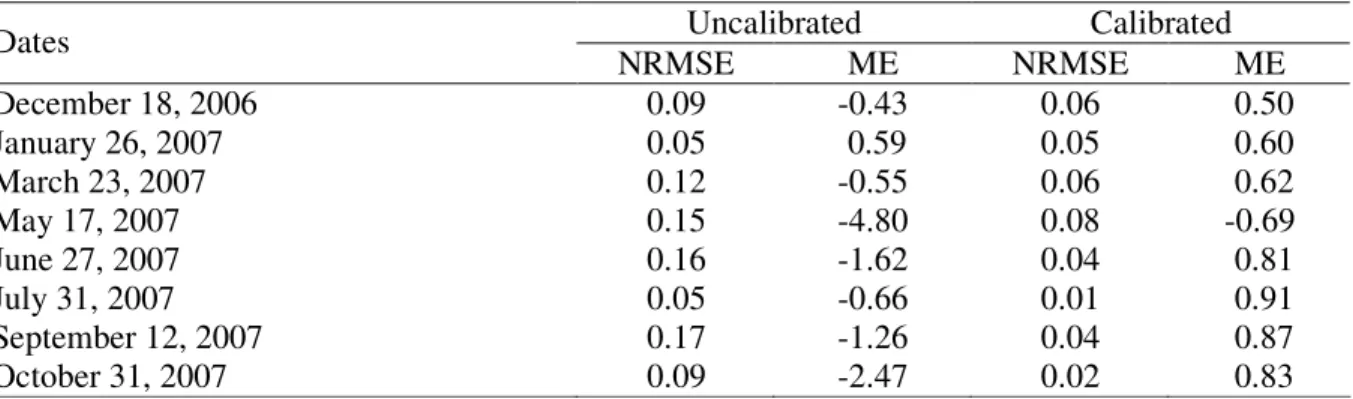
TABLE 3. Normalized Root-Mean Squared Error (NRMSE) and Modeling Efficiency (ME) of simulated moisture profiles.
Uncalibrated Calibrated Dates
NRMSE ME NRMSE ME
December 18, 2006 0.09 -0.43 0.06 0.50
January 26, 2007 0.05 0.59 0.05 0.60
March 23, 2007 0.12 -0.55 0.06 0.62
May 17, 2007 0.15 -4.80 0.08 -0.69
June 27, 2007 0.16 -1.62 0.04 0.81
July 31, 2007 0.05 -0.66 0.01 0.91
September 12, 2007 0.17 -1.26 0.04 0.87
October 31, 2007 0.09 -2.47 0.02 0.83
ALPHEN et al. (2001) compared four different methods to derive soil hydraulic properties to be used as input for a simulation model by analyzing their effect on simulated soil moisture profiles at three different areas of the Netherlands. The applied methods were laboratory measurements, class pedotransfer functions, continuous pedotransfer functions and continuous pedotransfer functions combined with simple laboratory measurements. These four methods originated different input values for the soil water retention curves. ALPHEN et al. (2001) concluded that input values based on laboratory measurements using samples collected at two points in the experimental area did not result in accurate simulations of moisture profiles. This conclusion is in agreement with our findings. ALPHEN et al. (2001) also concluded that the best simulations of moisture profiles were obtained when the combination of pedotransfer functions and laboratory measurements were used as input values for soil water retention curve. Therefore, it is recommend that input values of soil water retention curves based on a few measurements in the field should be used only as initial guesses for a calibration procedure when simulating field moisture profiles. In compliance with the above discussion, the next step was to calibrate SWAP model using the measured moisture profiles. The optimizing parameters were n, e r. Calibration procedure did decrease n and r values for all
depths (Table 2). With regard to parameter , there was an increase for the 0-30 cm and a decrease for the 30-100 cm soil layers.
Decision to optimize the parameters n and was based on VANCLOOSTER et al. (1992). These authors showed that simulated soil moisture profiles are very sensitive to parameters n and and concluded that any calibration of this variable should preferably include the optimization of these two parameters. VANCLOOSTER et al. (1992) concluded that simulations of soil moisture profiles were not sensitive to parameter r. However, in this study, r was optimized because it was
not experimentally measured but estimated by fitting measured data of soil water retention to Van Genuchten model. This procedure to estimate r leads to a certain degree of uncertainty. In general,
the optimization of n, and r parameters resulted in decreasing water retention capacity for all soil
Moisture content (m3 m-3)
0.1 0.2 0.3 0.4 0.5 0.6 0.7
P
re
s
s
u
re
h
e
a
d
(
c
m
)
1 10 100 1000 10000 100000
Measured Uncalibrated Calibrated
10 - 30 cm
Moisture content (m3 m-3)
0.1 0.2 0.3 0.4 0.5 0.6 0.7
1 10 100 1000 10000 100000
50 - 70 cm
FIGURE 4. Soil water retention curves in Dourados, State of Mato Grosso do Sul, Brazil.
After optimization of n, and r parameters, there was a good improvement in the simulation
of moisture profiles (Figures 2 and 3). Calibrated simulated values stayed within the range of measured values for almost all sampling dates and depths. The improvement of simulations after calibration did decrease and increase NRMSE and ME values, respectively, for all sampling dates (Table 3). This decrease on NRMSE values suggests that calibration procedure resulted in a reduction of simulated values dispersion around the average of measured values. With the exception of May 17, 2007, EF values were positive for all sampling dates after calibration. This suggests that calibrated simulations produce better results than simply using the average of measured values.
CONCLUSIONS
Soil water retention curves based on a few measurements in the field did not result in accurate simulations of moisture profiles. Input values of soil water retention curves based on a few measurements in the field should be used only as initial guesses for a calibration procedure when simulating field moisture profiles. Calibration of the soil water retention curves was necessary to obtain a good simulation of the moisture profiles using SWAP model in the studied soil. This success in the performance of SWAP model for simulation of moisture profiles indicates this as a promise tool for management of soil-water-plant relationship.
ACKNOWLEDGMENTS
We acknowledge the support of the National Council for Scientific and Technological Development (CNPq), International Foundation for Science (IFS), Support Foundation for the Development of Education, Science and Technology of the State of Mato Grosso do Sul (FUNDECT), and Brazilian Agriculture Research Corporation (EMBRAPA).
REFERENCES
ALPHEN, B.J. Van; BOOLTINK, H.W.G.; BOUMA, J. Combining pedotransfer functions with physical measurements to improve the estimation of soil hydraulic properties. Geoderma, Amsterdam, v.103, n.1-2, p.133-147, 2001.
BOESTEN, J.J.T.I. From laboratory to field: uses and limitations of pesticide behaviour models for the soil/plant system. Weed Research, Oxford, v.40, n.1, p.123-138, 2000.
DAM, J.C. Van. Simulation of field-scale water flow and bromide transport in a cracked clay soil. Hydrological Processes, West Sussex, v.14, n.6, p.1.101-1.117, 2000.
DAM, J.C.Van.; GROENENDIJK, P.; HENDRIKS, R.F.A.; KROES, J.G. Advances of modeling water flow in variably saturated soils with SWAP. Vadose Zone Journal, Madison, v.7, n.2, p.640-653, 2008.
DOHERTY, J. Visual PEST (user’s manual). Corinda:Watermark Numerical Computing, 2000. (Paginação irregular).
EMBRAPA. EMPRESA BRASILEIRA DE PESQUISA AGROPECUÁRIA. Sistema brasileiro de classificação de solos. Rio de Janeiro: Ministério da Agricultura, Pecuária e do Abastecimento, 1999. 412 p.
GENUCHTEN, M.Th. Van. A closed-form equation for predicting the hydraulic conductivity of unsaturated soils. Soil Science Society of America Journal, Madison, v.44, n.5, p.892-898, 1980. GENUCHTEN, M.Th. Van; LEIJ, F.J.; YATES, S.R. The RETC code for quantifying the hydraulic functions of unsaturated soils. Riverside: US Salinity Laboratory, 1991. 93 p.
GROENENDIJK, P.; RENAUD, L.V.; ROELSMA, J. Prediction of nitrogen and phosphorous leaching to groundwater and surface waters: Process descriptions of the ANIMO 4.0 model. Wageningen: Alterra, 2005. 114 p. (Alterra-report 983).
KROES, J.G.; DAM, J.C . Reference Manual of SWAP version 3.0.3. Wageningen: Alterra, 2003. 211 p. (Alterra-report 773).
LEISTRA, M.; VAN DER LINDEN, A.M.A.; BOESTEN, J.J.T.I.; TIKTAK, A.; VAN DEN BERG, F. PEARL model for pesticide behaviour and emissions in soil-plant systems; description of the processes in FOCUS PEARL v 1.1.1. Wageningen: Alterra, 2002. 117 p. (Report 013).
LOUZADA, J.A.; CAICEDO, N.; HELFER, F. Condições de drenagem relacionadas ao trânsito de máquinas em solo de várzea (RS-Brasil). Revista Brasileira de Engenharia Agrícola e Ambiental, Campina Grande, v.12, n.1, p.98-106, 2008.
MONTEIRO, A.L.N.; MONTENEGRO, A.A.A.; MONTENEGRO, S.M.G.; SANTOS, F.X. Avaliação de lavagem parcial de sais em neossolo flúvico irrigado, utilizando modelagem computacional. Engenharia Agrícola, Jaboticabal, v.29, n.2, p.207-220, 2009.
SCORZA JÚNIOR, R.P. Modelagem matemática e simulação de sistemas: uma importante ferramenta na pesquisa agropecuária. In: ROSCOE, R.; MERCANTE, F.M.; SALTON, J.C. Dinâmica da matéria orgânica do solo em sistemas conservacionistas. Dourados: Embrapa Agropecuária Oeste, 2006. p.63-74.
SCORZA JÚNIOR, R.P.; BOESTEN, J.J.T.I. Simulation of pesticide leaching in a cracking clay soil with the PEARL model. Pest Management Science, West Sussex, v.61, n.5, p.432-448, 2005. VANCLOOSTER, M.; VEREECKEN, H.; DIELS, J.; HUYSMAN, F.; VERSTRAETE, W.; FEYEN, J. Effect of mobile and immobile water in predicting nitrogen leaching from cropped soils. Modelling Geo-Biosphere Processes, Amsterdam, v.1, n.1, p.23-40, 1992.
VISSOTTO JÚNIOR, D. Modelagem numérica para interações superfície-atmosfera no Estado do Paraná. 2003. 174 f. Dissertação (Mestrado em Métodos Numéricos em Engenharia) -
Universidade Federal do Paraná, Curitiba, 2003.