SOIL SPECTRAL LIBRARY AND ITS USE IN SOIL
CLASSIFICATION
(1)Henrique Bellinaso(2), José Alexandre Melo Demattê(3) & Suzana Araújo Romeiro(4)
SUMMARY
Soil science has sought to develop better techniques for the classification of soils, one of which is the use of remote sensing applications. The use of ground sensors to obtain soil spectral data has enabled the characterization of these data and the advancement of techniques for the quantification of soil attributes. In order to do this, the creation of a soil spectral library is necessary. A spectral library should be representative of the variability of the soils in a region. The objective of this study was to create a spectral library of distinct soils from several agricultural regions of Brazil. Spectral data were collected (using a Fieldspec sensor, 350–2,500 nm) for the horizons of 223 soil profiles from the regions of Matão, Paraguaçu Paulista, Andradina, Ipaussu, Mirandópolis, Piracicaba, São Carlos, Araraquara, Guararapes, Valparaíso (SP); Naviraí, Maracajú, Rio Brilhante, Três Lagoas (MS); Goianésia (GO); and Uberaba and Lagoa da Prata (MG). A Principal Component Analysis (PCA) of the data was then performed and a graphic representation of the spectral curve was created for each profile. The reflectance intensity of the curves was principally influenced by the levels of Fe2O3, clay, organic
matter and the presence of opaque minerals. There was no change in the spectral curves in the horizons of the Latossolos, Nitossolos, and Neossolos Quartzarênicos. Argissolos had superficial horizon curves with the greatest intensity of reflection above 2,200 nm. Cambissolos and Neossolos Litólicos had curves with greater reflectance intensity in poorly developed horizons. Gleisols showed a convex curve in the region of 350–400 nm. The PCA was able to separate different data collection areas according to the region of source material. Principal component one (PC1) was correlated with the intensity of reflectance samples and PC2 with the slope between the visible and infrared samples. The use of the Spectral Library as an indicator of possible soil classes proved to be an important tool in profile classification.
Index terms: remote sensing, principal component analysis, soil classification.
(1) Part of the dissertation submitted by the first author to Escola Superior de Agricultura “Luiz de Queiroz”, University of São
Paulo – USP. Received for publication in April 2009 and accepted in April 2010.
(2) Agr. M.Sc., Coordenadoria de Assistência Técnica Integral (CATI) – Secretary of Agriculture of São Paulo state São Paulo,
USP. E-mail: [email protected]
(3) Professor of Departament of Soil Science of Departamento, Escola Superior de Agricultura “Luiz de Queiroz”, Universidade de
São Paulo. Av. Pádua Dias 11, Caixa Postal 9, CEP 13418-900 Piracicaba (SP). E-mail: [email protected]
(4) Doctorate of PPG in Soils and Plant Nutrition of Escola Superior de Agricultura “Luiz de Queiroz”, USP. E-mail:
RESUMO: BIBLIOTECA ESPECTRAL E SUA APLICAÇÃO EM CLASSIFICAÇÃO DE SOLOS
A ciência do solo tem buscado desenvolver técnicas que contribuam para a melhor utilização e caracterização do solo; entre elas encontra-se a aplicação de técnicas de sensoriamento remoto. O uso de sensores terrestres na obtenção de dados espectrais de solos tem possibilitado a caracterização desses e o avanço de técnicas de quantificação de seus atributos. Para isso, a montagem de uma biblioteca espectral de solos se faz necessária. Uma biblioteca espectral deve ser representativa da variabilidade de solos de uma região. O presente trabalho teve por objetivo criar uma biblioteca espectral de distintos solos de algumas regiões agrícolas do Brasil. Para isso, foram coletados dados espectrais (sensor Fieldspec, 350–2.500 nm) dos horizontes de 233 perfis de solos das regiões de Matão, Paraguaçu Paulista, Andradina, Ipaussu, Mirandópolis, Piracicaba, São Carlos, Araraquara, Guararapes, Valparaíso (SP); Naviraí, Maracaju, Rio Brilhante, Três Lagoas (MS); Goianésia (GO); e Uberaba e Lagoa da Prata (MG). Posteriormente, foi realizada a análise de componentes principais (PCA) dos dados e a representação gráfica das curvas espectrais de cada perfil. A intensidade das curvas foi influenciada principalmente pelos teores de Fe2O3, argila, matéria orgânica e presença de
minerais opacos. Latossolos, Nitossolos e Neossolos Quartzarênicos não apresentaram mudança no comportamento espectral das curvas de seus horizontes. Argissolos mostraram as curvas dos horizontes superficiais com maior intensidade de reflectância após os 2.200 nm. Cambissolos e Neossolos Litólicos apresentaram curvas de maior intensidade de reflectância nos horizontes pouco desenvolvidos. Gleissolos mostraram forma convexa de curva na região dos 350–400 nm. A PCA foi capaz de separar diferentes regiões de coleta de dados em função do material de origem. A componente principal (PC) 1 correlacionou-se com a intensidade de reflectância das amostras, e a PC2, com a inclinação entre a região do visível e a do infravermelho das amostras. O uso da biblioteca espectral como indicativo de possíveis classes de um solo mostrou ser ferramenta importante para a classificação de perfis.
Termos de indexação: sensoriamento remoto, análise de componentes principais, classificação de solos.
INTRODUCTION
The appropriate use of soil in agriculture requires a good understanding of the soil chemical, physical, mineralogical and biological characteristics. Soil science has sought to develop techniques that help to better characterize soil types. In many recent studies, the application of remote sensing techniques has gained much attention, mainly because these techniques have been shown to generate faster and cheaper characterizations, earning them credibility in the scientific community. The application of remote sensing techniques in soil studies began in the 1960s (Bowers & Hanks, 1965) and expanded to various applications, including quick and nondestructive quantification of soil attributes (Janik et al., 1998; Shepherd & Walsh, 2002, Dunn et al., 2002; Viscarra-Rossel, et al., 2006a; Demattê & Nanni, 2006; Brown, et al,. 2006), soil survey and classification (Demattê et al., 2004, Ben-Dor et al., 2008), mineralogical measurements (Madeira-Netto, 1996; Viscarra-Rossel et al., 2006b; Sellito et al., 2009), digital soil mapping (Viscarra-Rossel & McBractney, 2008), precision agriculture (Thomasson et al., 2001, Maleki et al., 2007; Mouazen et al., 2007) and quantification of heavy
metals (Wu Zhao et al., 2005). Thus, a basic requirement for their successful application is the creation of a spectral database, or Spectral Library (SL) (Viscarra-Rossel et al., 2008).
Brown et al. (2006) noted that the soil reflectance in the visible and near infrared region is a function of the soil composition, including organic material, primary minerals, clay minerals, salts and partially crystallized materials. These components are the basic elements of the classes in the North American classification system and the base for soil management interpretations.
Dunn et al. (2002) pointed out that, in order for spectroscopy techniques to be commercially applicable, there must be a wide range of data from different soil types with variations in their organic and inorganic components. Shepherd & Walsh (2002) reported that although existing spectral libraries include geological spectral curves of soils (Clark, 1999), there are not many examples of spectral libraries that contain a high diversity of soils and their physical-chemical information.
various soils of different geographical areas, such as those of Dunn et al. (2002), Shepherd & Walsh (2002) and Brown et al. (2006). According to these authors, there are three basic requirements for developing a spectral library of soil: (a) an SL must contain a sufficient number of samples, representing the variability of soils found in the region to which the SL refers; (b) samples must be carefully sub-sampled, handled, prepared, stored and scanned (anything that happens to the sample will affect its spectral curve); (c) the analytical reference data from the samples to be used in calibrations must be acquired through recognized and trusted analytical procedures.
In this context, this study aimed to create an SL of soils from agricultural areas in Brazil. The objective was to help make quantification models of soil properties and to construct a modal pattern that will aid in the classification and characterization of soils. It is expected that from the data contained in the BE, a user will be able to determine the class, or possible classes, of an unknown soil based on spectral information.
MATERIALS AND METHODS
Soil samples from different soil horizons were collected from the counties of Matão, Paraguaçu Paulista, Andradina, Ipaussu, Mirandópolis, Piracicaba, São Carlos, Araraquara, Guararapes, Valparaíso (SP); Naviraí, Maracajú, Rio Brilhante, Três Lagoas (MS); Goianésia (GO), Uberaba and Lagoa da Prata (MG) (Figure 1). Soil samples from 233 soil profiles were collected. All profiles were described morphologically (Lemos & Santos, 1996) and
classified up to the 4th categorical level (Embrapa,
2006).
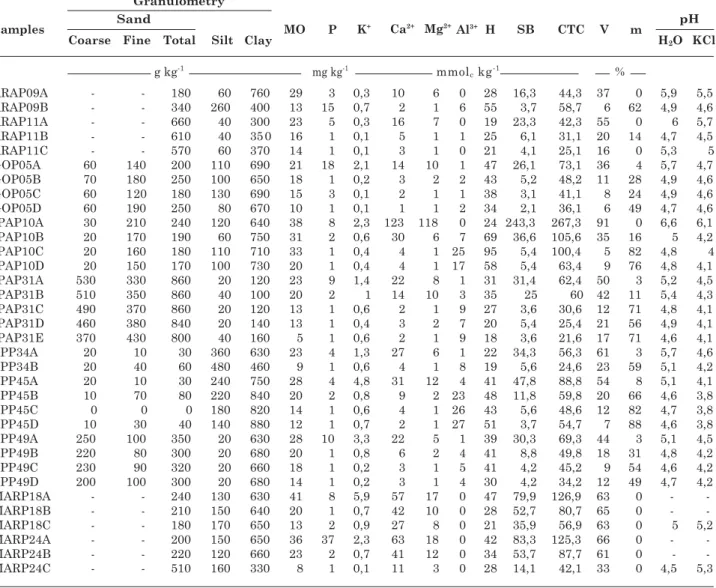
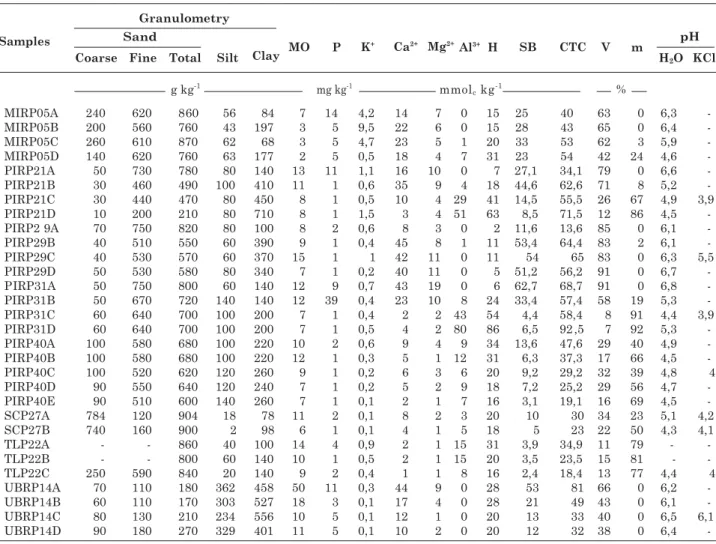
The samples were analyzed for particle size according to the methods of Camargo et al. (1986) and for fertility using the methods of Raij et al. (2001). The analysis provided the necessary data for the calculation of the sum of bases (SB), cation exchange capacity (CEC), base saturation (V %) and Al
saturation (m %). The total Fe (Fe2O3), silica (SiO2),
Ti (TiO2) and Mn (MnO) were determined by sulfuric
acid digestion (Camargo et al., 1986).
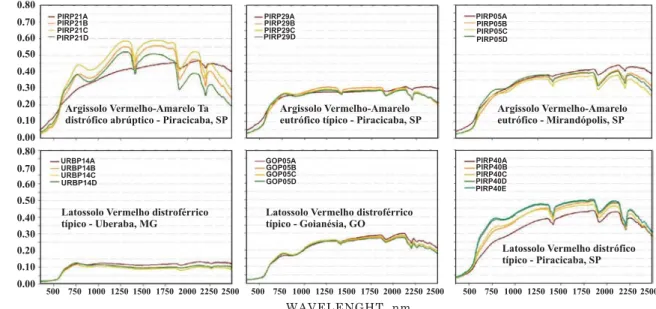
The spectral data were obtained in the laboratory with the FieldSpec Pro: Analytical Spectral Devices, Boulder, Colorado spectroradiometer using 350– 2,500 nm wavelengths (Hatchell, 1999). For the reflectance data collection, the samples were dried in an oven at 45 °C for 24 h (Henderson et al., 1992), ground, processed through a sieve (2 mm mesh) and placed in Petri dishes. The reflectance of each sample was calculated by taking the average of 100 scans performed by the sensor. The light capture device in the equipment (fiber optic cable input) was placed in a vertical position 8 cm from the sample. The light source used was a 50 W halogen lamp with no collimated beam to the target plane, positioned 35 cm from the sample with a zenith angle of 30 degrees. A white plate of barium sulfate was used as the reference standard, with a standard of 100 % reflectance. Graphs for each profile were generated from the spectral data (Figures 2-4), where each graph contains the spectral curves of the horizons of the respective profile.
In order to reduce the dimensionality of information and the variability of the spectral data, a principal components analysis (PCA) was performed using the program The Unscrambler 9.7. In order to do this, spectral data were preprocessed, then converted into absorbance and centered on the mean. Principal component analysis (PCA) is one of the most common methods employed in the analysis of information (Brown, 1995) and is mainly used for its ability to compress data based on the existence of correlation between different measured variables.
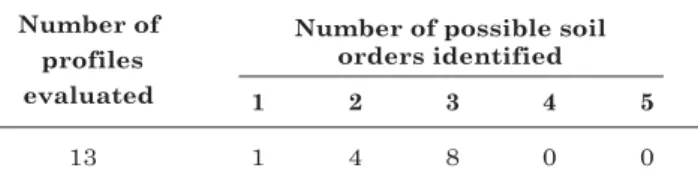
Graphs of the spectral curves of 13 soil profiles (class unknown) were descriptively compared according to the contents of the SL. For each profile, the number of possible orders of soil was established based on the similarity between the spectral profile and the SL profiles. The number of possible orders
(only until the 1st categorical level) for each soil was
indicated. Each profile shows the number of possible
orders (until the 1st categorical level) from soils. This
methodology proposes a comparison between the information from the spectral curves of the profile (intensity, shape, slope, presence of features and behavioral variation among curves from the same profile) and the information contained in the SL. The methodology was named “Soil classification by the method of Simplified Descriptive Comparison” (SDC).
RESULTS AND DISCUSSION
Characteristic features such as 2:1 clay minerals (1400, 1,900 and 2,200 nm) (Grove et al., 1992; Demattê & Garcia, 1999a; Clark, 1999, Goetz et al., 2009), kaolinite (2,200 nm), Fe oxides, hematite and goethite (concavity in the 850–900 nm range) (Epiphanio et al., 1992; Demattê & Garcia, 1999a, Stoner et al., 1980), specific goethite (450–480 nm) (Dalmolin, 2002) and gibbsite (2,265 nm) (Madeira-Netto, 1996) were observed in the spectral curves of the various profiles.
In general, Latossolos had spectral behavior similar to the curves of their horizons (Figure 2).
Higher levels of clay and Fe2O3 were found in the
curves of the profiles with a lower intensity of reflectance and the presence of organic matter (OM) in surface horizons led to a reduction in the intensity of the curve, mainly in the 350–1,350 nm range, which agrees with Mathews et al. (1973). Nitossolos showed spectral behavior similar to Latossolos. In the majority of the profiles, Latossolos indicated the presence of gibbsite (2,265 nm) but Nitossolos did not. The clearest presence of gibbsite in Latossolos was due to the fact that these soils are more weathered than Nitossolos and therefore contain a larger amount of Fe and Al
oxides and a higher loss of SiO2 (Boul et al., 1997).
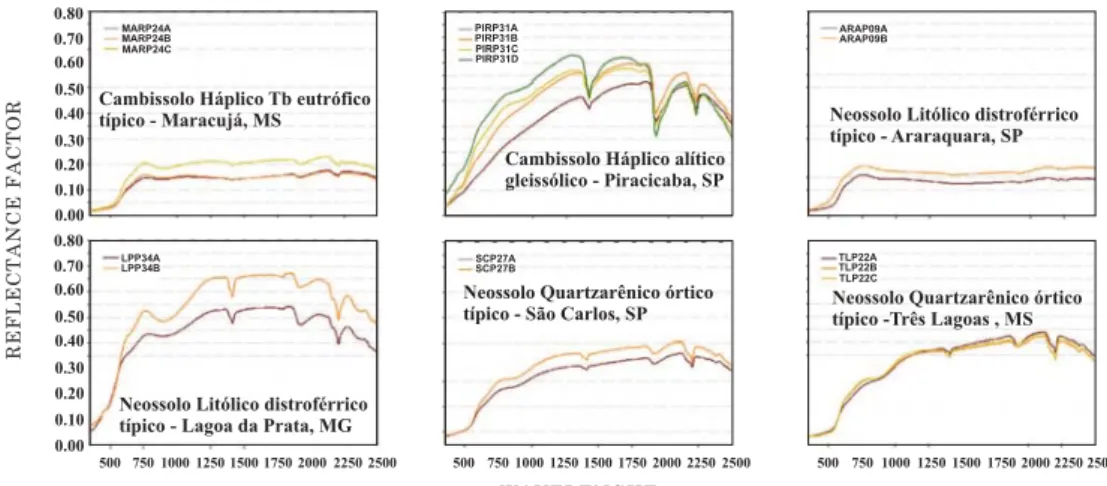
The Argissolos exhibited a characteristic pattern, the reflectance intensity of the surface spectral curves, in the spectral range of 2,250 to 2,500 nm (Horizons A and E), which is higher than that of the sub-surface curves (Bt horizon) (Figure 2). Cambissolos and Neossolos Litólicos showed a behavioral pattern that has already been reported in other studies (Demattê et al., 2003, Clemente et al., 2000). The sub-surface horizons of low pedogenic development (Horizons B incipiente and C) show a greater intensity of reflectance than the surface horizons. This is explained
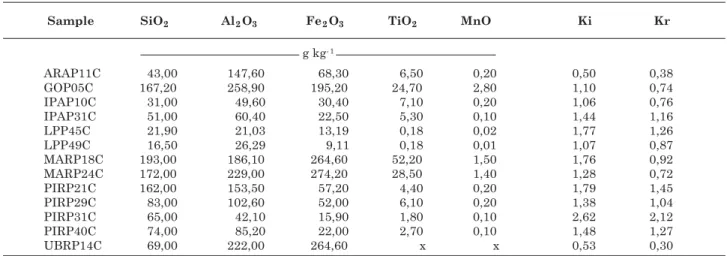
by the greater amount of silt (Table 1) in these horizons, as was also shown by Demattê et al. (2000). Furthermore, Grove et al. (1992) reported that the presence of feldspars and 2:1 clay minerals contribute to the greater intensity of reflectance (Figure 4).
Gleissolos showed the typical features of hydromorphic horizons (Figure 3), such as convexity in the 350–450 nm range, the absence of the concavity of iron oxides in the 850–900 nm range, and change in the slope of the curve in the 800 nm absorbance, in agreement with Epiphanio et al. (1992).
Neossolos Quartizarênicos showed high values of reflectance intensity and an upward slope in the curves due to high sand content and the presence of quartz in this fraction (White et al., 1997) (Figure 4). Neossolos Quartzarênicos and sandy loam Latossolos
(with clay content less than 250 g kg-1) had a similar
spectral behavior. This is because differentiation of the classes in this case is a function of a clay content, which is less than (Neossolos Quartzarênicos) or higher
than (Latossolos) 150 g kg-1 (Embrapa, 2006).
The Piracicaba region (SP) has a high variability of soils (Figure 5) originating from different parent materials. This variability was reflected in the high variation of the reflectance intensities of the spectral curves, with soils having an average reflectance intensity of 0.2 and others having an intensity of 0.5. The variation in intensity is due to a high variation
in clay and different Fe2O3 profiles. Horizons with
higher sand content had higher intensities due to the high reflectance of quartz (White et al., 1997). In general, soils derived from volcanic rocks show lower reflectance intensity, while soils derived from sedimentary rocks with some amount of iron have intermediate reflectance intensities. Soils derived from sedimentary rocks with low amounts of Fe have high values of reflectance intensity.
The regions of Araraquara, São Carlos and Matão (SP) showed lower soil variability, with curves ranging from medium to low intensity. The variation of intensity was due to the greater or lesser presence
of Fe2O3. Soils with greater amounts of Fe2O3
presented lower reflectance intensity. Another identifying characteristic of the spectral curves was the presence of gibbsite (2,265 nm) (Madeira-Netto, 1996) in the majority of the soils, with this feature being sharper in Latossolos than in Nitossolos. Kaolinite (2,200 nm), Fe oxides, goethite and hematite (concavity in the region of 850–900 nm) and specifically goethite (450–480 nm) were also observed.
The Andradina, Mirandópolis, Valparaiso and Guararapes (SP) regions, which also had lower soil variability, had curves varying from medium to high
reflectance intensity. The regions are located in the western plateau of São Paulo and the main parent soil material is sandstone. This leads to the predominance of soils with low clay and higher sand content, which explains the higher values of reflectance intensity.
The Ipaussu region (SP) was characterized by soils
varying from medium to high Fe2O3 content, resulting
in curves from medium to low intensities. In general,
soils with higher contents of Fe2O3 had lower
reflectance intensity.
The regions of Maracajú and Rio Brilhante (MS) had soils with low reflectance intensity spectral behavior. This occurs because of high clay content, originating from low levels of sand, and high
concentrations of Fe2O3.
The Três Lagoas region (MS) had soil spectral behavior similar to soils from Andradina, Mirandópolis, Valparaiso and Guararapes (SP). This region is geographically close to the other locations, which are separated by the Rio Paraná. Similar to the other regions cited, the parent soil material is sandstone.
The region of Goianésia (GO) had soils with intermediate reflectance intensity. Although the
content of Fe2O3 in these soils is between medium
and high, the soils showed no spectral curves with low intensity (less than 0.25). One possible explanation is that even though these soils contain high levels of
Fe2O3, they have low amounts of opaque minerals,
such as magnetite and ilmenite. Most soils showed features of gibbsite (2,265 nm), Fe oxides, hematite and goethite (concavity in the 850–900 nm range), and kaolinite (2,200 nm). The presence of specific features of goethite (450–480 nm) and 2:1 clay minerals (1,400, 1,900 and 2,200 nm) was not verified because these are highly weathered soils.
The Naviraí region (MS) had soils with high spectral reflectance and an ascendant slope aspect, similar to the spectral behavior of soils found in the region of
Figure 5. Principal component analysis from soil spectral data in the different regions evaluated, data graph and region by region separation Figure 3. Spectral curves from soil profiles: Latossolos, Nitossolos and Gleissolos, representing the Soil
Spectral Library.
Três Lagoas (MS). The high sand content explains the high intensity of reflectance and upward slope of the curves. In the region of Três Lagoas (MS), the sandy loam Latossolos also showed similar spectral behavior to the Neossolos quartzarênicos.
The soils of the Uberaba (MG) region had the lowest intensity spectral curves, most of them with very low
reflectance intensity due to high levels of Fe2O3 and
clay. These high levels of Fe2O3 caused smoothing of
most features. Unlike what was observed in most soils from other regions with similar characteristics, surface soil horizons showed higher intensity curves than those from the sub-surface. This occurs because the organic matter has a greater value of reflectance intensity than opaque minerals such as magnetite (Madeira Netto & Baptista, 2000). Thus, the soils of the region have such a high amount of opaque minerals and the addition of organic matter causes an increase in reflectance intensity. This information confirms results found by Fontes and Carvalho Junior (2005). The Lagoa da Prata (MG) region had the greatest intensity of soil reflectance. However, it was also the
region that had soils with higher clay and lower Fe2O3
concentrations, due to the predominant source materials being claystone and siltstone. The absence of opaque minerals enables the high intensity of reflectance, although the intensity of reflectance is medium-high in all profiles, indicating that higher levels of clay have a lower intensity of reflectance and those with higher levels of the silt have a higher intensity of reflectance, as shown by Demattê et al. (2000) and Mathews et al. (1973). The region has soil surface horizons with high organic matter content, resulting in a lower intensity of spectral reflectance and smoothing the concave feature of iron oxides (850– 900 nm). In general, the Latossolos had features of gibbsite (2,265 nm) while Nitossolos, Cambissolos and Neossolos Litólicos did not. This same observation was noted by Sans (1973), in studying the mineralogy of soils in the region. All soils showed clear features of goethite (450–480 nm).
It was evident that in the Lagoa da Prata (MG) region, where soils are more pedogenically developed (weathered), the spectral curves had a lower intensity
of reflectance. In other words, Cambissolos have a higher reflectance intensity than Nitossolos, which have a higher reflectance intensity than Latossolos, which can be explained by the decrease in the amounts of silt and increased presence of 2:1 clay minerals (Mathews et al., 1973; Grove et al., 1992).
The first and the second principal components (PC1 and PC2) were able to explain over 95 % of the spectral variability of soils. The PC1 (Figure 5) showed a correlation with the intensity of reflectance of the samples, which agrees with that shown by Galvão et al. (2001). Due to the processing of spectral data for the PCA (change in absorbance), higher values of PC1 indicate a lower intensity reflectance of the sample. The data from the Uberaba (MG) region had the lowest reflectance intensities and the highest values of the PC1 score, while the data from the Lagoa da Prata (MG) region had the highest reflectance intensity and lowest values of PC1.
As reported in the characterization of the spectral curves of the profiles of the Andradina, Valparaíso, Guararapes, Mirandópolis (SP) and Três Lagoas (MS) regions, there were similarities between the soil classes and their spectral behaviors. These same regions were superimposed on the graph between PC1 and PC2 (Figure 5).
The regions with soils of higher levels of Fe2O3
also overlapped on the charts, because these soils generally appeared to have volcanic rock source material. This was verified everywhere except for Goianésia (GO), which, as reported in its spectral characterization, had soils with high contents of
Fe2O3, but a distinct position on the PC1 x PC2 chart.
The Goianésia region (GO) is at a different altitude than the other regions with soil containing a high
amount of Fe2O3.
The Lagoa da Prata (MG) region showed a different spectral characterization than the other regions and was also grouped in a different position from other regions.
The Piracicaba region (SP) showed a high variability of soils of different spectral behaviors, related to the location of this transitional region between the São Paulo depression and western plateau, generating a great variety of materials from sources such as soil basalts, diabase, shale, siltstones, mudstones (argillite) and sandstones. This great variability is reproduced in the soil and can be viewed from the principal component analysis (Figure 5). Henderson et al. (1992) and Demattê & Garcia (1999b) already indicated that spectral data should be evaluated by region, which is consistent with this study.
It was evident that regionalization through principal component analysis showed grouping by similarity of soils derived from similar parent materials. For example, the Três Lagoas (MS), Mirandópolis and Guararapes (SP) regions primarily contained sandstone source material and occupied a similar position in the charts, while the Uberaba (MG), Maracajú and Rio Brilhante (MS) regions had soils formed from volcanic rocks and also occupied similar positions in the graphs (Figure 5). This further demonstrated the differentiation of regions with similar geology but different altitudes.
A simple descriptive comparison of the spectral curves of a soil profile with the graphics of the Spectral Library demonstrated that the Spectral Library serves as an important auxiliary tool in classification. Table 3 demonstrates that in comparing the curves of an unclassified profile with those of the Spectral Library, the Spectral Library did not provide more than three possible orders. For one of the profiles, the Library showed only one order, whereas for profiles 4 and 8, the Spectral Library gave two and three possible orders, respectively. Clearly, the descriptive comparison is not able to pinpoint a precise rating, but is a tool with the ability to reduce possible choices, reducing the time needed for soil surveys. Since this technique is fast, inexpensive and non-destructive, it
can increase the number of samples collected in an area, improving the quality of soil maps through more precise delimitation of mapping units. If increased numbers of samples are not used, this technique can provide a cost reduction by ensuring that not all samples need to be sent for laboratory testing.
CONCLUSIONS
The Spectral Library was able to support the classification of possible soil orders.
1. The soil reflectance intensity was influenced by
the content of Fe2O3, sand, clay, silt, organic matter
and the presence of opaque minerals.
2. Organic matter promoted the reduction of reflectance intensity and softening of the features.
3. The increase in the levels of Fe2O3 in soils
promoted a decrease in the reflectance.
4. Horizons with lesser degrees of pedogenic development (incipient B and C) have spectral curves with higher reflectance intensity.
5. The surface layers of Argissolos presented higher levels of reflectance intensity than the others, with wavelengths greater than 2,200 nm.
6. The internal comparison of the spectral curves of the horizons of Latossolos, Nitossolos and Neossolos Quatzarênicos display similar behavior.
7. The principal component analysis grouped soils originating from similar parent materials, with some differentiation caused by the altitude.
ACKNOWLEDGEMENTS
The authors thank the Fundação de Amparo a Pesquisa do Estado de São Paulo (Bolsa Auxílio Pesquisa 07/54976-8), for the financial support, the Coordenação de Aperfeiçoamento de Pessoal de Nível Superior (CAPES) for the scholarship of the first author, and the National Counsel of Technological and Scientific Development (CNPq) for the research financial support of the second author.
LITERATURE CITED
BEN DOR, E.; HELLER, D. & CHUDNOVSKY, A. A novel method of classying profiles in the field using optical means. Soil Sci. Soc. Am. J., 72:1113-1123, 2008. BOUL, S.W.; HOLE, F.D.; McCRACKEN, R.J. & SOUTHARD,
R.J. Soil genesis and classification. 4.ed. Ames, Iowa State University Press, 1997. 527p.
BOWERS, S.A. & HANKS, R.J. Reflectance of radiant energy from soils. Soil Sci., 100:130-138, 1965.
BROWN, S.D. Chemical systems under indirect observation: Latent properties and chemometrics. Appl. Spectrosc., 12:14-31, 1995.
BROWN, D.J.; SHEPHERD, K.D.; WALSH, M.G.; MAYS, M.D. & REINSCH., T.G. Global soil characterization with VNIR diffuse reflectance spectroscopy. Geoderma, 132:273-290, 2006.
CAMARGO, A.O.; MONIZ, A.C.; JORGE, J.A. & VALADARES, J.M. Métodos de análise química, mineralógica e física de solos do IAC. Campinas, Instituto Agronômico de Campinas, 1986. 94p. (Boletim Técnico, 106)
CLARK, R.N. Spectroscopy of rocks and minerals, and principles of spectroscopy In: RENCZ, A.N., ed. Manual of remote sensing. New York, John Wiley, 1999. p.3-58. CLEMENTE, C.A.; DEMATTÊ, J.A.M.; MAFRA, A.L. & BENTIVENHA, S.R.P. Reflectância espectral e mineralogia de materiais formados sobre diabásio. Sci. Agríc., 57:159-168, 2000.
DALMOLIM, R.S.D. Matéria orgânica e características físicas, químicas, mineralógicas e espectrais de Latossolos de diferentes ambientes. Porto Alegre, Universidade Federal do Rio Grande do Sul, 2002. 151p. (Tese de Doutorado) DEMATTÊ, J.A.M. & GARCIA, G.J. Alteration of soil properties
through a weathering sequence as evaluated by spectral reflectance. Soil Sci. Am. J., 63:327-342, 1999a.
DEMATTÊ, J.A.M. & GARCIA, G.J. Avaliação da atributos de Latossolo Bruno e de Terra Bruna Estruturada da região de Guarapuava, Paraná, por meio de sua energia refletida. R. Bras. Ci. Solo, 23:343-355, 1999b.
DEMATTÊ, J.A.M.; CAMPOS, R.C. & ALVES, M.C. Avaliação espectral de solos desenvolvidos em uma topossequência de diabásio e folhelho da região de Piracicaba-SP. Pesq. Agropec. Bras., 35:2447-2460, 2000.
DEMATTÊ, J.A.M.; FIORIO, P.R.; CLEMENTE, C. & NANNI, M.R. Sensoriamento remoto na avaliação da evolução intempérica de solos desenvolvidos sobre granodiorito e gnaisse porfirítico. Magistra, 15:33-43, 2003.
DEMATTÊ, J.A.M.; CAMPOS, R.C.; ALVES, M.C.; FIORIO, P.R. & NANNI, M.R. Visible-NIR reflectance: A new approach on soil evaluation. Geoderma, 121:95-112, 2004. DUNN, B.W.; BEECHER, H.G.; BATTEN, G.D. & CIAVARELLA, S. The potencial of near-infrared reflectance spectroscopy for soil analysis – a case study from the Riverine Plain of south-eastern Australia. Austr. J. Exper. Agric., 42:607-614, 2002.
EMPRESA BRASILEIRA DE PESQUISA AGROPECUÁRIA -EMBRAPA. Sistema brasileiro de classificação de solos. 2.ed. Rio de Janeiro, Embrapa Solos, 2006. 306p. EPIPHANIO, J.C.N.; FORMAGGIO, A.R.; VALERIANO, M. &
OLIVEIRA, J.B. Comportamento espectral de solos do Estado de São Paulo. São José dos Campos, INPE, 1992. 131p.
FONTES, M.P.F. & CARVALHO JUNIOR, I.A. Color attributes and mineralogical characteristics, evaluated by radiometry, of higly weathered tropical soils. Soil Sci. Soc. Am. J., 69:1162-1172, 2005.
GALVÃO, L.S.; PIZARRO, M.A. & EPIPHANIO, J.C.N. Variations in reflectance of tropical soils: Spectral-chemical compositions relationships from AVIRIS data. Remote Sens. Environ., 75:245-255, 2001.
GOETZ, A.F.H.; CURTISS, B. & SHILEY, D.A. Rapid gangue mineral concentration measurament over conveyors by NIR reflectance spectroscopy. Miner. Eng., 22:490-499, 2009.
GROVE, C.I.; HOOK, S.J. & TAYLOR, E.D. Laboratory reflectance of 160 minerals, 0.4 to 2.5 micrometers. Passadena, National Aeronautics and Space Administration, 1992. 355p.
HATCHELL, D.C., ed. Analytical spectral devices. 3.ed. Boulder, Analytical Spectral Devices, 1999. 140p.
HENDERSON, T.L.; BAUMGARDNER, M.F.; FRANZMEIER, D.P.; STOTT, D.E. & COSTER, D.C. High dimensional reflectance analysis of soil organic matter. Soil Sci. Soc. Am. J., 56:865-872, 1992.
JANIK, L.J.; MERRY, R.H. & SKJEMSTAD, J.O. Can mid infrared diffuse reflectance analysis replace soil extractions. Austr. J. Exper. Agric., 38:681-696, 1998. LEMOS, R.C. & SANTOS, R.D. Manual de descrição e coleta
de solo no campo. Campinas, Sociedade Brasileira de Ciência do Solo, 1996. 84p.
MADEIRA NETTO, J.S. Spectral reflectance properties of soils. Photo Interpretation, 34:59-70, 1996.
MADEIRA NETTO, J.S. & BAPTSTA, G.M.M. Reflectância espectral de solos. Planaltina, Embrapa Cerrados, 2000. 55p.
MALEKI, M.R.; MOUAZEN, A.M.; RAMON, H. & BAERDEMAEKER, J. Optimisation of soil VIS–NIR sensor-based variable rate application system of soil phosphorus. Soil Tillage Res., 94:239-250, 2007. MATHEWS, H.L; CUNNINGHAM, R.L. & PETERSEN, G.W.
Spectral reflectance of selected Pennsylvania soils. Soil Sci. Soc. Am. J., 37:421-424, 1973.
MOUAZEN, A.M.; MALEKI, M.R.; BAERDEMAEKER, J. & RAMON, H. On-line measurement of some selected soil propertiesusing a VIS–NIR sensor. Soil Tillage Res., 93:13-27, 2007.
NANNI, M.R. & DEMATTÊ, J.A.M. Spectral reflectance methodology in comparison to traditional soil analysis. Soil Sci. Soc. Am. J.,70:393-407, 2006.
RAIJ, B.van.; ANDRADE, J.C.; CANTARELLA, H. & QUAGGIO, J.A. Análise química para avaliação de solos tropicais. Campinas, Instituto Agronômico de Campinas, 2001. 285p.
SANS, L.M.A. Classificação e mineralogia de solos da região de Sete lagoas - MG. Piracicaba, Escola Superior de Agricultura “Luiz de Queiroz”, 1973. 151p. (Tese de Mestrado)
SELLITTO V.M.; FERNANDES R.B.A.; BARRÓN, V. & COLOMBO, C. Comparing two different spectroscopic techniques for the characterization of soil iron oxides: Diffuse versus bi-directional reflectance. Geoderma, 149:2-9, 2009.
SHEPHERD, K.D. & WALSH, M.G. Development of reflectance spectral libraries for characterization of soil properties. Soil Sci. Soc. Am. J., 66:988-998, 2002. STONER, E.R.; BAUMGARDNER, M.F.; BIEHL, L.L. &
ROBINSON, B.F. Atlas of soil reflectance properties. West Lafayette, Purdue University, 1980. 75p.
THOMASSON, J.A.; SUI, R.; COX, M.S. & Al-RAJEHY. Soil reflectance sensing for determining soil properties in precision agriculture. Trans. Am. Soc. Agron. Eng., 44:1445-1453, 2001.
VISCARRA ROSSEL, R.A.; WALWORT, D.J.J.; McBRATNEY, A.B.; JANIK, L.J. & SKJESMSTAD, J.O. Visible near infrared or combined diffuse reflectance spectroscopy for simultaneous assessment of various soil properties. Geoderma, 131:59-75, 2006a.
VISCARRA ROSSEL, R.A.; McGLYNN, R.N. & McBRATNEY, A.B. Determining the composition of mineral-organic mixes using UV–vis-NIR diffuse reflectance spectroscopy, Geoderma, 137:70-82, 2006b.
VISCARRA ROSSEL, R.A.; JEON, Y.S.; ODEH, I.O.A. & McBRATNEY, A.B. Using a legacy soil sample to develop a mid-IR spectral library. Austr. J. Soil Res., 46:1-16, 2008. VISCARRA ROSSEL, R.A. & McBRATNEY, A.B. Diffuse reflectance spectroscopy as a tool for digital soil mapping. In: HARTEMINK, A.E.; McBRATNEY, A.B. & MENDONÇA-SANTOS, L., eds. Digital soil mapping with limited data. Amsterdam, Elsevier Science, 2008. (Developments in Soil Science Series)
WHITE, K.; WALDEN, J.; DRAKE, N.; ECKARDT, F. & SETTLE, J. Mapping the iron oxide content of dune sands, Namib Sand Sea, Namibia, using Landsat Thematic Mapper Data. Remote Sens. Environ., 62:30-39, 1997. ZHAO WU, Y.Z.; CHEN, J.; FENG, J.; TIAN, Q.J. & MIN WU,