* Corresponding author:
E-mail: [email protected]
Received: December 26, 2017
Approved: May 4, 2018
How to cite: Campbell PMM, Fernandes Filho EI, Francelino MR, Demattê JAM, Pereira MG, Guimarães CCB, Pinto LASR. Digital soil mapping of soil properties in the “Mar de Morros” environment using spectral data. Rev Bras Cienc Solo. 2018;42:e0170413.
https://doi.org/10.1590/18069657rbcs20170413
Copyright: This is an open-access article distributed under the terms of the Creative Commons Attribution License, which permits unrestricted use, distribution, and reproduction in any medium, provided that the original author and source are credited.
Digital Soil Mapping of Soil
Properties in the “Mar de Morros”
Environment Using Spectral Data
Patrícia Morais da Matta Campbell(1)*
, Elpídio Inácio Fernandes Filho(2)
, Márcio Rocha Francelino(2)
, José Alexandre Melo Demattê(3)
, Marcos Gervasio Pereira(4)
, Clécia Cristina Barbosa Guimarães(5)
and Luiz Alberto da Silva Rodrigues Pinto(6)
(1)
Universidade Federal Rural do Rio de Janeiro, Instituto de Florestas, Departamento de Silvicultura, Programa de Pós-Graduação em Ciências Ambientais e Florestais, Seropédica, Rio de Janeiro, Brasil. (2)
Universidade Federal de Viçosa, Departamento de Solos, Viçosa, Minas Gerais, Brasil.
(3) Universidade de São Paulo, Escola Superior de Agricultura “Luiz de Queiroz”, Departamento de Ciência do Solo, Piracicaba, São Paulo, Brasil.
(4) Universidade Federal Rural do Rio de Janeiro, Instituto de Agronomia, Departamento de Solos, Seropédica, Rio de Janeiro, Brasil.
(5) Universidade de São Paulo, Escola Superior de Agricultura “Luiz de Queiroz”, Departamento de Ciência do Solo, Programa de Pós-Graduação em Solos e Nutrição de Plantas, Piracicaba, São Paulo, Brasil.
(6) Universidade Federal Rural do Rio de Janeiro, Curso de Agronomia, Seropédica, Rio de Janeiro, Brasil.
ABSTRACT: Quantification of soil properties is essential for better understanding of the
environment and better soil management. The conventional techniques of laboratory analysis are sometimes costly and detrimental to the environment. Thus, development of new techniques for soil analysis that do not generate residues, such as spectroscopy, is increasingly necessary as a viable way to estimate a wide range of soil properties. The objective of this study was to predict the levels of organic carbon (OC), clay, and extractable phosphorus (P), from the spectral responses of soil samples in the visible and near infrared
(Vis-NIR), medium infrared (MIR), and Vis-NIR-MIR using different preprocessing methods combined with five prediction models. Soil samples were collected in Iconha, Espírito Santo
State, Brazil, in the Ribeirão Inhaúma basin. A total of 184 samples were collected from 92 sites at two depths (0.00-0.10 and 0.10-0.30 m). Physical, chemical, and spectral analyses were performed according to routine soil laboratory methods. Random selection was made
of 70 % of total samples for training and 30 % for validation of the models. The coefficient
of determination (R2) and root mean square error (RMSE) were calculated in order to assess model performance. The standardized indexes of prediction error RPD and RPIQ were also calculated. For clay and OC, the best R2 was found in the MIR spectrum, at 0.69 and 0.65, respectively, and for P, it was 0.57 in Vis-NIR. The MSC (Multiplicative Scatter Correction), CR
(Continuum removal), and SNV (Standard Normal Variate) preprocesses were most efficient for
predicting clay, OC, and P, respectively, while the PLSR - Partial Least Squares Regression (OC and P) and SVM -Support Vector Machine (clay) gave the best predictions and are therefore
recommended for modeling these properties in the study area. The models identified in this
study can be used to discriminate soils according to a critical test value for clay, OC, and P.
INTRODUCTION
Pedometry uses modern techniques of mining and data analysis to quantify soil properties,
and it is one of the most promising fields of soil property prediction from its relationship with spectral responses in different reflectance ranges (Adeline et al., 2017; Nouri et al., 2017). Conventional laboratory analyses used for quantification of soil properties are
costly (Bogrekci and Lee, 2005; Viscarra Rossel et al., 2006; Bashagaluke et al., 2015) and
likely to have environmental effects because of the chemical reagents they use (Nanni
and Demattê, 2006). Furthermore, the time from sampling to acquisition of results is long (Bashagaluke et al., 2015).
In recent years, reflectance spectroscopy, both in near-infrared (NIR) and
medium-infrared (MIR) spectra, in addition to visible bands, has drawn attention for its potential
use in non-destructive, fast, and efficient methods for quantifying soil properties
(Bashagaluke et al., 2015). In the study conducted by Mohamed et al. (2018), the
NIR was the most efficient systematic strategy for characterizing and identifying soil
properties, whereas Abdi et al. (2016) found visible spectroscopy (Vis-NIR) to be the
most efficient strategy.
Quantitative analysis based on NIR or MIR spectra requires the development of calibrations that relate spectral information to known analyte contents (Reeves III and Smith, 2009).
The precise quantification of different soil properties is performed using large libraries,
with many samples (Brown et al., 2006; Fernández-Pierna and Dardenne, 2008; Vasques et al., 2008; Genot et al., 2011; Viscarra Rossel and Webster, 2012), and a way to deal with this large number of covariate samples, such as infrared spectra, is the selection of those with the highest predictive power (Minasny and McBratney, 2008).
Thus, preprocessing strategies are incorporated as a necessary step prior to prediction calibration to improve extraction of useful information from both additive and multiplicative
effects superimposed on reflection spectra (Peng et al., 2014). That way, the efficiency
of the mathematical models that are used to link the generated spectra (predictor variables) to the soil properties (response variables) is increased (Nouri et al., 2017). These include the Support Vector Machine (SVM) (Stevens et al., 2010), Partial Least
Squares Regression (PLSR) (McCarty et al., 2002), Random Forest (RF), Artificial Neural
Networks (ANN), and Gaussian Process Regression (GPR).
The PLSR method is probably the most commonly used multivariate statistical technique for spectral calibration and prediction of soil properties (Nouri et al., 2017). This technique reduces the predictors for a set with a smaller number of components that are not correlated with each other, and then uses these to perform least squares regression. In addition, the SVM is a computational technique based on pattern recognition, so it determines decision limits where optimal separation occurs between classes with minimization of error (Nascimento et al., 2009).
The RF method was developed by Breiman (2001) for classification and regression. In this
technique, decision trees are formed using an initial random set, that is, each tree is generated from the values of a random vector. It is robust and insensitive to noise. The ANNs are usually organized in layers; they are constituted by a series of interconnected nodes that contain an activation function. The patterns are provided to the network through the input layer, which communicates with one or more hidden layers where actual processing is done through a weighted connection system; most ANNs contain
some form of learning rule that modifies the weights of the connections according to the
In preprocessing strategies, smoothing is a simple moving mean of spectral data using a convolution function (Stevens et al., 2013). The preprocessing of normalization refers to the creation of displaced and staggered versions of spectral data, where these
normalized values eliminate scattering effects (Rinnan et al., 2009). The Savitzky-Golay
derivatization algorithm (Savitzky and Golay, 1964) requires the selection of smoothing
points (filter width), polynomial orders, and derivative orders. The CR technique proposed
by Clark and Roush (Clark and Roush, 1984) consists of removing continuous spectral
characteristics and is often used to isolate specific absorption characteristics present
in the spectrum to minimize noise. The continuum is represented by a mathematical
function used to separate and highlight specific absorption bands of the reflectance
spectrum (Mutanga et al., 2005).
Based on the hypothesis that it is possible to predict soil properties from their spectra, this study aimed to predict the organic carbon (OC), clay, and extractable
P contents from the MIR, Vis-NIR, and Vis-NIR-MIR using different preprocessing
methods (Continuum Removal – CR; Absorbance – ABS; Savitzky Golay Derivative – SGD; Standard Normal Variate – SNV; and Multiplicative Scatter Correction – MSC)
combined with five predictive models (Partial Least Squares Regression – PLSR; Artificial Neural Network – ANN; Random Forest – RF; Gaussian Process Regression –
GPR; and Support Vector Machine – SVM).
MATERIALS AND METHODS
Soil samples were collected in the Ribeirão Inhaúma basin, in Iconha, ES, Brazil, near coordinates 21° 10’ 58.82” S and 41° 00’ 08.87” W, with an area of 2,403.9 ha. According
to the Köppen classification system, the climate of the study area is Aw, and its relief is
mountainous with steep areas. We used 184 samples, obtained at 92 sites at two depths (0.00-0.10 and 0.10-0.30 m). The sampling sites were determined using a conditioned
Latin hypercube method, with consideration given to access because of difficulties of movement in the area due to topographic relief. A 200-m buffer along the roads was
determined. At each point, coordinates were recorded using a dual frequency GNSS
receiver (L1, L2), whose data were processed in the Leica Geo Office 8.0 program. The base was adjusted from the fixed station of the IBGE in Vitória, ES, Brazil.
The samples were air dried, crushed, and sieved through a 2-mm mesh to quantify the clay,
extractable P, and OC contents. Clay was quantified by the pipette method, extractable
P by Mehlich-1, and organic carbon by Walkley and Black (Donagema et al., 2011).
In spectral analysis, about 5 g of sieved soil of less than 2 mm was used for bidirectional
reflectance (350 to 2,500 nm); and for diffuse reflectance (medium infrared – 2,500 to
25,000 nm), another 5 g were processed, which was milled, homogenized, and sieved to 0.149 mm (100 mesh). To obtain the bidirectional data in the Vis-NIR bands, the samples were packed in petri dishes and leveling was performed to reduce the roughness of the surface. For each sample, 300 readings were performed automatically by the sensor, with
100 readings every 90°. The final value considered was the mean of three measurements.
The calibration of the sensor was done using a Spectralon (barium sulfate) plate, with
reflectance of 100 %. Calibration was repeated every 20 minutes.
The FieldSpec Pro (Analytical Spectral Devices, Boulder, Colorado) sensor (Hatchell, 1999) was used, whose resolution is 2 nm for the bands of 1,100 to 2,500 nm, and 1 nm for the other wavelengths. It was positioned vertically at 8 cm from the sample, with
an 18° field of view. Two 50 W halogen lamps were used as a source of illumination,
which were positioned 35 cm from the platform, with a zenith angle of 30°. At the
end, the bidirectional reflectance factor was calculated, given by the ratio between the spectral radiance reflected by the soil sample and the radiance reflected by the
The Alpha Sample Compartment RT-DLaTGS ZnSe (Bruker Optik GmbH) equipped with a
diffuse reflectance acquisition accessory (Drift) was used to obtain data in the medium-infrared range (diffuse reflectance). The device uses a He-Ne laser as an internally
positioned light source and calibration standard for each wavelength. The sensor has a KBr beam splitter that allows wide amplitude of radiation incident on the sample (from 2,500 to 25,000 nm). About 1 cm³ of soil sample was placed for reading in the equipment container. Sixty-four readings were made every second per spectrum and these were acquired at a 2 cm-1 resolution. Before each reading, the calibration of the sensor, with diffuse gold plate, was performed to remove the background radiation from
the sample spectrum.
Of the samples, 70 % were randomly selected for training and 30 % for validation (external set of samples) of the models. The preprocessing methods were Continuous Removal (CR), Absorbance (ABS), Savitzky Golay Derivative (SGD), Standard Normal Variate (SNV), and Multiplicative Scatter Correction (MSC). We used Software R, version 3.4.
The CR is obtained using the prospectr package, where it is calculated according to the following mathematical description:
φi = xci
i ; i = {1, ..., p}
Eq. 1
in which xi is the original reflectance value; ciis the reflectance value of the continuum at the ith wavelength of a set of p wavelengths; and φ
i is the final value of the reflectance after removal of the continuum.
Absorbance is calculated by performing equation 2 on R.
A = log10 R1 Eq. 2
in which A is the absorbance; log10 is the logarithm base 10; and R is the reflectance.
The SGD is implemented by the savitzkyGolay function in the prospectr package. The mathematical description is given by equation 3.
xj = 1N
Σ
m–m ch xj+m Eq. 3
in which xj is the new value; N is a normalization coefficient; m is the number of neighboring values on each side of j; and ch are precalculated coefficients, which depend on the chosen polynomial and derivative orders.
The SNV is implemented by the standard Normal Variatefunction in the prospectr package, according to:
SNV= xi – xi
si
Eq. 4
in which xi is the original reflectance; x̅i is the mean of the original reflectance; and si is the standard deviation of the original reflectance.
The pls package includes the msc function for MSC preprocessing in R. The mathematical description of the MSC is given by equation 5.
MSC = xi – ai
bi
Eq. 5
These preprocesses were combined with the following multivariate regression algorithms:
Partial Least Squares Regression (PLSR), Artificial Neural Network (ANN), Random Forest
(RF), Gaussian Process Regression (linear and radial GPR), and Support Vector Machine (SVM), for a total of 30 tests. The data were processed using R 3.4 software, with the Alrad Spectra package. This package is not in CRAN, but in the GitHub repository. Instructions for installing, loading, and booting Alrad Spectra in R (Dotto et al., 2017).
For the Neural Network model, the parameters used were as follows: resampling method = 10 k-fold cross-validation; activation function = purelin (linear); and hidden units = 10. The elmtrain function of the elmNN package employs the best fitted parameters and
executes the final ANN model. The caret package adjusts the SVM model, and the best parameters are used to generate the final model with the SVM function available in the e1071
package. The adjustment parameters for SVM were as follows: resampling method = 10 k-fold cross-validation, and Kernel parameter = Support Vector Machine with Linear Kernel.
For accuracy analysis of the models, the coefficient of determination R² was calculated
according to the equation 6:
R2 =
Σ
ni=1(Pi – o)
2
Σ
ni=1(oi – o)
2 Eq. 6
in which Pi and oi, are the values predicted and observed at location i, respectively; and
n is the number of samples.
The RMSE, and the RPD (Residual Prediction Deviation) and RPIQ (Ration of Performance to Interquartile Distance) indexes were also calculated. The RMSE was obtained using the equation 7:
RMSE = N1
Σ
iι=1
[
z (Sj) – z*(Sj)]
2
^
√
Eq. 7in which RMSE is the square root of the mean error; ẑ (Sj) are the estimated values; z* (Sj) are the validation data; and ι is the number of points for validation.
The Residual Prediction Deviation (RPD) (Williams, 1987) and RPIQ (Bellon-Maurel et al., 2010) were calculated, respectively, by the equations 8 and 9:
RPD = SD
RMSE Eq. 8
RPIQ = RMSEIQ Eq. 9
in which SD is the standard deviation; IQ is the difference obtained between the value
referring to the 3rd and 1st quartile of the data distribution; and RMSE is the square root of the mean error.
Interpretation of the RPD values regarding the quality/reliability of the prediction was made according to the criteria proposed by Chang and Laird (2002) and Chang et al. (2001): values greater than 2.00 indicate excellent models for accurate prediction of properties; values between 1.40 and 2.00 indicate reasonable models; and values below 1.4, unreliable models. The same analogy was applied for RPIQ analysis (Terra, 2011).
RESULTS AND DISCUSSION
variability, even in homogeneous agricultural fields, and therefore many samples should
normally be collected and analyzed to capture this spatial variability and to adequately estimate its properties (Bilgili et al., 2010). Positive results are usually obtained for more
heterogeneous samples, such as the effective calibrations achieved by Fidêncio et al.
(2002), Kemper et al. (2005), and Brown et al. (2006).
Increased variability in the training phase of a statistical model leads to improved model robustness and greater ability to characterize a diverse variety of samples. Nevertheless, this variability may also lower prediction accuracy (McCarty et al., 2002). A widely applicable model for predicting OC should be based on a wide range of OC values in
soils and on soils with different mineralogical contexts, as indicated by Hartmann and Appel (2006). Soil mineralogy is one of the main factors that causes differences in reflectance. Preprocess proved to be effective, although Kooistra et al. (2001) reported
better predictions for clay and organic matter (OM) without spectral preprocessing.
Results are shown in table 2 for the clay property. When the coefficient of determination (R²) was analyzed, the highest values were found in the Vis-NIR (R2 = 0.69, RMSE = 4.38) and Vis-NIR-MIR (R2 = 0.54, RMSE = 5.88) spectra. Small improvements in clay prediction using the combination Vis-NIR-MIR were found by Viscarra Rossel et al. (2006). The Vis-NIR spectra contained valuable information to predict soil texture as reported by Mohamed et al. (2018), in agreement with the results obtained in our study. According to Hunt
(1980), many clay minerals have unique spectral reflectance at visible wavelengths and
NIR-SWIR (Near-Infrared--Short-wave Infrared).
For the Vis-NIR set, the best R2 value (0.69) was obtained from the combination of linear MSC-SVM algorithms. For Vis-NIR-MIR, it was from the combination SGD-PLSR (0.54). In the MIR range, the highest values of RPIQ in the validation set were found for the preprocessing combination SGD and PLSR predictor (1.82), and highest values of RPD for the combination MSC with PLSR and RF predictors (1.38). By RPD index analysis, we have an “unreliable” model (RPD less than 1.4), while the RPIQ raises the prediction for reasonable models. In the other spectra, maximum values of 2.15 for RPIQ and 1.62 for RPD were found in Vis-NIR; and 1.87 for RPIQ and 1.31 for RPD in Vis-NIR-MIR. By RPIQ
analysis, the models were classified as excellent (2.15) and reasonable (1.87), whereas RPD classified them as reasonable (1.62) and unreliable (less than 1.4).
In relation to the prediction capacity analyzed within each preprocessing method, according to RPIQ and RPD values, we observed that for the clay variable, PLSR was higher in all spectrum bands except for RPD in the Vis-NIR, whose SVM was higher. It is important to note that, although it was presented as a method that reached higher index values, the maximum value was found by the SVM-linear, GPR-linear, and RF algorithms.
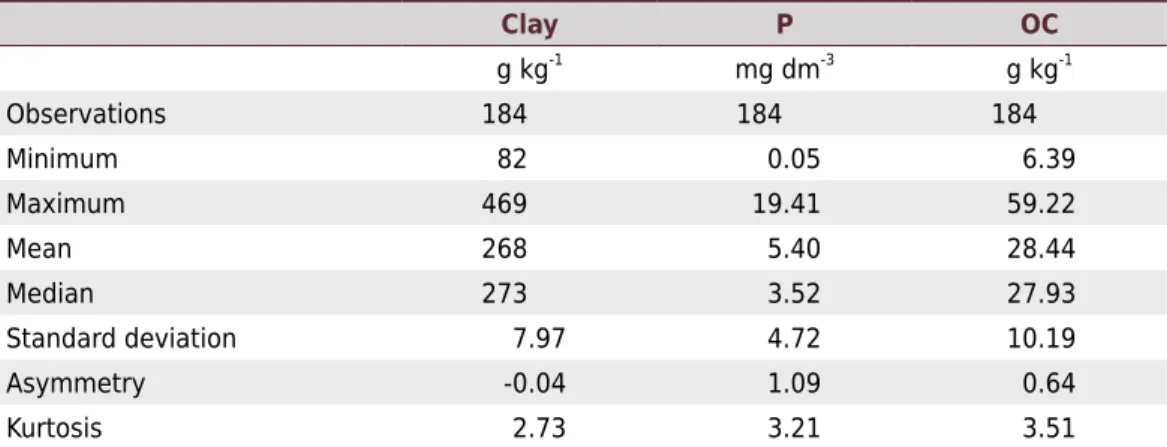
Table 1. Descriptive statistics for the clay, extractable phosphorus (P), and organic carbon (OC) of the all soils
Clay P OC
g kg-1 mg dm-3 g kg-1
Observations 184 184 184
Minimum 82 0.05 6.39
Maximum 469 19.41 59.22
Mean 268 5.40 28.44
Median 273 3.52 27.93
Standard deviation 7.97 4.72 10.19
Asymmetry -0.04 1.09 0.64
Kurtosis 2.73 3.21 3.51
Clay was quantified by the pipette method; extractable P by Mehlich-1; and organic carbon by Walkley and
In relation to clay preprocessing, the SGD method stood out, with most of the RPIQ values higher than 1.4 in the MIR range; the MSC method and the SNV algorithm in the Vis-NIR spectrum and MSC in Vis-NIR-MIR also stood out. In the Vis-NIR range, RPIQ values higher than 2.0 were found. Regarding RPD, the MSC method was superior in the
MIR range, while the SNV method was more efficient in the Vis-NIR range. In contrast,
Absorbance (ABS), Continuum Removal (CR), and Savitzky Golay Derivative (SGD) were
more efficient in Vis-NIR-MIR. Values of RPD greater than 1.4 were found only for MSC in the Vis-NIR range. As in the MIR range, the models classified by the RPIQ index exhibited
higher quality than that determined by RPD.
Table 2. Values of R2, RMSE, RPD (ratio of performance/prediction to deviation), and RPIQ (ratio of performance/prediction to
interquartile range) for the clay property found for the different models and preprocessing methods in the MIR, Vis-NIR, and
Vis-NIR-MIR spectra
Model Pre-processing MIR Vis-NIR Vis-NIR-MIR
R² RMSE RPD RPIQ R² RMSE RPD RPIQ R² RMSE RPD RPIQ
PLSR CR 0.34 6.57 1.08 1.23 0.36 6.53 1.09 1.45 0.21 7.64 0.93 0.98
ANN CR 0.08 7.81 0.91 1.04 0.52 5.37 1.32 1.76 0.25 6.47 1.10 1.15
RF CR 0.33 6.67 1.07 1.21 0.47 5.66 1.26 1.67 0.38 5.41 1.31 1.38
GPR linear CR 0.24 8.14 0.87 0.99 0.23 8.76 0.81 1.08 0.05 17.23 0.41 0.43
GPR radial CR 0.35 7.15 0.99 1.13 0.35 6.41 1.11 1.48 0.35 5.68 1.25 1.32
SVM linear CR 0.30 7.73 0.92 1.19 0.19 8.93 0.80 1.06 0.04 18.42 0.39 0.41
PLSR ABS 0.33 6.47 1.10 1.61 0.53 5.72 1.24 1.42 0.5 5.71 1.25 1.74
ANN ABS 0.28 6.77 1.05 1.54 0.40 6.15 1.16 1.32 0.44 6.02 1.18 1.65
RF ABS 0.27 6.82 1.04 1.53 0.37 6.24 1.14 1.30 0.5 6.08 1.17 1.63
GPR linear ABS 0.26 7.50 0.95 1.39 0.46 6.05 1.18 1.34 0.34 7.79 0.91 1.27
GPR radial ABS 0.25 7.04 1.01 1.49 0.30 6.81 1.04 1.19 0.41 6.73 1.06 1.48
SVM linear ABS 0.21 8.47 0.84 1.23 0.50 5.71 1.25 1.42 0.33 8.31 0.86 1.19
PLSR SGD 0.39 5.84 1.22 1.82 0.36 6.14 1.16 1.59 0.54 5.88 1.21 1.53
ANN SGD 0.29 6.37 1.12 1.66 0.32 6.70 1.06 1.45 0.12 8.06 0.88 1.12
RF SGD 0.32 6.33 1.12 1.68 0.60 5.40 1.32 1.80 0.53 6.17 1.15 1.46
GPR linear SGD 0.30 7.04 1.01 1.50 0.42 7.85 0.91 1.24 0.46 6.52 1.09 1.38
GPR radial SGD 0.20 7.02 1.01 1.51 0.49 6.42 1.11 1.52 0.47 6.78 1.05 1.33
SVM linear SGD 0.28 7.06 1.01 1.50 0.42 8.03 0.89 1.21 0.44 6.67 1.07 1.35
PLSR SNV 0.42 5.90 1.21 1.40 0.53 5.28 1.35 2.04 0.41 6.44 1.10 1.66
ANN SNV 0.32 6.43 1.11 1.28 0.43 5.93 1.20 1.81 0.21 7.31 0.97 1.46
RF SNV 0.50 5.61 1.27 1.47 0.44 5.72 1.24 1.88 0.39 6.52 1.09 0.83
GPR linear SNV 0.27 8.30 0.86 0.99 0.50 5.53 1.29 1.94 0.26 8.88 0.80 1.35
GPR radial SNV 0.32 6.82 1.04 1.21 0.44 6.01 1.18 1.79 0.34 6.93 1.03 1.72
SVM linear SNV 0.25 8.97 0.79 0.92 0.51 5.59 1.27 1.95 0.25 9.13 0.78 1.31
PLSR MSC 0.43 5.16 1.38 1.63 0.38 6.82 1.04 1.50 0.40 6.81 1.04 1.83
ANN MSC 0.39 5.33 1.33 1.58 0.35 6.70 1.06 1.53 0.35 7.10 1.00 1.75
RF MSC 0.44 5.16 1.38 1.63 0.38 6.24 1.14 1.64 0.42 6.78 1.05 1.84
GPR linear MSC 0.17 8.98 0.79 0.94 0.39 6.67 1.07 1.54 0.50 6.65 1.07 1.87
GPR radial MSC 0.20 6.37 1.12 1.32 0.4 6.23 1.14 1.65 0.42 7.18 0.99 1.73
SVM linear MSC 0.15 9.77 0.73 0.86 0.69 4.38 1.62 2.15 0.47 7.02 1.01 1.77
ABS = Absorbance; CR = Continuum Removal; MSC = Multiplicative Scatter Correction; SGD = Savitzky Golay Derivative; SNV = Standard
Normal Variate; PLSR = Partial Least Squares Regression; ANN = Artificial Neural Network; RF = Random Forest; GPR linear and radial = Gaussian
For clay prediction, some satisfactory results were found by Chang et al. (2001) and Morón and Cozzolino (2003). In the studies conducted by Ben-Dor and Banin (1995) and Islan et al. (2003), the clay was modeled from the NIR spectrum and found R2 of 0.56 and 0.75, respectively. While Chang et al. (2001) and Shepherd and Walsh (2002) worked on the Vis-NIR spectrum, obtaining slightly better values, of 0.67 and 0.78. It is possible to predict clay in the NIR region using PLSR according to Silva et al. (2016). Viscarra Rossel
et al. (2006) modeled clay and found R² values of 0.43 (Vis), 0.60 (NIR), 0.67 (MIR), and
0.67 (Vis-NIR-MIR); while Kania and Gruba (2016) tested clay prediction by NIR spectra
and found R² values of 0.57 and 0.21. These values are lower than the values found
in this study, while Ben-Dor and Banin (1995) obtained higher values, with R2 = 0.86.
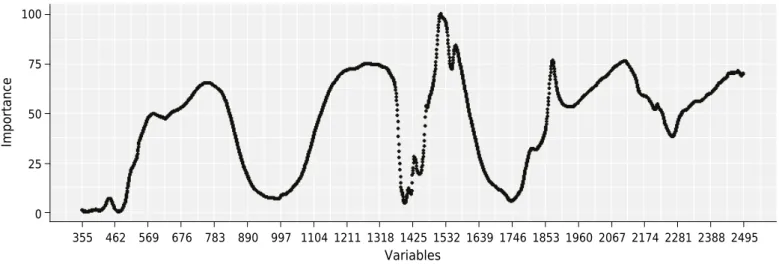
The significant wavelengths to estimate clay content in the NIR range are 1,600, 1,800,
2,000, and 2,100 nm (Viscarra Rossel and McBratney, 1998). In contrast, Nawara et al.
(2016) reported that the wavelength of 2,206 nm would be the ideal band for quantification
of this property. In this study, the most important variables in the prediction (Figure 1) were the spectra around 1,500, 1,800, and 2,100 nm (Viscarra Rossel and McBratney, 1998).
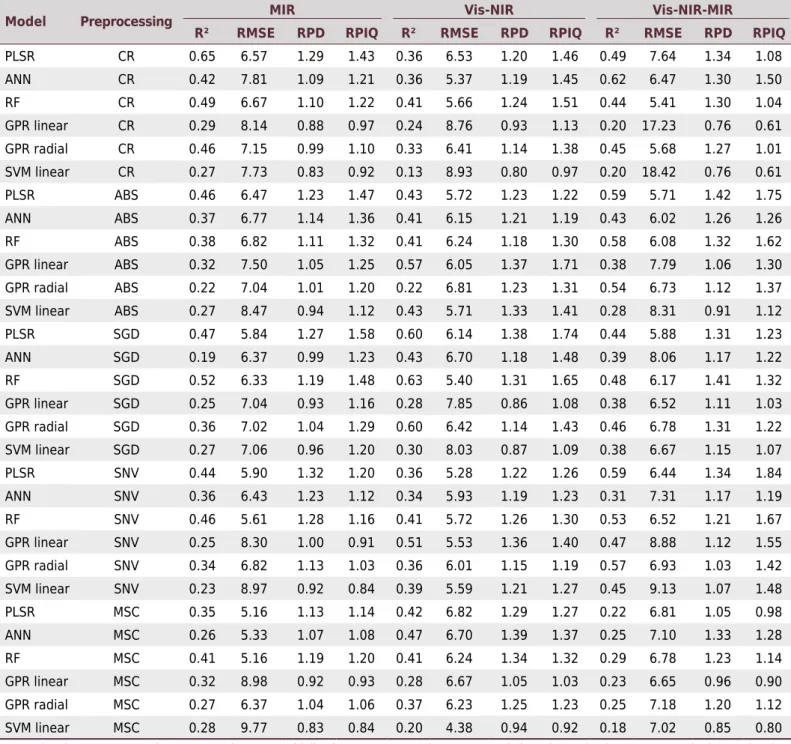
The results for the organic carbon (OC) variable are shown in table 3. In the MIR spectrum, the best R2 value was 0.65, with RMSE of 8.31. This is obtained by the combination CR-PLSR. The highest RPIQ and RPD indices were 1.58 and 1.32, the first being obtained by SGD
preprocessing and the PLSR predictor; and the second by the SNV-PLSR combination.
In the Vis-NIR and Vis-NIR-MIR bands, the R2 values were slightly lower than in the MIR, while the RPIQ and RPD values were slightly higher. According to Vohland et al. (2014),
the physical mechanisms differ basically between the Vis-NIR and MIR domains, while
the fundamental molecular vibrations of the soil components can be measured only in the MIR. In the NIR range, the repercussions and combinations of these fundamental vibrations are detected.
Vis-NIR had an R2 of 0.63 (RMSE = 8.18) from the combination SGD-RF, and Vis-NIR-MIR had an R2 of 0.62 (RMSE = 8.28) from the combination CR-ANN. In relation to the RPIQ and RPD values for the OC variable, the PLSR algorithm was superior for MIR and Vis-NIR-MIR, and linear GPR was superior in the Vis-NIR range. Regarding OC preprocessing, SGD stood out, with the majority of RPIQ values higher than 1.4 in the MIR and Vis-NIR-MIR range; and SNV stood out in the Vis-NIR-MIR spectrum. As for the RPD, only the Vis-NIR-MIR range had values above 1.4 with ABS and SGD, which stood out as the best preprocessing methods for the variable.
Importanc
e
Variables
100
75
50
25
0
355 462 569 676 783 890 997 1104 1211 1318 1425 1532 1639 1746 1853 1960 2067 2174 2281 2388 2495
The RPIQ had maximum values of 1.74 (Vis-NIR) and 1.84 (Vis-NIR-MIR), while the RPD values obtained by the PLSR predictor was of 1.42 (Vis-NIR-MIR). When the process was combined with SGD preprocessing, the values was 1.74, with SNV was 1.84, and with ABS was 1.42. Contrary to what was found in this study, in which the PLSR stood out, Xiaoting et al. (2014) worked with the SVM predictor in the Vis-NIR spectra to improve OC accuracy by combining it with a projection algorithm (SPA) model. The results obtained by Brown et al. (2006) also indicated that other data mining techniques, such as Boost Regression Trees (BRT), may outperform PLSR because of their ability to include nonlinear interactions and relationships. Other articles are cited for applying
different algorithms successfully (Mouazen et al., 2010; Viscarra Rossel and Behrens,
2010; Vohland et al., 2011).
Table 3. The values of R2, RMSE, RPD, and RPIQ for the organic carbon property found for the different models and preprocessing
methods in the MIR, Vis-NIR, and Vis-NIR-MIR
Model Preprocessing MIR Vis-NIR Vis-NIR-MIR
R² RMSE RPD RPIQ R² RMSE RPD RPIQ R² RMSE RPD RPIQ
PLSR CR 0.65 6.57 1.29 1.43 0.36 6.53 1.20 1.46 0.49 7.64 1.34 1.08
ANN CR 0.42 7.81 1.09 1.21 0.36 5.37 1.19 1.45 0.62 6.47 1.30 1.50
RF CR 0.49 6.67 1.10 1.22 0.41 5.66 1.24 1.51 0.44 5.41 1.30 1.04
GPR linear CR 0.29 8.14 0.88 0.97 0.24 8.76 0.93 1.13 0.20 17.23 0.76 0.61
GPR radial CR 0.46 7.15 0.99 1.10 0.33 6.41 1.14 1.38 0.45 5.68 1.27 1.01
SVM linear CR 0.27 7.73 0.83 0.92 0.13 8.93 0.80 0.97 0.20 18.42 0.76 0.61
PLSR ABS 0.46 6.47 1.23 1.47 0.43 5.72 1.23 1.22 0.59 5.71 1.42 1.75
ANN ABS 0.37 6.77 1.14 1.36 0.41 6.15 1.21 1.19 0.43 6.02 1.26 1.26
RF ABS 0.38 6.82 1.11 1.32 0.41 6.24 1.18 1.30 0.58 6.08 1.32 1.62
GPR linear ABS 0.32 7.50 1.05 1.25 0.57 6.05 1.37 1.71 0.38 7.79 1.06 1.30
GPR radial ABS 0.22 7.04 1.01 1.20 0.22 6.81 1.23 1.31 0.54 6.73 1.12 1.37
SVM linear ABS 0.27 8.47 0.94 1.12 0.43 5.71 1.33 1.41 0.28 8.31 0.91 1.12
PLSR SGD 0.47 5.84 1.27 1.58 0.60 6.14 1.38 1.74 0.44 5.88 1.31 1.23
ANN SGD 0.19 6.37 0.99 1.23 0.43 6.70 1.18 1.48 0.39 8.06 1.17 1.22
RF SGD 0.52 6.33 1.19 1.48 0.63 5.40 1.31 1.65 0.48 6.17 1.41 1.32
GPR linear SGD 0.25 7.04 0.93 1.16 0.28 7.85 0.86 1.08 0.38 6.52 1.11 1.03
GPR radial SGD 0.36 7.02 1.04 1.29 0.60 6.42 1.14 1.43 0.46 6.78 1.31 1.22
SVM linear SGD 0.27 7.06 0.96 1.20 0.30 8.03 0.87 1.09 0.38 6.67 1.15 1.07
PLSR SNV 0.44 5.90 1.32 1.20 0.36 5.28 1.22 1.26 0.59 6.44 1.34 1.84
ANN SNV 0.36 6.43 1.23 1.12 0.34 5.93 1.19 1.23 0.31 7.31 1.17 1.19
RF SNV 0.46 5.61 1.28 1.16 0.41 5.72 1.26 1.30 0.53 6.52 1.21 1.67
GPR linear SNV 0.25 8.30 1.00 0.91 0.51 5.53 1.36 1.40 0.47 8.88 1.12 1.55
GPR radial SNV 0.34 6.82 1.13 1.03 0.36 6.01 1.15 1.19 0.57 6.93 1.03 1.42
SVM linear SNV 0.23 8.97 0.92 0.84 0.39 5.59 1.21 1.27 0.45 9.13 1.07 1.48
PLSR MSC 0.35 5.16 1.13 1.14 0.42 6.82 1.29 1.27 0.22 6.81 1.05 0.98
ANN MSC 0.26 5.33 1.07 1.08 0.47 6.70 1.39 1.37 0.25 7.10 1.33 1.28
RF MSC 0.41 5.16 1.19 1.20 0.41 6.24 1.34 1.32 0.29 6.78 1.23 1.14
GPR linear MSC 0.32 8.98 0.92 0.93 0.28 6.67 1.05 1.03 0.23 6.65 0.96 0.90
GPR radial MSC 0.27 6.37 1.04 1.06 0.37 6.23 1.25 1.23 0.25 7.18 1.20 1.12
SVM linear MSC 0.28 9.77 0.83 0.84 0.20 4.38 0.94 0.92 0.18 7.02 0.85 0.80
ABS = Absorbance; CR = Continuum removal; MSC = Multiplicative Scatter Correction; SGD = Savitzky Golay Derivative; SNV = Standard Normal Variate;
PLSR = Partial Least Squares Regression; ANN = Artificial Neural Network; RF = Random Forest; GPR linear and radial = Gaussian Process Regression;
However, Adeline et al. (2017) emphasize that PLSR is the most widely used multivariate statistical method in Soil Science for chemometrics. This method highlights calibration of
soil reflectance to estimate soil properties (Viscarra Rossel et al., 2006) and is superior to
traditional methods in dealing with multicollinearity in high-dimensional data (Bilgili et al., 2010). In the study performed by Bilgili et al. (2010), the authors worked with 512 samples
and different soils and were able to predict OM with an R2 of 0.73 from Vis-NIR with data preprocessing using SGD.
There are several studies that demonstrate the possibility of OC prediction based on MIR (Zimmermann et al., 2007; Bornemann et al., 2008; Yang et al., 2012). Studies that compare MIR and NIR in the same samples show that MIR consistently outperforms NIR in soil analysis, especially for C and N fractions (McCarty et al., 2002; Reeves III et al., 2002; Madari et al., 2005). The MIR spectroscopy produced better models (from 10 to 40 %) than models developed from NIR spectra in soil carbon studies (Bellon-Maurel and McBratney (2011). Nevertheless, none of the studies analyzed compared NIR and MIR spectroscopy in the same soil samples (Knox et al., 2015).
In general, MIR is considered superior to Vis-NIR (Vohland et al., 2014). The MIR seems better than NIR and Vis-NIR for estimation of soil carbon contents, as indicated in the literature (McCarty et al., 2002; McCarty and Reeves III, 2006). However, this superiority has not been recognized in all studies (Madari et al., 2006; Ludwig et al., 2008; Michel et al., 2009). In this study, the best OC prediction was obtained in the MIR spectrum, in relation to R2, but the best values of RPIQ and RPD were in Vis-NIR.
This may be related to the fact that separation of the contribution of each soil component in the Vis-NIR spectra is a challenging task due to the complex nature of the soil matrix, with multiple overlays of spectral characteristics, as well as the strong collinearities among soil properties (Gobrecht et al., 2013). According to Knox et al. (2015), the MIR spectroscopy has generally been shown to predict OC and total carbon with greater accuracy than the Vis-NIR derived models. These authors found R2 values ranging from 0.58 to 0.87 for Vis-NIR, 0.87 to 0.96 for MIR, and 0.88 to 0.95 for Vis-NIR-MIR. However, they used a much larger range of samples than this study, with 1,014 sites being sampled, using 696 for calibration and 296 for validation.
The R2 value of 0.60 was found by Vohland et al. (2014) for OC in Vis-NIR; for MIR, the R2 value was 0.78; RPD values were 1.58 and 2.12, respectively. Analyses were performed in
a set of 60 soil samples extracted from arable land with different soil types and different textures, developed from different bedrocks and in different landscape positions. Despite
having only a few samples, the heterogeneity of the analyzed material was perceived, unlike the results of our study.
Values of R2 of 0.8 for OC was found by Shepherd and Walsh (2002) using a spectral library with more than 1,000 samples, while Bashagaluke et al. (2015), predicting carbon, found R2 of 0.72 using 530 composite soil samples. Similar accuracie (R2 = 0.73) was found by Viscarra Rossel et al. (2006) for a validation set of 118 samples in an area of 18 ha in Australia. Value of R2 equal to 0.86 for OM prediction was found by Daniel et al. (2003) in a study developed in Thailand using artificial neural networks in the Vis-NIR spectrum.
A higher correlation between measured and predicted carbon in the MIR range, among the spectra tested, with R2 between 0.63-0.85 was found by Arachchi et al. (2016). Kania and Gruba (2016) tested to predict total carbon using the NIR spectra and found R2 values for calibration of 0.80 and 0.48, and for validation, of 0.03 and 0.22, values lower than those found in this study. Summers et al. (2011), predicting OC in the range of 400-2500 nm, with 228 samples, achieved R2 of 0.57 with a RPD of 1.8. Reeves III and Smith (2009) predicted OC in the MIR and NIR spectra and found R² values of 0.58 in MIR and 0.53 in NIR.
development of calibration (Reeves III (2010). It has also been specifically observed
that the use of the Walkley-Black procedure (Walkley and Black, 1934) for OC can be problematic due to non-linearity in the measured values. However, this procedure is the most commonly used method (Malley et al., 2004). These factors could explain the values found, slightly below those in some studies cited in the literature with R2 above 0.8 and RPD-RPIQ higher than 2.0.
Infrared spectroscopy is well adapted and used to predict soil OC (Bellon-Maurel et al., 2010; Reeves III, 2010). Soil OC absorbs directly in the infrared region due to the high sensitivity of this region to groups such as C-H, C-O, and C-N prevailing in OM (Soriano-Disla et al., 2014). According to Dor et al. (1999), the OH and CH groups dominate NIR and the electronic transitions of the visible portions of the electromagnetic spectrum.
The OM includes the living biomass of plants and remnants of vegetation (Bartholomeus et al., 2008), and CO is an indication of the organic matter content since it is one of the main components of OM (Steiner et al., 2011). According to Beyer et al. (2001), CO contain biochemical components, such as chlorophyll, cellulose, pectin, starch, lignin, and
humic acids, which influence the visible (400-700 nm) and near-infrared (700-1,400 nm) reflectance of the electromagnetic spectrum. The variation in cellulose concentrations
was explained by Hartmann and Appel (2006) through the NIR spectrum. The Vis-NIR was applied by Viscarra Rossel and Hicks (2015) to predict carbon fractions.
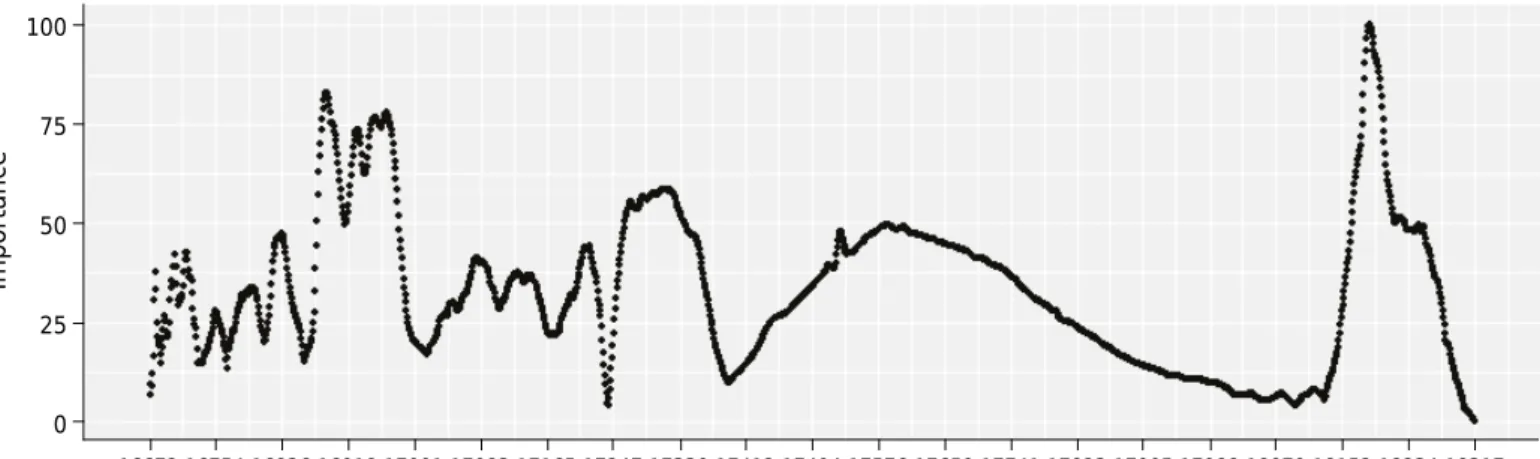
Theoretically, the OM, due to its complexity, is spectrally active in practically the entire NIR region (Ben-Dor and Banin, 1990), but it is often reported that organic matter signals in this region may be weak (Viscarra Rossel and McBratney, 1998) as there may be overlapping spectral characteristics of some minerals and organic matter (Ben-Dor and Banin, 1990; Viscarra Rossel and McBratney, 1998). Bands of 1,744, 1,870, and 2,052 nm were important for organic carbon predictions according to Ben-Dor and Banin (1990). In this study, the best prediction was found in the MIR spectrum, whose most important
prediction variables are presented in figure 2. The most relevant bands were 18,193 and
16,879 nm, followed by bands 17,247 and 17,326 nm.
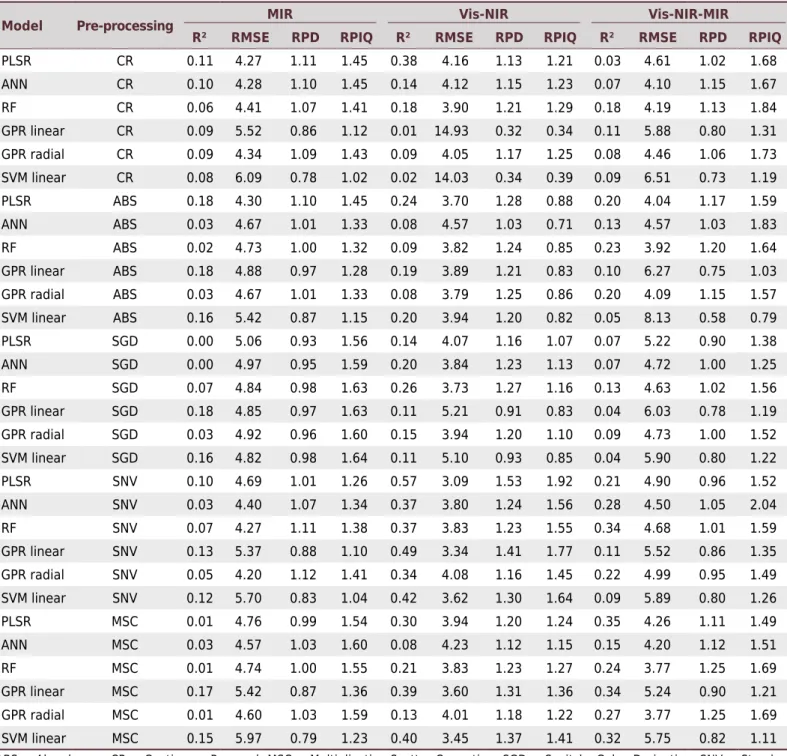
For the phosphorus variable (P), the values of R2, RMSE, RPD, and RPIQ are shown in table 4. The R2 values were the lowest among the properties modeled in this study. Influence between the prediction of available P in the Vis-NIR spectrum and the type
of solution used in extraction during soil analysis in the laboratory was reported by Abdi et al. (2016). According to Minasny et al. (2009), available P extracted by either bicarbonate or the Bray method is not well predicted. Adequate accuracy of Vis-NIR was
Importanc
e
Variables
100
75
50
25
0
16672 16754 16836 16918 17001 17083 17165 17247 17330 17412 17494 17576 17659 17741 17823 17905 17988 18070 18152 18234 18317
Figure 2. Important variables for prediction of organic carbon in the MIR (Medium Infrared) spectrum using Continuous Removal
found when available P was extracted using the Olsen method (Van Groenigen et al., 2003). Nduwamungu et al. (2009) showed that P extracted with Mehlich-3 (M-3) was poorly predicted by Vis-NI. Soil chemical extractions that alter the balance between phases may complicate interpretation of the results even more (Viscarra Rossel et al., 2006). Historically, the soil system and its quality were evaluated through this type of laboratory analysis (Viscarra Rossel et al., 2006).
In the MIR spectrum, no satisfactory R2 value was found. In the Vis-NIR spectra, the R2 value was 0.57 (SNV-PLSR with RMSE = 3.09). Maleki et al. (2006) observed the difference in Vis-NIR spectral reflectance according to variation in P content and they
Table 4. Values of R2
, RMSE, RPD, and RPIQ for the phosphorus property found for the different models and preprocessing methods
in the MIR, Vis-NIR, and Vis-NIR-MIR spectra
Model Pre-processing MIR Vis-NIR Vis-NIR-MIR
R² RMSE RPD RPIQ R² RMSE RPD RPIQ R² RMSE RPD RPIQ
PLSR CR 0.11 4.27 1.11 1.45 0.38 4.16 1.13 1.21 0.03 4.61 1.02 1.68
ANN CR 0.10 4.28 1.10 1.45 0.14 4.12 1.15 1.23 0.07 4.10 1.15 1.67
RF CR 0.06 4.41 1.07 1.41 0.18 3.90 1.21 1.29 0.18 4.19 1.13 1.84
GPR linear CR 0.09 5.52 0.86 1.12 0.01 14.93 0.32 0.34 0.11 5.88 0.80 1.31
GPR radial CR 0.09 4.34 1.09 1.43 0.09 4.05 1.17 1.25 0.08 4.46 1.06 1.73
SVM linear CR 0.08 6.09 0.78 1.02 0.02 14.03 0.34 0.39 0.09 6.51 0.73 1.19
PLSR ABS 0.18 4.30 1.10 1.45 0.24 3.70 1.28 0.88 0.20 4.04 1.17 1.59
ANN ABS 0.03 4.67 1.01 1.33 0.08 4.57 1.03 0.71 0.13 4.57 1.03 1.83
RF ABS 0.02 4.73 1.00 1.32 0.09 3.82 1.24 0.85 0.23 3.92 1.20 1.64
GPR linear ABS 0.18 4.88 0.97 1.28 0.19 3.89 1.21 0.83 0.10 6.27 0.75 1.03
GPR radial ABS 0.03 4.67 1.01 1.33 0.08 3.79 1.25 0.86 0.20 4.09 1.15 1.57
SVM linear ABS 0.16 5.42 0.87 1.15 0.20 3.94 1.20 0.82 0.05 8.13 0.58 0.79
PLSR SGD 0.00 5.06 0.93 1.56 0.14 4.07 1.16 1.07 0.07 5.22 0.90 1.38
ANN SGD 0.00 4.97 0.95 1.59 0.20 3.84 1.23 1.13 0.07 4.72 1.00 1.25
RF SGD 0.07 4.84 0.98 1.63 0.26 3.73 1.27 1.16 0.13 4.63 1.02 1.56
GPR linear SGD 0.18 4.85 0.97 1.63 0.11 5.21 0.91 0.83 0.04 6.03 0.78 1.19
GPR radial SGD 0.03 4.92 0.96 1.60 0.15 3.94 1.20 1.10 0.09 4.73 1.00 1.52
SVM linear SGD 0.16 4.82 0.98 1.64 0.11 5.10 0.93 0.85 0.04 5.90 0.80 1.22
PLSR SNV 0.10 4.69 1.01 1.26 0.57 3.09 1.53 1.92 0.21 4.90 0.96 1.52
ANN SNV 0.03 4.40 1.07 1.34 0.37 3.80 1.24 1.56 0.28 4.50 1.05 2.04
RF SNV 0.07 4.27 1.11 1.38 0.37 3.83 1.23 1.55 0.34 4.68 1.01 1.59
GPR linear SNV 0.13 5.37 0.88 1.10 0.49 3.34 1.41 1.77 0.11 5.52 0.86 1.35
GPR radial SNV 0.05 4.20 1.12 1.41 0.34 4.08 1.16 1.45 0.22 4.99 0.95 1.49
SVM linear SNV 0.12 5.70 0.83 1.04 0.42 3.62 1.30 1.64 0.09 5.89 0.80 1.26
PLSR MSC 0.01 4.76 0.99 1.54 0.30 3.94 1.20 1.24 0.35 4.26 1.11 1.49
ANN MSC 0.03 4.57 1.03 1.60 0.08 4.23 1.12 1.15 0.15 4.20 1.12 1.51
RF MSC 0.01 4.74 1.00 1.55 0.21 3.83 1.23 1.27 0.24 3.77 1.25 1.69
GPR linear MSC 0.17 5.42 0.87 1.36 0.39 3.60 1.31 1.36 0.34 5.24 0.90 1.21
GPR radial MSC 0.01 4.60 1.03 1.59 0.13 4.01 1.18 1.22 0.27 3.77 1.25 1.69
SVM linear MSC 0.15 5.97 0.79 1.23 0.40 3.45 1.37 1.41 0.32 5.75 0.82 1.11
ABS = Absorbance; CR = Continuum Removal; MSC = Multiplicative Scatter Correction; SGD = Savitzky Golay Derivative; SNV = Standard
Normal Variate; PLSR = Partial Least Squares Regression; ANN = Artificial Neural Network; RF = Random Forest; GPR linear and radial = Gaussian
hypothesized that P correlates indirectly with the near-infrared through different
soil components.
For RPIQ, the highest value was found in Vis-NIR-MIR, at 2.04 (SNV-ANN), followed by Vis-NIR, at 1.92 (SNV-PLSR) and MIR, at 1.64 (SGD-SVM linear). For RPD, the Vis-NIR band had a value of 1.53 (SNV-PLSR). Thus, the Vis-NIR-MIR spectrum was highlighted by the
RPIQ index and was classified as excellent, while the others were considered reasonable; by the RPD index, Vis-NIR was qualified as a reasonable model.
Regarding the RPIQ and RPD values for the variable P, PLSR was higher in Vis-NIR and in MIR together with radial GPR (for the RPIQ index); RF and ANN stood out in Vis-NIR-MIR. In phosphorus preprocessing, SGD stood out, with most RPIQ values higher than 1.4 in the MIR and SNV range. In the other values, SNV had RPIQ values higher than 2.0. As for RPD, only the Vis-NIR range presented values above 1.4 with SNV, standing out as the best preprocessing for the variable. According to Malley et al. (2004) predicting P with NIR spectra is less frequent. Possible causes are the nature of the element studied, interaction with other elements, the extraction method used (Chang et al., 2001), and to sample set heterogeneity and calibration.
In contrast, Niederberger et al. (2015) obtained results with adequate accuracy working in the NIR spectrum, where they realized that predicted models based on the organic P fractions had results superior to the inorganic P, because the organic compounds were more easily excited in the NIR spectrum. Values of R2 between 0.7 and 0.8 were found by Abdi et al. (2012) predicting total P, using the Vis-NIR spectrum for mapping element contents in an extremely sandy soil in Canada, attributing these values to the correlation between the total P and organic matter. Viscarra Rossel et al. (2006) found R2 values of 0.06 (Vis), 0.01 (NIR), 0.20 (MIR), and 0.02 (Vis-NIR-MIR) when modeling available P. While Janik et al. (1998) modeled available P contents with the MIR spectrum and found R2 values of 0.07, whereas Daniel et al. (2003) found R2 values of 0.81 with Vis-NIR.
Phosphorus was predicted by Lee et al. (2003) in 540 soil samples from four major soil types in Florida in the 400 to 2,500 nm wavelength range; they worked with PLSR and R2 values that ranged from 0.52 to 0.66. Values of R2 ranging from 0.51 to 0.95 for different bands of the spectrum were found by Knox et al. (2015), while Minasny et al. (2009) did not find satisfactory values in prediction of available P in the MIR spectrum;
McCarty and Reeves III (2006) also did not consider P prediction to be satisfactory using this wavelength.
The NIR could be satisfactory to predict some properties but did not obtain adequate results or obtained results with great variability from study to study for mineral forms of Ag, Al, Cd, Cu, Co, Fe, K, N, P, Pb, Na, Ni, Se, Si, Zn, and pH (Reeves III and Smith, 2009). These authors found values of R2 of 0.85 and 0.09 for P in the MIR and NIR spectra, respectively. Bogrekci and Lee (2007) found coefficients of determination from 0.76 to
0.93 in the near-infrared region using PLSR for total P and P extracted by Mehlich-1, respectively, and values between 0.61 and 0.83 for water-soluble P using visible region of the spectrum.
Considering what was affirmed by Bellon-Maurel and McBratney (2011) regarding where
it would be preferable to evaluate the RPIQ index on the RPD, this study established satisfactory models (RPIQ and/or RPD superior to 1.4) and showed excellent (RPIQ higher than 2.0) prediction capability for P, OC, and clay, which can be used to classify soils according to their properties, as suggested by Shepherd and Walsh (2002).
In the 1980s and 1990s quantification surveys were performed with only a few wavelengths (more specific, and varying according to the purpose, but always within the range of 1
this has become possible, and now the PLSR system can analyze many simultaneous wavelengths (e.g., 2,500 bands), and it evaluates which wavelengths make higher or
lower contributions in quantification of a given element. This upgrade in software and computers has allowed a great leap in quantification methodologies, as it analyzes all bands and gives weight to each one, thereby disarticulating the effects of collinearity. This caused an increase in the number of articles published in the field of chemometrics,
as reviewed by Nocita et al. (2015).
CONCLUSIONS
Clay, carbon, and extractable P elements were able to be quantified with R2 parameters in the range of 0.69, 0.65, and 0.57, respectively.
The spectral range of Vis-NIR was the best for clay and P, whereas that of MIR was best
for organic carbon. The unification of all bands produced an increase in R2 for the clay and P properties in relation to the MIR range.
The MSC, CR, and SNV preprocesses were the most efficient for predicting clay, OC,
and P, respectively, whereas the PLSR (OC and P) and SVM (clay) methods gave the best predictions and, thus, are recommended for modeling these properties in the study area.
ACKNOWLEDGMENTS
Our thanks to Bruno Campbell de Azevedo, Pedro Araújo Henrique Almeida, Carlos Magno de Oliveira, and Felipe Cipriano, who assisted in collection of samples, and to the Espirito Santo Institute for Research, Technical Assistance and Rural Extension (Incaper) for logistic support.
REFERENCES
Abdi D, Cade-Menun BJ, Ziadi N, Tremblay GF, Parent L-E. Visible near infrared reflectance
spectroscopy to predict soil phosphorus pools in Chernozems of Saskatchewan, Canada. Geoderma Regional. 2016;7:93-101. https://doi.org/10.1016/j.geodrs.2016.02.004
Abdi D, Tremblay GF, Ziadi N, Bélanger G, Parent L-E. Predicting soil phosphorus-related
properties using near-infrared reflectance spectroscopy. Soil Sci Soc Am J. 2012;76:2318-26.
https://doi.org/10.2136/sssaj2012.0155
Adeline KRM, Gomez C, Gorretta N, Roger J-M. Predictive ability of soil properties to spectral degradation from laboratory Vis-NIR spectroscopy data. Geoderma. 2017;288:143-53. https://doi.org/10.1016/j.geoderma.2016.11.010
Arachchi MPKH, Field DJ, McBratney AB. Quantification of soil carbon from bulk soil samples
to predict the aggregate-carbon fractions within using near- and mid-infrared spectroscopic techniques. Geoderma. 2016;267:207-14. https://doi.org/10.1016/j.geoderma.2015.12.030
Bartholomeus HM, Schaepman ME, Kooistra L, Stevens A, Hoogmoed WB, Spaargaren
OSP. Spectral reflectance based indices for soil organic carbon quantification. Geoderma.
2008;145:28-36. https://doi.org/10.1016/j.geoderma.2008.01.010
Bashagaluke J, Nshobole N, Fataki D, Mochoge B, Mugwe J, Walangululu J. Application of infrared technique in soil properties characterization in South Kivu province of DR Congo. Afr J Food Sci Technol. 2015;6:58-67. https://doi.org/10.14303/ajfst.2015.017
Bellon-Maurel V, McBratney A. Near-infrared (NIR) and mid-infrared (MIR) spectroscopic techniques for assessing the amount of carbon stock in soils - critical review and research perspectives. Soil Biol Biochem. 2011;43:1398-410. https://doi.org/10.1016/j.soilbio.2011.02.019
Ben-Dor E, Banin A. Near infrared analysis as a rapid method to simultaneously evaluate several soil properties. Soil Sci Soc Am J. 1995;59:364-72.
https://doi.org/10.2136/sssaj1995.03615995005900020014x
Ben-Dor E, Banin A. Diffuse reflectance spectra of smectite minerals in the near
infrared and their relation to chemical composition. Sci Geol Bull. 1990;43:117-28. https://doi.org/10.3406/sgeol.1990.1848
Ben-Dor E, Irons JR, Epema GF. Soil reflectance. In: Rencz AN, editor. Remote sensing for the
earth sciences: manual of remote sensing. 3rd ed. New York: John Wiley; 1999. v. 3. p. 111-88.
Beyer L, Kahle P, Kretschmer H, Wu Q. Soil organic matter composition of man-impacted urban sites in North Germany. J Plant Nutr Soil Sc. 2001;164:359-64. https://doi.org/10.1002/1522-2624(200108)164:4<359::AID-JPLN359>3.0.CO;2-M
Bilgili AV, van Es HM, Akbas F, Durak A, Hively WD. Visible-near infrared reflectance
spectroscopy for assessment of soil properties in a semi-arid area of Turkey. J Arid Environ. 2010;74:229-38. https://doi.org/10.1016/j.jaridenv.2009.08.011
Bogrekci I, Lee WS. Comparison of ultraviolet, visible, and near infrared sensing for soil phosphorus. Biosyst Eng. 2007;96:293-9. https://doi.org/10.1016/j.biosystemseng.2006.11.001
Bogrekci I, Lee WS. Spectral phosphorus mapping using diffuse reflectance of soils and grass.
Biosyst Eng. 2005;91:305-12. https://doi.org/10.1016/j.biosystemseng.2005.04.015
Bornemann L, Welp G, Brodowski S, Rodionov A, Amelung W. Rapid assessment of black carbon in soil organic matter using mid-infrared spectroscopy. Org Geochem. 2008;39:1537-44. https://doi.org/10.1016/j.orggeochem.2008.07.012
Breiman L. Random forests. Mach Learn. 2001;45:5-32. https://doi.org/10.1023/A:1010933404324
Brown DJ, Shepherd KD, Walsh MG, Mays MD, Reinsch TG. Global soil characterization
with VNIR diffuse reflectance spectroscopy. Geoderma. 2006;132:273-90.
https://doi.org/10.1016/j.geoderma.2005.04.025
Chang C-W, Laird DA. Near-infrared reflectance spectroscopic analysis of soil C and N. Soil Sci.
2002;167:110-6. https://doi.org/10.1097/00010694-200202000-00003
Chang C-W, Laird DA, Mausbach MJ, Hurburgh CR. Near-infrared reflectance
spectroscopy-principal components regression analyses of soil properties. Soil Sci Soc Am J. 2001;65:480-90. https://doi.org/10.2136/sssaj2001.652480x
Clark RN, Roush TL. Reflectance spectroscopy: Quantitative analysis techniques
for remote sensing applications. J Geophys Res-Sol EA. 1984;89:6329-40. https://doi.org/10.1029/JB089iB07p06329
Daniel KW, Tripathi NK, Honda K. Artificial neural network analysis of laboratory and in situ
spectra for the estimation of macronutrients in soils of Lop Buri (Thailand). Aust J Soil Res. 2003;41:47-59. https://doi.org/10.1071/SR02027
Donagema GK, Campos DVB, Calderano SB, Teixeira WG, Viana JHM. Manual de métodos de análise do solo. 2. ed. rev. Rio de Janeiro: Embrapa Solos; 2011.
Dotto AC, Dalmolin RSD, ten Caten A, Gris DJ, Ruiz LFC. Alrad Spectra: predição de atributos do solo usando dados espectrais. In: Anais do XXXVI Congresso Brasileiro de Ciência do Solo; agosto 2017; Belém. Belém: Universidade Federal Rural da Amazônia; 2017.
Fernández-Pierna JA, Dardenne P. Soil parameter quantification by NIRS as a
Chemometric challenge at ‘Chimiométrie 2006’. Chemometr Intell Lab. 2008;91:94-8. https://doi.org/10.1016/j.chemolab.2007.06.007
Genot V, Colinet G, Bock L, Vanvyve D, Reusen Y, Dardenne P. Near infrared reflectance
spectroscopy for estimating soil characteristics valuable in the diagnosis of soil fertility. J Near Infrared Spec. 2011;19:117-38. https://doi.org/10.1255/jnirs.923
Gobrecht A, Roger J-M, Bellon-Maurel V. Major issues of diffuse reflectance NIR spectroscopy in the specific context of soil carbon content estimation: a review. Adv Agron. 2013;123:145-75.
https://doi.org/10.1016/B978-0-12-420225-2.00004-2
Groeneveld RA, Meeden G. Measuring skwness and kurtosis. J R Stat Soc. 1984;33:391-9. https://doi.org/10.2307/2987742
Hartmann HP, Appel T. Calibration of near infrared spectra for measuring
decomposing cellulose and green manure in soils. Soil Biol Biochem. 2006;38:887-97. https://doi.org/10.1016/j.soilbio.2005.08.005
Hatchell DC. Analytical spectral devices: technical guide. 3rd ed. Boulder: Analytical Spectral Devices; 1999.
Hunt GR. Electromagnetic radiation - the communication link in remote sensing. In: Siegal BS, Gillespie AR, editors. Remote Sensing in Geology. New York: Jonh Wiley; 1980. p. 5-45.
Islan K, Singh B, McBratney A. Simultaneous estimation of several soil properties by
ultra-violet, visible, and near-infrared reflectance spectroscopy. Aust J Soil Res. 2003;41:1101-14.
https://doi.org/10.1071/sr02137
Janik LJ, Merry RH, Skjemstad JO. Can mid infrared diffuse reflectance analysis replace soil
extractions? Aust J Exp Agr. 1998;38:681-96. https://doi.org/10.1071/EA97144
Kania M, Gruba P. Estimation of selected properties of forest soils using near-infrared spectroscopy (NIR). Soil Sci Annu. 2016;67:32-6. https://doi.org/10.1515/ssa-2016-0005
Kemper T, Böttcher K, Machwitz M, Sommer S, Mehl W. An approach to chemometric methods for soil organic matter estimation from laboratory and remote sensing data. In: 4th Workshop on Imaging Spectroscopy; abril 2005; Warsaw. Warsaw: European Association of Remote Sensing Laboratories (EARSeL); 2005. p. 27-9.
Knox NM, Grunwald S, McDowell ML, Bruland GJ, Myers DB, Harris WG. Modelling soil carbon fractions with visible near-infrared (VNIR) and mid-infrared (MIR) spectroscopy. Geoderma. 2015;239-240:229-39. https://doi.org/10.1016/j.geoderma.2014.10.019
Kooistra L, Wehrens R, Leuven RSEW, Buydens LMC. Possibilities of visible-near-infrared
spectroscopy for assessment of soil contamination in river floodplains. Anal Chim Acta.
2001;446:97-105. https://doi.org/10.1016/S0003-2670(01)01265-X
Lee WS, Sanchez JF, Mylavarapu RS, Choe JS. Estimating chemical properties of Florida soils
using spectral reflectance. T ASAE. 2003;46:1443-53.
Ludwig B, Linsler D, Höper H, Schmidt H, Piepho H-P, Vohland M. Pitfalls in the use of middle-infrared spectroscopy: representativeness and ranking criteria for the estimation of soil properties. Geoderma. 2016;268:165-75. https://doi.org/10.1016/j.geoderma.2016.01.010
Ludwig B, Nitschke R, Terhoeven-Urselmans T, Michel K, Flessa H. Use of
mid-infrared spectroscopy in the diffuse-reflectance mode for the prediction of the
composition of organic matter in soil and litter. J Plant Nutr Soil Sc. 2008;171:384-91. https://doi.org/10.1002/jpln.200700022
Madari BE, Reeves III JB, Coelho MR, Machado PLOA, De-Polli H, Coelho RM, Benites VM, Souza LF, McCarty GW. Mid- and near-infrared spectroscopic determination of total and organic carbon in a diverse set of soils from the Brazilian national soil collection. Spectrosc Lett. 2005;38:721-40. https://doi.org/10.1080/00387010500315876
Madari BE, Reeves III JB, Machado PLOA, Guimarães CM, Torres E, McCarty GW. Mid- and near-infrared spectroscopic assessment of soil compositional parameters and structural indices in two Ferralsols. Geoderma. 2006;136:245-59. https://doi.org/10.1016/j.geoderma.2006.03.026
Malley DF, Martin PD, Ben-Dor E. Application in analysis of soils. In: Roberts CA, Workman Jr J, Reeves III JB, editors. Near-infrared spectroscopy in agriculture. Madison: American Society of Agronomy; 2004. p. 729-84.
McCarty GW, Reeves III JB. Comparison of near infrared and mid infrared diffuse reflectance spectroscopy for field-scale measurement of soil fertility parameters. Soil Sci. 2006;171:94-102.
https://doi.org/10.1097/01.ss.0000187377.84391.54
McCarty GW, Reeves III JB, Reeves VB, Follett RF, Kimble JM. Mid-infrared and near-infrared
diffuse reflectance spectroscopy for soil carbon measurement. Soil Sci Soc Am J. 2002;66:640-6.
https://doi.org/10.2136/sssaj2002.6400
Michel K, Terhoeven-Urselmans T, Nitschke R, Steffan P, Ludwig B. Use of nearand mid-infrared spectroscopy to distinguish carbon and nitrogen originating from char and forest-floor material
in soils. J Plant Nutr Soil Sci. 2009;172:63-70. https://doi.org/10.1002/jpln.200700246
Minasny B, McBratney AB. Regression rules as a tool for predicting soil properties
from infrared reflectance spectroscopy. Chemometr Intell Lab. 2008;94:72-9.
https://doi.org/10.1016/j.chemolab.2008.06.003
Minasny B, Tranter G, McBratney AB, Brough DM, Murphy BW. Regional transferability of
mid-infrared diffuse reflectance spectroscopic prediction for soil chemical properties. Geoderma.
2009;153:155-62. https://doi.org/10.1016/j.geoderma.2009.07.021
Mohamed ES, Saleh AM, Belal AB, Gad A_A. Application of near-infrared reflectance for
quantitative assessment of soil properties. Egypt J Remote Sensing Space Sci. 2018;21:1-14. https://doi.org/10.1016/j.ejrs.2017.02.001
Morón A, Cozzolino D. Exploring the use of near infrared reflectance spectroscopy to study
physical properties and microelements in soils. J Near Infrared Spec. 2003;11:145-54.
Mouazen AM, Kuang B, De Baerdemaeker J, Ramon H. Comparison among principal component, partial least squares and back propagation neural network analyses for accuracy of measurement of selected soil properties with visible and near infrared
spectroscopy. Geoderma. 2010;158:23-31. https://doi.org/10.1016/j.geoderma.2010.03.001
Mutanga O, Skidmore AK, Kumar L, Ferwerda J. Estimating tropical pasture quality at canopy level using band depth analysis with continuum removal in the visible domain. Int J Remote Sens. 2005;26:1093-108. https://doi.org/10.1080/01431160512331326738
Nanni MR, Demattê JAM. Spectral reflectance methodology in comparison to traditional soil
analysis. Soil Sci Soc Am J. 2006;70:393-407. https://doi.org/10.2136/sssaj2003.0285
Nascimento RFF, Alcântara EH, Kampel M, Stech JL, Moraes Novo EML, Fonseca LMG. O algoritmo Support Vector Machines (SVM): avaliação da separação ótima de classes em imagens CCD-CBERS-2. In: Anais do XIV Simpósio Brasileiro de Sensoriamento Remoto [CD-ROM]; 25-30 abr 2009; Natal. Natal: INPE; 2009. p. 2079-86.
Nawara S, Buddenbaum H, Hill J, Kozak J, Mouazen AM. Estimating the soil clay content
and organic matter by means of different calibration methods of vis-NIR diffuse reflectance
spectroscopy. Soil Till Res. 2016;155:510-22. https://doi.org/10.1016/j.still.2015.07.021
Nduwamungu C, Ziadi N, Parent L-É, Tremblay GF. Mehlich 3 extractable nutrients as
determined by near-infrared reflectance spectroscopy. Can J Soil Sci. 2009;89:579-87.
https://doi.org/10.4141/CJSS09018
Niederberger J, Todt B, Boča A, Nitschke R, Kohler M, Kühn P, Bauhus J. Use of near-infrared spectroscopy to assess phosphorus fractions of different plant availability in forest soils.
Biogeosciences. 2015;12:3415-28. https://doi.org/10.5194/bg-12-3415-2015
Nouri M, Gomez C, Gorretta N, Roger JM. Clay content mapping from airborne hyperspectral Vis-NIR data by transferring a laboratory regression model. Geoderma. 2017;298:54-66. https://doi.org/10.1016/j.geoderma.2017.03.011
Peng X, Shi T, Song A, Gao W. Estimating soil organic carbon using VIS/NIR spectroscopy with SVMR and SPA Methods. Remote Sens. 2014;6:2699-717. https://doi.org/10.3390/rs6042699
Ramirez-Lopez L, Behrens T, Schmidt K, Stevens A, Demattê JAM, Scholten T. The spectrum-based learner: a new local approach for modeling soil vis–NIR spectra of complex datasets. Geoderma. 2013;195-196:268-79. https://doi.org/10.1016/j.geoderma.2012.12.014
Reeves III JB. Near- versus mid-infrared diffuse reflectance spectroscopy for soil analysis
emphasizing carbon and laboratory versus on-site analysis: where are we and what needs to be done? Geoderma. 2010;158:3-14. https://doi.org/10.1016/j.geoderma.2009.04.005
Reeves III JB, McCarty G, Mimmo T. The potential of diffuse reflectance spectroscopy
for the determination of carbon inventories in soils. Environ Pollut. 2002;116:S277-84. https://doi.org/10.1016/S0269-7491(01)00259-7
Reeves III JB, Smith DB. The potential of mid- and near-infrared diffuse reflectance
spectroscopy for determining major- and trace-element concentrations in soils from a geochemical survey of North America. Appl Geochem. 2009;24:1472-81. https://doi.org/10.1016/j.apgeochem.2009.04.017
Rinnan Å, van den Berg F, Engelsen SB. Review of the most common pre-processing techniques for near-infrared spectra. Trac-Trend Anal Chem. 2009;28:1201-22. https://doi.org/10.1016/j.trac.2009.07.007
Savitzky A, Golay MJE. Smoothing and differentiation of data by simplified least square
procedure. Anal Chem. 1964;36:1627-39. https://doi.org/10.1021/ac60214a047
Shepherd KD, Walsh MG. Development of reflectance spectral libraries for characterization of
soil properties. Soil Sci Soc Am J. 2002;66:988-98. https://doi.org/10.2136/sssaj2002.9880
Silva EB, Ten Caten A, Dalmolin RSD, Dotto AC, Silva WC, Giasson E. Estimating soil texture from a limited region of the visible/near-infrared spectrum. In: Hartemink A, Minasny B, editors. Digital soil morphometr. Madison: Springer; 2016. p. 73-87.
Soriano-Disla JM, Janik LJ, Viscarra Rossel RA, MacDonald LM, McLaughlin MJ. The
performance of visible, near-, and mid-infrared reflectance spectroscopy for prediction of
soil physical, chemical, and biological properties. Appl Spectrosc Rev. 2014;49:139-86. https://doi.org/10.1080/05704928.2013.811081
Steiner F, Pivetta LA, Castoldi G, De Costa MSSM, Costa LAM. Carbono orgânico e carbono residual do solo em sistema de plantio direto, submetido a diferentes manejos. Rev Bras Cienc Agr. 2011;6:401-8. https://doi.org/10.5039/agraria.v6i3a944
Stevens A, Ramirez-Lopez L, Stevens MA, Rcpp L. Prospectr: miscellaneous functions for
processing and sample selection of vis-NIR diffuse reflectance data. Version 0.1. 3. R Package;
2013. p. 32.
Stevens A, Udelhoven T, Denis A, Tychon B, Lioy R, Hoffmann L, van Wesemael B. Measuring
soil organic carbon in croplands at regional scale using airborne imaging spectroscopy. Geoderma. 2010;158:32-45. https://doi.org/10.1016/j.geoderma.2009.11.032
Summers D, Lewis M, Ostendorf B, Chittleborough D. Visible near-infrared reflectance
spectroscopy as a predictive indicator of soil properties. Ecol Indic. 2011;11:123-31. https://doi.org/10.1016/j.ecolind.2009.05.001
Terra FS. Espectroscopia de reflectância do visível ao infravermelho médio aplicada aos estudos
qualitativos e quantitativos de solos [tese]. Piracicaba: Escola Superior de Agricultura “Luiz de Queiroz”; 2011.
Van Groenigen JW, Mutters CS, Horwath WR, van Kessel C. NIR and DRIFT-MIR spectrometry
of soils for predicting soil and crop parameters in a flooded field. Plant Soil. 2003;250:155-65.
Vasques GM, Grunwald S, Sickman JO. Comparison of multivariate methods for inferential modeling of soil carbon using visible/near-infrared spectra. Geoderma. 2008;146:14-25. https://doi.org/10.1016/j.geoderma.2008.04.007
Viscarra Rossel RA, Behrens T. Using data mining to model and interpret soil diffuse reflectance
spectra. Geoderma. 2010;158:46-54. https://doi.org/10.1016/j.geoderma.2009.12.025
Viscarra Rossel RA, Hicks WS. Soil carbon and its fractions estimated by visible near infrared transfer functions. Eur J Soil Res. 2015;66:438-50. https://doi.org/10.1111/ejss.12237
Viscarra Rossel RA, McBratney AB. Laboratory evaluation of a proximal sensing technique for simultaneous measurement of clay and water content. Geoderma.1998;85:19-39. https://doi.org/10.1016/S0016-7061(98)00023-8
Viscarra Rossel RA, Walvoort DJJ, McBratney AB, Janik LJ, Skjemsta JO. Visible, near infrared, mid
infrared or combined diffuse reflectance spectroscopy for simultaneous assessment of various
soil properties. Geoderma. 2006;131:59-75.https://doi.org/10.1016/j.geoderma.2005.03.007
Viscarra Rossel RA, Webster R. Predicting soil properties from the Australian soil visible-near infrared spectroscopic database. Eur J Soil Sci. 2012;63:848-60. https://doi.org/10.1111/j.1365-2389.2012.01495.x
Vohland M, Besold J, Hill J, Fründ H-C. Comparing different multivariate calibration methods
for the determination of soil organic carbon pools with visible to near infrared spectroscopy. Geoderma. 2011;166:198-255. https://doi.org/10.1016/j.geoderma.2011.08.001
Vohland M, Ludwig M, Thiele-Bruhnb S, Ludwig B. Determination of soil properties with visible
to near- and mid-infrared spectroscopy: effects of spectral variable selection. Geoderma.
2014;223-225:88-96. https://doi.org/10.1016/j.geoderma.2014.01.013
Walkley A, Black IA. An examination of the Degtjareff method for determining soil organic matter, and a proposed modification of the chromic acid titration method. Soil Sci.
1934;37:29-38. http://dx.doi.org/10.1097/00010694-193401000-00003
Williams PC. Variables affecting near-infrared reflectance spectroscopic analysis. In: Williams PC,
Norris K, editors. Near infrared technology in agriculture and food industries. St Paul: American Association of Cereal Chemists; 1987. p. 143-67.
Xiaoting P, Tiezhu S, Aihong S, Yiyun C, Wenxiu G. Estimating soil organic carbon using VIS/NIR spectroscopy with SVMR and SPA methods. Remote Sens. 2014;6:2699-717. https://doi.org/10.3390/rs6042699
Yang XM, Xie HT, Drury CF, Reynolds WD, Yang JY, Zhang XD. Determination of organic carbon and nitrogen in particulate organic matter and particle size fractions of Brookston clay loam soil using infrared spectroscopy. Eur J Soil Sci. 2012;63:177-88. https://doi.org/10.1111/j.1365-2389.2011.01421.x
Zimmermann M, Leifeld J, Furhrer J. Quantification of soil organic carbon fractions by infrared