Artigo
*e-mail: [email protected]
#alternative e-mail: [email protected]
Ni(II), Cu(II), AND Zn(II) COMPLEXES DERIVED FROM A NEW SCHIFF BASE 2-((Z
)-(3-METHYLPYRIDIN-2-YLEIMINO)METHYL)PHENOL AND SYNTHESIS OF NANO SIZED METAL OXIDE PARTICLES FROM THESE COMPOUNDS
Masoumeh Orojloo, Fereshteh Nourian, Raziyeh Arabahmadi and Saeid Amani*,#
Chemistry Department, Faculty of Sciences, Arak University, Dr. Beheshti Ave., Arak 38156-88349, Iran
Recebido em 20/03/2015; aceito em 18/06/2015; publicado na web em 23/07/2015
Synthesis, spectral identification, and magnetic properties of three complexes of Ni(II), Cu(II), and Zn(II) are described. All three compounds have the general formula [M(L)2(H2O)2], where L = deprotonated phenol in the Schiff base 2-((z)-(3-methylpyridin-2-yleimino)methyl)phenol. The three complexes were synthesized in a one-step synthesis and characterized by elemental analysis, Fourier transform infrared spectroscopy, electronic spectra, X-ray diffraction (XRD), and room temperature magnetic moments. The Cu(II) and Ni(II) complexes exhibited room temperature magnetic moments of 1.85 B.M. per copper atom and 2.96 B.M. per nickel atom. The X-band electron spin resonance spectra of a Cu(II) sample in dimethylformamide frozen at 77 K (liquid nitrogen temperature) showed a typical ∆MS = ± 1 transition. The complexes ([M(L)2(H2O)2]) were investigated by the cyclic voltammetry technique, which provided information regarding the electrochemical mechanism of redox behavior of the compounds. Thermal decomposition of the complexes at 750 °C resulted in the formation of metal oxide nanoparticles. XRD analyses indicated that the nanoparticles had a high degree of crystallinity. The average sizes of the nanoparticles were found to be approximately 54.3, 30.1, and 44.4 nm for NiO, CuO, and ZnO, respectively.
Keywords: Schiff base ligand; NiO nanoparticles; CuO nanoparticles; ZnO nanoparticles.
INTRODUCTION
Synthesis and spectral characterization of transition metal complexes with Schiff base as the Ligand has been investigated ex-tensively over the past three decades.1-6 Schiff bases have potential
sites, such as nitrogen and other donors; it may be attributed to their stability and applications in many fields, such as catalysis, analytical, pharmacological, and industrial area.7,8 It has been proved that Schiff
base biologically active compounds indicate greater activity when treated as metal complexes than as freecompounds.9,10 The Schiff
base Ligands and their complexes are known to act as anti-bacterial, anti-cancer and anti-inflammatory activities.11-15 They play important
roles in both synthetic and structural research.16,17 Many Schiff base
complexes exhibit excellent catalytic activity at high temperatures (>100 °C). In last decade, there have been many research reports on their applications in homogeneous and heterogeneous catalysis.18,19
Many transition and non-transition metal complexes with bi, tri- and tetra-dentate Schiff bases containing nitrogen and oxygen donor atoms play important role in biological systems. A few thermo-chemical investigations on a series of Co(II) and Cu(II) complexes has been reported by researchers.20,21 With increase in preparation of
nano--devises with nano-size, more attention has been focused on showing a general procedure to control the size of nano-scale materials.22-25
In last twenty years, considerable attention has been focused to the synthesis of metal oxide nanoparticles because of their unusual properties and potential application in electronic, catalytic and mag-netic materials.26-30 Number of methods have been introduced for the
synthesis of nanoparticles such as photolytic,31,32 solvent extraction,33
micro-emulsion,34 alcohol reduction,35 and thermal decomposition.36
Based on the properties of Schiff bases compounds, we report the synthesis and spectral identification of a new Schiff base2-((z )-(3--methylpyridin-2-yleimino)methyl)phenol (Ligand). Nickel(II),
copper(II) and zinc(II) complexes of this Ligand were prepared in one-step synthesis and their structures were identified by elemental analysis, FTIR spectroscopy, UV-Vis spectroscopy and magnetic moment measurements. Decomposition of the complexes at 750 oC
results high-quality metal oxide (MO) nanoparticles.
EXPERIMENTAL
Chemicals
All the used chemicals were purchased from Merck Chemical Company and were used without further purifications.
Synthesis of Schiff base 2-((z)-(3-methylpyridine-2-yleimino) methyl)phenol; (L)
Ten mmol (1.22 g) salicylaldehyde and ten mmol (1.08 g) 2-ami-no-3-methylpyridine each dissolved in 25 ml CH3OH. The salicylal-dehyde solution was then added slowly to 2-amino-3-methylpyridin solution with few drops of concentrated sulfuric acid. The resulting reaction mixture was refluxed for 3 h and then allowed to cool down at room temperature. By addition of 50 ml distilled water to the mixture, the yellow colored precipitate of Schiff base obtained was filtered and washed with cold ethanol several times (yield: 96%).
Elemental analysis for C13H12N2O; (L); Found: C, 73.29; H, 5.61;
N, 13.53%. Cal.; C, 73.57; H, 5.70; N, 13.28%.
1HNMR (CDCl
3, 300 MHz, ppm) δ:13.74 (1H, s), 9.45 (1H, s),
2.47 (3H, s), 8.35 (1H, d, J= 4.5 Hz), 7.61 (1H, d, J=7.5 Hz), 7.53 (1H, d, J=7.8 Hz), 7.42 (1H, t, J=7.5 Hz), 7.16 (1H, d of d, J=7.2 Hz), 7.04 (1H, d, J= 8.4 Hz), 6.97 (1H, t, J=7.5 HZ)
N NH2
CH3 +
H O
OH
N CH3
N H C
HO MeOH
H+
Synthesis of the complexes
The complexes were prepared according to the following general procedure:
Complex [Cu(L)2(H2O)2]; (C1)
One mmol of copper(II) bromide tetra-hydrate dissolved in 25 ml of CH3OH and 2.1 mmol 2-((z)-(3-methylpyridin-2-yleimino)methyl) phenol (Ligand) dissolved in 25 ml of (C2H5)2O. The Cu(II) bromide
solution was then added slowly to the Ligand solution, preventing any precipitation, filtered to remove any solids. After the solution stood for two days, the brown compound was separated and washed with cold CH3CN several times (yield: 85%).
Elemental analysis for CuC26H26N4O4; (C1); Found: C, 61.19; H, 4.98; N, 11.32; Cu, 12.83%. Cal.; C, 59.82; H, 5.02; N, 10.73; Cu, 12.17%.
Complex [Ni(L)2(H2O)2]; (C2)
One mmol of Nickel(II) bromide tri-hydrate dissolved in 25 ml distilled water and 2.1 mmol of 2-((z)-(3-methylpyridin-2-yleimino) methyl)phenol (Ligand) dissolved in 25 ml of C2H5OC2H5. The Ni(II)
bromide solution was then added slowly to the Ligand solution, pre-venting any precipitation, filtered to remove any solids.37 After the
solution stood for five days, the product was separated and washed with cold CH3CN several times (yield: 79%).
Elemental analysis for NiC26H26N4O4; (C2); Found: C, 62.95; H, 5.34; N, 11.02; Ni, 11.97%. Cal.; C, 60.38; H, 5.07; N, 10.83; Ni, 11.35%.
Complex [Zn(L)2(H2O)2]; (C3)
One mmol of Zn(II) bromide tri-hydrate dissolved in 25 ml dis-tilled water and 2.1 mmol of 2-((z)-(3- methylpyridin-2-yleimino) methyl)phenol (Ligand) dissolved in 25 ml of C2H5-O-C2H5. The
Zn(II) bromide solution was then added slowly to the Ligand solution, preventing any precipitation, filtered to remove any solids. After the solution stood for five days, the product was separated and washed with cold CH3CN several times (yield: 81%).
Elemental analysis for ZnC26H26N4O4; (C3); Found: C, 61.94; H, 5.37; N, 11.53; Zn, 13.04%. Cal.; C, 59.61; H, 5.00; N, 10.69; Zn, 12.48%.
The proposed structure for all three complexes are shown in Figure 1.
PHYSICAL MEASUREMENTS
C, H and N determinations were measured using an Elementar Analysis System Gmb H Vario EL II. Ni, Cu and Zn determina-tions were obtained on a Perkin-Elmer 2380 Atomic Absorption Spectrophotometer. Electronic spectra were recorded on a Perkin-Elmer Lambda 900 spectrophotometer using the diffuse reflectance technique, and MgO was used as a reference. FTIR spectra were car-ried out in the 4000-400 cm−1 range as KBr disks using a Galaxy series
FTIR 5000 spectrophotometer. The spectra were calibrated using polystyrene bands at 3028, 1601 and 1208 cm−1. X-band electron spin
resonance spectra were measured on powders and frozen solutions of the complexes at both room and at liquid nitrogen temperatures in DMF on an IBM electron spin resonance spectrometer using DPPH (g = 2.0036) as a standard. The room temperature magnetic moment of each complex was obtained according to the Evans method. NMR determination was determined on a Bruker 300 MHz spectrometer. The X-ray diffraction measurements were recorded using a Philips X’pert-Pro System. Cyclic voltammeric studies were carried out on a Metrohm 663 VA Stand –Metrohm Autolab.
RESULTS AND DISCUSSION
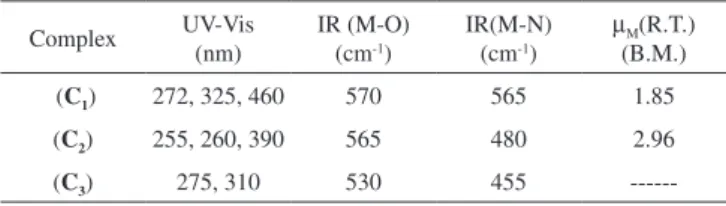
The spectroscopic data for all complexes are shown in Table 1. The electronic spectra of all compounds were obtained from solid state using the diffuse reflectance technique. The electronic spec-trum of the free Ligand shows three high intensity absorption bands at 215, 270 and 320 nm indicating n → π*, π → π* and σ → π* transitions.38-40 The Cu(II) complex (C
1) shows absorption bands at 272, 325 and 460 nm. The first two absorption bands are assigned ton → π*, π → π* and σ → π* transitions and the third band at 460 nm corresponds to 2E
g → 2T2g transition. The Ni(II) complex (C2) indicates absorption bands at 255, 260 and 390 nm. The absorption band at 390 nm is assignable to 3A
2g → 3T2g and band at 260 nm can
be attributed to Ligand → metal charge transfer.41-43 The absorption
band at 255 nm is assignable to n → π* or π → π* transitions. The Zn(II) complex (C3) indicates high intensity absorption bands at 275 and 310 nm are assignable to n → π* or π → π* and Ligand → metal charge transfer, respectively.44,45
The IR spectra of the complexes were compared with those the free Ligandto indicate the interaction of coordination sites with metal ions. Characteristic signals in spectra of the free Ligand and complexes were considered. The peak in the Ligand spectra at 1370 cm-1 due to the deformation of OH group and was disappeared
in the complexes. This indicates deprotonation of phenolic OH, on coordination with metal ion. Peak at 1280 cm-1 corresponds to
phe-nolic ν(C-O) in Ligand spectra shifts to 1338 ± 10 cm-1 in the metal
complexes.46-52 Theappearance of a broadband around 3420 ± 15
cm-1 in the spectra of complexes can be assigned to water molecule
in the complexes. The peak at 700 ± 10 cm-1 ν(-OH rocking), due
to the presence of coordinated water molecule in complexes. The new peaks of weak intensity observed at 550 ± 20 and 480 ± 15 cm-1
in the spectra of complexes, are attributed to ν(M-O) and ν(M-N) mode, respectively.53-58 The magnetic moments of both complexes (C
1 and C2) were determined by the Evans method.59,60 This method is based on the principle that the position of a given proton resonance (t-butyl alcohol) in the spectrum of a molecule is dependent on the bulk susceptibility of the medium. The shift of a proton resonance line of an inert substance due to the presence of paramagnetic ions is given by theoretical expression (1):
∆υ/υo = (2π/3)(χυ – χυ') (1)
N
CH3
N HC
O M
H2O
N
CH3
N C H
O M
OH2
Figure 1. Proposed structure for all three complexes
Table 1. Spectroscopic data for all three complexes Complex UV-Vis
(nm)
IR (M-O) (cm-1)
IR(M-N) (cm-1)
µM(R.T.) (B.M.) (C1) 272, 325, 460 570 565 1.85
(C2) 255, 260, 390 565 480 2.96
---In this equation ∆υ is the shift of υo(frequency) in the applied field,
χυ is the volume susceptibility of the solution containing paramagnetic
ions and χυ’ is the volume susceptibility of the reference solution. The
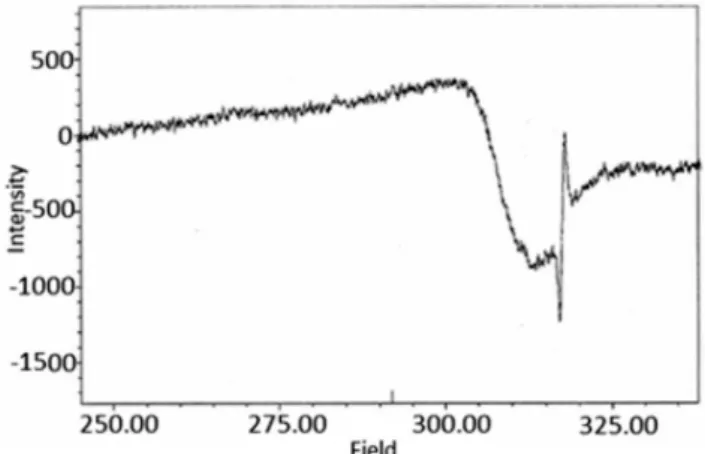
value of 1.85 and 2.96 B.M. were found for (C1) and (C2), respecti-vely. The electron spin resonance (ESR) spectra of Cu(II) complex as powder (Figure 2) and frozen solution (Figure 3) were measured in X-band frequencies at room and liquid nitrogen temperatures to provide evidence for the ground-state configuration of copper(II) ions. In the solid state, only a weak and broad signal with gav. = 2.23
were found indicating the presence of unpaired electron in the dx2-y2
orbital of copper(II) ion. The gav. value is closed to those reported for
a number of distorted copper(II) complexes. Moreover, the observed gav. value is ≤ 2.3 suggesting a covalent nature of metal-Ligand bonds
in the complex.61-63 Such behavior is also reported in the literature.64,65 The frozen solution of the complex was obtained in DMF at liquid
nitrogen temperature. The spectral features of the complex show four fairly resolved hyperfine lines (63,65Cu, I = 3/2) corresponding
to -3/2, -1/2, 1/2, 3/2 transitions. The signal corresponding to MI = 3/2 splits into five peaks with a superhyperfine constant A ≈ 15 G in the spectra of complex indicates each Cu(II) ion has two nitrogen atoms.66 In the parallel region, three of the four copper hyperfine lines
are well resolved while perpendicular features overlap the fourth one. The analysis of the parallel part of the spectra, the line width of the MI = 3/2, component is small compared with the nitrogen coupling constants, leading to the appearance of a nitrogen superhyperfine pattern. The splitting in the perpendicular region of the spectra can be attributed to interaction of an unpaired electron spin with the copper nuclear spin and two 14N (I = 1) donor nuclei. The smaller g
ll values
for the complexes indicated delocalization of the unpaired electron spin density away from the copper nucleus and may be interpreted in terms of the increased covalency of the Cu-L bond.67-68 Kivelson
and Neiman69 have reported that g
ll values ≤2.3 indicate considerable
covalent character to M-L bonds and >2.3 indicate ionic character. The gll value of the complex is found to be ≤2.34, which indicates
considerable covalent character to the Cu-L bond. The spin para-meters for the copper complex (C1) are calculated from the spectra. The observed data (All = 150; gll = 2.34 >g⊥ = 2.08) indicates that the complex is axially elongated octahedral geometry. Furthermore, it is also supported from the fact that the unpaired electron lies pre-dominantly in the dx2-y2 orbital. Dutton et al. reported that g
ll is 2.4
for copper-oxygen bonds, 2.3 for copper-nitrogen bonds. For mixed copper-nitrogen and copper-oxygen system, there is a small variation inthe point symmetry from octahedral geometry.70
The cyclic voltammetric behavior of copper(II) complex (0.002 mol) (Figure 4) was studied in 0.1 mol tetramethylammo-nium nitrate (TMAN) in DMSO at room temperature, in potential range -1.4 to +0.1 V with a scan rate of 100 mVs-1. The complex
shows a quasi-reversible signal in the negative region, characteristic of the Cu(II) → Cu(I) couple at Epc = -0.880 V. The anodic peak at Epa = -0.529 V is for Cu(I) → Cu(II) oxidation. The reversible
behavior indicates that both Cu(II) and Cu(I) complexes of the Schiff base are stable in DMSO at the electrode surface.71 Nickel(II)
complex (0.002 mol), was studied in 0.1 (TMAN) in DMSO at room temperature, in potential range -1.4 to +0.1 V with a scan rate of 100 mVs-1. The reduction wave (Ep
c = -0.765 V) belongs to
Ni(II) → Ni(I) reaction is obtained in the cathodic potential region. The peak at Epa = -0.567 V, is assignable to Ni(I) → Ni(II) oxida-tion.72 The cyclic voltammogram of zinc(II) complex (0.002 mol),
was studied in 0.1 (TMAN) in DMSO at room temperature, in potential range -1.4 to +0.8 V with a scan rate of 100 mVs-1, in the
absence of molecular oxygen. The voltammogram shows quasi--reversible one-electron process. An interesting feature has been observed in the cyclic voltammogram of the zinc(II) complex. During the forward scan it shows two cathodic reduction peaks, first at +0.34 V and second at -0.811 V which are attributed to reduction of Zn(II) → Zn(I) and Zinc(I) → Zn(0), respectively. During the reverse scan it shows two anodic oxidation peaks, one at -0.582 V and another at +0.65 V which are assignable to oxidation Zinc(0) → Zn(1) and Zinc(I) → Zn(II), respectively.73-75
The X-ray diffraction measurements were obtained using a Philips X’pert-Pro System powder diffractometer with Bragg-Brentano geometry in continuous mode with a scanning speed of 1/2o/min.
A Cu Kα radiation tube with line focus was operated at 40 kV and 30 mA. The X-ray powder diffraction patterns were obtained in the range of 15-90o, in steps of 0.02o. The crystalline phase were
identi-fied by using the International Center for Diffraction Data (ICDD) catalogue. Rietveld refinement76 procedures were performed for all
diffraction patterns using the DBWS9807, as described by Young and Wiles.77 The full width at the half- maximum (FWHM) of the
Figure 2. ESR spectra of complex (C1) in solid state at room temperature
Figure 3. ESR spectra of complex (C1) in DMF at liquid nitrogen temperature
diffraction peaks obtained from the refinement was used to calculate the particle size. The pseudo-Voigt function was selected to fit the peak profiles of the identified crystalline phases. Asymmetry coef-ficients, scale factors and lattice parameters for each phase and the background polynomial parameters were simultaneously refined. The X-ray diffraction data were determined by sing Cu Kα radiation (λ = 1.4506 Å). The average size of the samples was calculated with the help of the Debye-Scherrer equation (2)
D = (0.9λ)/ (βCos(θ)) (2)
where λ is the wavelength (Cu Kα), β is the full width at the half-maximum (FWHM) of the metal oxide line and (θ) is the diffraction angle. The diffraction peaks indicate that the synthesized materials are in the nanometer range.
Figure 5 shows the XRD pattern of the NiO particles prepared bythermal decomposition of [Ni(L)2(H2O)2], (C2) complex. Pure
NiO particles having average size 54.3 nm have been prepared by decomposition of the (C2) complex at 750 oC for 2 hours. The powders
showed the crystalline pattern. According to the standard NiO pattern [JCPDS: 75-0197]78,79 all diffraction peaks can be well indexed as
face-centered cubic phase at about 2θ = 37.2666, 43.2978, 62.8550, 75.6371, and 79.6066 which are assignable to [111], [200], [220], [311], and [222] crystal planes, respectively. The size of the particles was calculated by using equation (2). The average particles size was about 54.3 nm. Figure 6 shows the X-ray diffraction studies on zinc oxide obtained from [Zn(L)2(H2O)2], (C3) complex at 750 oC. The
data confirmed that the synthesized materials were ZnO with wurtzite phase. All the diffraction peaks agreed with the reported [80-0074,
JCPDS] data; no considerable peaks were observed other than ZnO.80
The pattern of peaks, confirms the common ZnO hexagonal phase, i.e., wrutzite structure. The 2θ = 31.7660, 34.4438, 36.2561, 47.5464, 56.5645, 62.8474, 66.3215, 67.9047, 69.0290, 72.5845 and 76.9029 which can be perfectly attributed to [100], [002], [101], [102], [110], [103], [200], [212], [201], [004] and [202] crystal planes, respectively. The average ZnO particles size was about 44.4 nm. Figure 7 shows the XRD pattern of the CuO particles. The structure of the copper oxide particles obtained from [Cu(L)2(H2O)2], (C1) complex at 750 oC was
analyzed by X-ray diffraction studies. The 2θ= 35.4948, 36.3770, 38.7554, 42.2714, 48.5200, 53.8507, 58.2227, 61.4612, 66.0129, and 68.1294 which are assignable to [110], [ī11], [111], [200], [02], [020], [202], [10] and [220] crystal planes, respectively. The average size of the particles was about 30.1 nm.
CONCLUSION
Synthesis and spectroscopic characterization of Ni(II), Cu(II) and Zn(II) complexes with a new Schiff base 2-((z )-(3-methylpyridin-2-yleimino)methyl)phenol are described. All the three compounds have the general formula [M(L)2(H2O)2] where L = deprotonated phenol in the Schiff base 2-((z)methylpyridinyleimino)methyl)phenol; (Ligand). All three complexes have been synthesized in a one pot synthesis and characterized by elemental analysis, infrared spectra, electronic spectra, cyclic voltammetry, room temperature magnetic moments and X-ray diffraction. Copper(II) complex shows room temperature magnetic moment of 1.85 B.M. per copper atom and Nickel (II) complex 2.96 B.M. per nickel atom. The complexes show a peak in the negative re-gion, characteristic of the M(II) → M(I) at Epc = -0.880 V and -0.765 V for Cu(II) and Ni(II), respectively, with associated anodic peak at Epa = -0.529 V for Cu(I) → Cu(II) oxidation. The anodic peak at Epa = -0.567 V, is related to Ni(I) → Ni(II) oxidation. During the forward scan of Zn(II), it shows two cathodic reduction peaks, first at +0.34 V and second at -0.811 V which can be attributed to the reduction of Zn(II) → Zn(I) and Zinc(I) → Zn(0), respectively. The reverse scan for zinc oxidation, it shows two anodic oxidation peaks, one at -0.582 V and another at +0.65 V which can be assigned to the oxidation of Zinc(0) → Zn(1) and Zinc(I) → Zn(II), respectively. Decomposition of the complexes at 750 oC was analyzed with X-ray diffraction absorption
and the particles size for NiO, CuO and ZnO are in the range of 30 to 80.19 to 40 and 29 to 64 nm, respectively.
ACKNOWLEDGMENTS
The authors would like to thank the research council of Arak University for financial support of this research.
Figure 5. XRD spectra for NiO nanoparticles
Figure 6. XRD spectra for ZnO nanoparticles
REFERENCES
1. Mishra, A. P.; Sharma, N.; Jain, R. K.; Av. Quim. 2012, 7, 77. 2. Chandra, S.; Jain, D.; Sharma, A.; Sharma, P.; Molecules 2009, 14, 174. 3. Malik, S.; Ghosh, S.; Mitu, L.; J. Serb. Chem. Soc. 2011, 76, 1387. 4. Djebbar, S. S.; Benali, B. O.; Deloume, J. P.; Polyhedron 1997, 16, 2175. 5. Bhattachayya, P.; Parr, J.; Ross, A. J.; J. Chem. Soc., Dalton Trans. 1998,
3149.
6. Oritz, B.; Park, S. M.; Bull. Korean Chem. Soc. 2000, 21, 1465. 7. Maurya, R. C.; Patel, P.; Spectrosc. Lett. 1999, 32, 213. 8. Westcott, S. A.; Transition Met. Chem. 2005, 30, 411. 9. De Clercq, B.; Verpoort, F.; Macromolecules 2002, 35, 8943. 10. Mishra, L.; Singh, V. K.; Ind. J. Chem. 1993, 32, 446.
11. Bhowon, M. G.; Wah, H. L. K.; Narain, R.; Polyhedron 1998, 18, 341. 12. Kumar, G.; Kumar, D.; Devi, S.; Johari, R.; Singh, C. P.; Eur. J. Med.
Chem. 2010, 45, 3062.
13. Vanco, J.; Marek, J.; Travincek, Z.; Racanska, E.; Svajlenova, O.; J. Inorg. Biochem. 2008, 102, 595.
14. Wermuth, C. G. I.; J. Med. Chem. 2003, 47, 1303.
15. Bera, P.; Saha, N.; Kumar, S.; Baneeja, D.; Bhattacharya, R.; Transition Met. Chem. 1999, 24, 425.
16. Espinet, P.; Esteruelas, M. A.; Ore, L. A.; Sarrano, J. L.; Sola, E.; Coord. Chem. Rev. 1992, 117, 215.
17. Naeimi, H.; Safari, J.; Heidarnezhad, A.; Dyes Pigm. 2007, 73, 251. 18. Lippard, S. J.; Berg, J. M.; Principles of Bioinorganic Chemistry,
Uni-versity Science Books: Mill Valley, 1994, pp. 1–160.
19. Allan, J. R.; Milburn, G. H. W.; Richmond, F.; Wilson, A. S.; Gerrared, D. L.; Bimie, J.; Thermochim. Acta 1990, 170, 147.
20. Thornton, D. A.; Verhoeven, P. F. A.; Thermochim. Acta 1987, 113, 161. 21. Puntes, V. F.; Krishnan, K. M.; Alivisatos, A. P.; Science 2001, 291,
2115.
22. Sun, S.; Murray, C. B.; Weller, D.; Folks, L.; Moser, A.; Science 2000, 287, 1989.
23. Sambandam, A.; Lee, G-J.; Wu, J.; Ultrason. Sonochem. 2012, 19, 682. 24. Zhou, K.; Wang, R.; Xu, B.; Li, Y.; Nanotechnology 2006, 17, 3939. 25. Beecroft, L. L.; Ober, C. K.; Chem. Mater. 1997, 9, 1302. 26. Fendler, J. H.; Chem. Rev. 1987, 87, 877.
27. Prashant, A.; Kamat, V.; Chem. Rev. 1993, 93, 267. 28. Schmid, G.; Chem. Rev. 1992, 92, 1709.
29. Toshimaand, N.; Yonezawa, T.; New J. Chem. 1998, 22, 1179. 30. Belloni, J.; Mostafavi, M.; Remita, H.; Marignier, J-L.; New J. Chem.
1998, 22, 1239.
31. Hodak, J. H.; Henglein, A.; Hartland, G. V.; J. Phys. Chem. B 2000, 104, 9954.
32. Brust, M.; Walker, M.; Bethell, D.; Schiffrin, D. J.; Whyman, R.; J. Chem. Soc., Chem. Commun. 1994, 801.
33. Mohammadi-Samani, S.; Miri, R.; Salmanpour, M.; Khalighian, N.; Sotoudeh, S.; Erfani, N.; Res. Pharm. Sci. 2013, 8, 25.
34. Mojahedian, M. M.; Daneshamouz, S.; Samani, S. M.; Zargaran, A.; Chem. Phys. Lipids 2013, 174, 32.
35. Hah, H. J.; Koo, S. M.; Lee, S. H.; J. Sol-Gel Sci. Technol. 2003, 26, 467.
36. Chin, S. F.; Pang, S. C.; Tan, C. H.; J. Mater. Environ. Sci. 2011, 2, 299. 37. Yamada, S.; Yamauochi, K.; Bull. Chem. Soc. Jpn. 1969, 42, 2562. 38. Bencini, A.; Gatteschi, D.; Zanchini, C.; Haase, W.; Inorg. Chem. 1985,
24, 3485.
39. Lever, A. B. P.; In Inorganic Electronic Spectroscopy, 2nd ed., Elsevier, Amsterdam, 1984.
40. Hathaway, B. J.; Struct Bond. 1984, 57, 55.
41. Kida, S.; Nishida, Y.; Sakamoto, M.; Bull. Chem. Soc. Jpn. 1973, 46, 3228.
42. Ghargava, B. P.; Bembi, R.; Tyagu, M.; J. Indian Chem. Soc. 1983, 60, 214.
43. Lee, J. D.; Concise Inorganic Chemistry, 5th ed., Blackwell Science Publishers: Oxford, 1999.
44. Singh, H. R.; Agarwala, B. V.; J. Indian Chem. Soc. 1988, 65, 591. 45. Maurya, R. C.; Patel, P.; Spectrosc. Lett. 1999, 32, 213.
46. Dubey, R.; Dubey, U.; Mishra, C.; Indian J. Chem., Sect. A: Inorg., Bio-inorg., Phys., Theor. Anal. Chem. 2008, 47, 1208.
47. Nakamoto, K.; Infrared and Raman Spectra of Inorganic Coordination Compounds, 5th ed., John Wiley & Sons; New York, 1998.
48. Neelakantan, M.; Marriappan., S.; Dharmaraja, J.; Jeyakumar, T.; Spec-trochim. Acta A 2008, 71, 628.
49. Mohamed, G.; Omar, M.; Hindy, A.; Turk J. Chem. 2006, 30, 361. 50. Al-Hashemi, R.; Safari, N.; Amani, S.; Amani, V.; Abedi, A.; Khavasi,
H. R.; Weng Ng, S.; J. Coord. Chem. 2010, 63, 3207.
51. Amani, S.; Van Albada, G. A.; Mutikainen, I.; Trupinen, U.; Reedijk, J.; Polyhedron 1999, 18, 1991.
52. Hasanvand, F.; Nasrollahi, N.; Vajed, A.; Amani, S.; Malaysian Journal of Chemistry 2010, 12, 27.
53. Amani, S.; Van Albada, G. A.; Kooijman, H.; Speck, A. L.; Reedijk, J.; Inorg. Chim. Acta 1999, 287, 226.
54. Hasanvand, F.; Hoseinzadeh, A.; Zolgharnein, J.; Amani, S.; J. Coord. Chem. 2010, 63, 346.
55. Al-Hashemi N. Safari, N.; Amani, S.; Amani, V.; Khavasi, H. R.; Poly-hedron 2010, 29, 2409.
56. Pate, J. E.; Cruse, R. W.; Karlin, K. D.; Solomon, E. I.; J. Am. Chem. Soc. 1987, 109, 2624.
57. Drew, G. B.; Yates, P. C.; J. Chem. Soc., Dalton Trans. 1988, 2995. 58. Mabbs, F. E.; Chem. Soc. Rev. 1993, 22, 313.
59. Evans, D. F.; J. Chem. Soc. 1959, 2003.
60. Arab Ahmadi, R.; Safari, N.; Khavasi, H. K.; Amani, S.; J. Coord. Chem. 2011, 67, 2056.
61. Manzur, J.; Mora, H.; Vega, A.; Spodine, E.; Venagas-Yazigi, D.; Gar-land, M. T.; El Fallah, M. S.; Escure, E.; Inorg. Chem. 2007, 46, 6924. 62. Kovala-Demertzi, D.; Skrzypek, D.; Szymanska, B.; Galani, A.;
De-mertzis, M. A.; Inorg. Chim. Acta 2005, 358, 186.
63. Maki, A. H.; McGarvey, B. R.; J. Chem. Phys. 1958, 29, 31. 64. Maki, A. H.; McGarvey, B. R.; J. Chem. Phys. 1958, 29, 35.
65. Hathaway, B. H.; In Comprehensive Coordination Chemistry: The Synthesis, Reactions, Properties & Application of Coordination Com-pounds, Wilkinson, G.; Gilard, R. D.; McCleverty, J. A., eds.; Pergamon: Oxford, 1987.
66. Growford, V. H.; Hatfield, W. E.; Inorg. Chem. 1977, 16, 1336. 67. Abragam, A.; Bleaney, B.; Electron Paramagnetic Resonance of
Transi-tion Ions, Clarendon Press: London, 1970, pp. 492- 498.
68. Dutton, K. G.; Fallon, G. D.; Tharmaraj, K. S. P.; Kodimunthiri, D.; Sheela, C. D.; Prakash, P.; J. Coord. Chem. 2009, 62, 1347.
69. Kivelson, D.; Neiman, R.; J. Chem. Phys. 1961, 35, 149.
70. Dutton, K. G.; Fallon, G. D.; Murray, K. S.; Inorg. Chem. 1988, 27, 34. 71. Shirin, Z.; Mukherjee, R. M.; Polyhedron 1992, 11, 2625.
72. Anthonysamy, A.; Balasubramanian, S.; Inorg. Chem. Commun. 2005, 8, 908.
73. Azevedo, F.; Freier, C.; de Castro, B.; Polyhedron 2002, 21, 1695. 74. Zolezzi, S.; Spodine, E.; Decinti, A.; Polyhedron 2002, 21, 55. 75. Bottcher, A.; Takeuchi, T.; Hardcastle, I.; Mead, T. J.; Gray, H. B.;
Cwikel, D.; Kapon, M.; Dori, Z.; Inorg. Chem. 1997, 36, 2498. 76. Rietveld, H. M.; Acta Crystallogr. 1967, 22, 151.
77. Young, R. A.; Wiles, D. B.; J. Appl. Crystallogr. 1982, 15, 430. 78. Saha, S.; Kottalanka, R. K.; Bhowmik, P.; Jana, S.; Harms, K.; Panda,
T. K.; Challopadhyay, S.; Nayek, H. P.; J. Mol. Struct. 2014, 26, 1061. 79. Khalaji, A. D.; Das, D.; Int. Nano. Lett. 2014, 4, 117.
![Figure 5 shows the XRD pattern of the NiO particles prepared bythermal decomposition of [Ni(L) 2 (H 2 O) 2 ], (C2) complex](https://thumb-eu.123doks.com/thumbv2/123dok_br/18986414.459032/4.892.465.781.92.332/figure-shows-pattern-particles-prepared-bythermal-decomposition-complex.webp)
