Effects of mycotoxin adsorbents in aflatoxin B
1- and fumonisin B
1-contaminated
broiler diet on performance and blood metabolite
Sérgio Turra Sobrane Filho1, Otto Mack Junqueira2, Antonio Carlos de Laurentiz3, Rosemeire
da Silva Filardi3, Marcela da Silva Rubio1, Karina Ferreira Duarte4, Rosangela da Silva de Laurentiz5
1 Universidade Estadual Paulista “Júlio de Mesquita Filho”, Faculdade de Engenharia, Programa de Pós-graduação em Ciência e Tecnologia Animal, Ilha Solteira, SP, Brazil.
2 Universidade Federal de Goiás, Jataí, GO, Brazil.
3 Universidade Estadual Paulista “Júlio de Mesquita Filho”, Faculdade de Engenharia, Departamento de Biologia e Zootecnia, Ilha Solteira, SP, Brazil. 4 Universidade Estadual Paulista “Júlio de Mesquita Filho”, Faculdade de Ciências Agrárias e Veterinárias, Departamento de Zootecnia, Jaboticabal, SP,
Brazil.
5 Universidade Estadual Paulista “Júlio de Mesquita Filho”, Faculdade de Engenharia, Departamento de Física e Química, Ilha Solteira, SP, Brazil.
ABSTRACT - The present study examined the effect of aflatoxin (AFB1) and fumonisin (FB1) at the levels of 2 mg kg−1 AFB 1
and 100 mg kg−1 FB
1 and the efficiency of use of different levels of adsorbent based on sodium and calcium aluminosilicate on
growth performance, hematological parameters, and biochemical parameters of broilers. A total of 1,440 Cobb broilers were distributed into the following treatments: positive control (PC) - no mycotoxin and adsorbent (AD); PC+3AD - no mycotoxin, with 3 g kg−1 adsorbent in feed; negative control (NC) - only mycotoxin; NC+1AD - with mycotoxin and 1 g kg−1 adsorbent in
feed; NC+2AD - with mycotoxin and 2 g kg−1 adsorbent in feed; and NC+3AD - with mycotoxin and 3 g kg−1 adsorbent in feed.
The amounts of AFB1 and FB1 added to NC reduced weight gain (35%) and feed intake (50%) compared with PC; however, inclusion of 2 or 3 g kg−1 adsorbent to NC alleviated such losses. Birds fed NC showed anemia, immunosuppression, and
impaired liver function, observed by reduced cholesterol and increased gamma glutamyl-transferase activity compared with PC; values returned to normal levels when 2 or 3 g kg−1 of the adsorbent (as fed) were used. Mycotoxins cause adverse effects
on most of the parameters studied, and the use of adsorbent at the levels of 2 and 3 g kg−1 of the adsorbent as fed partially
negates the adverse effect of mycotoxicosis.
Key Words: biochemical parameter, feeding, growth performance, hematological parameter mycotoxicosis, mycotoxins
ISSN 1806-9290
www.sbz.org.br R. Bras. Zootec., 45(5):250-256, 2016
Received June 28, 2015 and accepted January 23, 2016. Corresponding author: [email protected] http://dx.doi.org/10.1590/S1806-92902016000500007
Copyright © 2016 Sociedade Brasileira de Zootecnia. This is an Open Access article distributed under the terms of the Creative Commons Attribution License (http://creativecommons.org/licenses/by/4.0/), which permits unrestricted use, distribution, and reproduction in any medium, provided the original work is properly cited.
Introduction
Mycotoxins are bioactive secondary metabolites produced by fungi growing in food products, and cause diverse toxic effects in vertebrates (Leeson et al., 1995). The exposure to fungal toxins occurs primarily through ingestion of contaminated grains (corn, wheat, peanuts, sorghum, etc.) used to formulate diets (Gimeno and Martins, 2011).
Aflatoxins cause huge economic losses in the poultry industry worldwide, and concentrations in feed above 75 μg kg−1 reduce the performance of birds (Gimeno
and Martins, 2011). These aflatoxins are produced by Aspergillus fungi, among which the most relevant are A. flavus and A. parasiticus (Leeson et al., 1995; Yunus
et al., 2011). Several compounds are known, but B1, G1,
B2, and G2 aflatoxins have significant toxicity (Goldblatt,
2012). According to Yunus et al. (2011), aflatoxin poisoning reduces animal performance and causes liver, kidney, and reproductive problems.
Fumonisins are produced by fungi of the genus Fusarium, mainly F. verticillioides and F. proliferatum, usually associated with diseases such as equine leukoencephalomalacia and porcine pulmonary edema (Gimeno and Martins, 2011). Fumonisins B1, B2, and B3 are
the main compounds of this group, with potential toxicity respective to their numbering. In poultry farming, levels above 100 mg kg−1 cause diarrhea, decreased feed intake and
weight gain, increased liver and kidney weight, andhepatic necrosis (Minami et al., 2004).
Adsorbents based on hydrated sodium calcium aluminosilicate (HSCAS) are derived from zeolites and have negative charges. As aflatoxins have a strongly positive charge, they are easily adsorbed by HSCAS. However, the HSCAS may also bind to other dietary components such as some vitamins and minerals and reduce their availability (Gimeno and Martins, 2011).
The objective of this study was to evaluate the effects of combining aflatoxin (2 mg kg−1) with fumonisin (100 mg kg−1)
and the use of different levels of HSCAS to inhibit the intestinal absorption of aflatoxin and fumonisin in 22-42-day-old broilers.
Material and Methods
The experimental procedures were assessed and certified by the Ethics Committee on Animal Experimentation of Universidade Estadual Paulista (UNESP) - FEIS, document no. 05/2013. The experiment was conducted in the city of Ilha Solteira/SP, Brazil, and was divided into two phases: pre-trial phase (1-21 days old) and trial phase (22-42 days old). During the pre-trial and trial phases, the birds were kept in a deep litter system in an open-sided shed.
In the pre-trial phase, 1660 male Cobb chicks received a diet without mycotoxins, formulated to meet the nutritional requirements of the birds. At 22 days of age, 1440 birds were selected based on the average weight (880 g±10 g) and distributed in a completely randomized design, consisting of six treatments with eight replicates of 30 birds each. The treatments were: positive control (PC) - no mycotoxin and adsorbent (AD); PC+3AD - no mycotoxin and 3 g kg−1
adsorbent in feed; negative control (NC) - only mycotoxin (2 mg kg−1 AFB
1 and 100 mg kg−1 FB1); NC+1AD - with
mycotoxin (2 mg kg−1 AFB
1 and 100 mg kg−1 FB1) and 1 g kg−1
adsorbent in feed; NC + 2AD - with mycotoxin (2 mg kg−1
AFB1 and 100 mg kg−1 FB
1) and 2 g kg−1 adsorbent in feed; and
NC + 3AD - with mycotoxin (2 mg kg−1 AFB
1 and 100 mg kg−1
FB1) and 3 g kg−1 adsorbent in feed.
Aflatoxin B1 (AFB1), fumonisin B1 (FB1), and the
adsorbent were provided by a commercial company. Aspergillus flavus was grown on rice substrate for the production of aflatoxin B1, according to Shotwell et al. (1966), which was extracted from the culture medium using chloroform. The extract was subjected to complete solvent evaporation and resuspended in sterile corn oil as described by Tessari et al. (2006), forming a suspension containing amounts of 0.68 mg mL−1 AFB
1 and 0.01 mg mL−1
aflatoxin B2.
Strains of Fusarium verticillioides were grown on corn substrate to produce FB1, according to the procedures
described by Weibking et al. (1993). The concentration of FB1 achieved was 5,500 mg kg−1 and 3,400 mg kg−1
fumonisin B2.
Next, 3 mL kg−1 solution containing AFB
1 and 18 g kg−1
of the material containing FB1 wereadded. Feed was mixed
with aflatoxin and fumonisin with a Y-mixer for 12 min. Eight samples of the feed were taken for confirmation of levels of AFB1 and FB1 through the techniques described
by Soares and Rodriguez-Amaya (1989) and Shephard et al. (1990), respectively. The levels found were 1.76±0.52 mg kg−1
AFB1 and 96.89±0.93 mg kg−1 FB1.
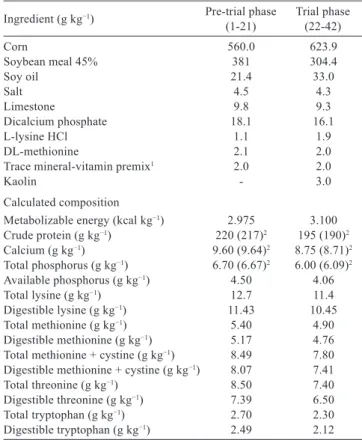
The diets used in the periods of 1-21 days and 22-42 days (Table 1) were formulated based on food composition and nutritional requirements proposed by Rostagno et al. (2011).
Broiler performance was evaluated at 42 days of age by weight gain, feed intake, feed conversion, and mortality. Mortality was recorded daily, and birds with leg problems were discarded over the course of the experiment and counted as dead. Mortality datas were corrected by the following formula:
Corrected mortality = sin−1 [(mortality/100)−2] + 0.05
Table 1 - Centesimal and calculated composition of the diets given in the periods of 1-21 and 22-42 days of age
Ingredient (g kg−1) Pre-trial phase
(1-21) Trial phase(22-42)
Corn 560.0 623.9
Soybean meal 45% 381 304.4
Soy oil 21.4 33.0
Salt 4.5 4.3
Limestone 9.8 9.3
Dicalcium phosphate 18.1 16.1
L-lysine HCl 1.1 1.9
DL-methionine 2.1 2.0
Trace mineral-vitamin premix1 2.0 2.0
Kaolin - 3.0
Calculated composition
Metabolizable energy (kcal kg−1) 2.975 3.100
Crude protein (g kg−1) 220 (217)2 195 (190)2
Calcium (g kg−1) 9.60 (9.64)2 8.75 (8.71)2
Total phosphorus (g kg−1) 6.70 (6.67)2 6.00 (6.09)2
Available phosphorus (g kg−1) 4.50 4.06
Total lysine (g kg−1) 12.7 11.4
Digestible lysine (g kg−1) 11.43 10.45
Total methionine (g kg−1) 5.40 4.90
Digestible methionine (g kg−1) 5.17 4.76
Total methionine + cystine (g kg−1) 8.49 7.80
Digestible methionine + cystine (g kg−1) 8.07 7.41
Total threonine (g kg−1) 8.50 7.40
Digestible threonine (g kg−1) 7.39 6.50
Total tryptophan (g kg−1) 2.70 2.30
Digestible tryptophan (g kg−1) 2.49 2.12 1 Supplied the following per kilogram of diet: vit. A - 8,000 IU; vit. D3 - 2,000 IU;
vit. E - 20 mg; vit. K3 - 2 mg; vit. B1 - 1.5 mg; vit. B2 - 4 mg; vit. B6 - 12 mg, vit. B12 - 15 mcg; folic acid - 0.6 mg; pantothenic acid - 10 mg; niacin - 30 mg; biotin - 0.1 mg; choline chloride - 300 mg; Fe - 50 mg; Cu - 10 mg; Zn - 70 mg; Mn - 100 mg; I - 1 mg; Se - 0.3 mg; antioxidant - 50 mg; anticoccidial - 80 mg; growth promoter - 80 mg.
At the end of 42 days of life, two birds were randomly taken from each of the 48 plots, totaling 96 birds for the collection of blood by cardiac puncture with removal of approximately 6 mL of blood, without anticoagulant. After centrifugation at 6,500 rpm for 6 min, the serum was removed by using an automatic pipette and stored in a 2 mL Eppendorf tube at −20 °C for later biochemical analysis. Urea, creatinine, uric acid, triglycerides, cholesterol, and gamma glutamyl-transferase (GGT) were analyzed using a Sinnowa SX-3000M® semi-automatic biochemical analyzer
and Labtest® serological kits.
At the 43rd experimental day, 3 mL of blood were taken by cardiac puncture from two birds per experimental plot, with anticoagulant, for blood count and leukocyte count according to the methodology of Jain (1993). Hematocrit was determined using the microhematocrit method; hemoglobin by the cyanmethemoglobin method; and the Wintrobe indices (mean corpuscular hemoglobin - MCH, mean corpuscular volume - MCV, and mean corpuscular hemoglobin concentration - MCHC) were calculated by standard formulas. For leukocyte count, we used the procedure with Natt-Herrick solution, in a Neubauer chamber, counting only the cells at the small central squares, and multiplying the result by 120. Leukocyte differential count was performed on blood smears, stained with hematoxylin-eosin (Panoptic LB), and slides were analyzed under optical microscope with oil immersion objective. Leukocyte count was classified as granular (heterophils, eosinophils, and basophils) and non-granular (lymphocytes and monocytes), and thrombocytes were counted separately.
Data were subjected to analysis of variance using SISVAR 5.1 (Ferreira, 2011), and in case of statistical significance, means were compared by the SNK test at 5% probability.
Results and Discussion
Feed intake and weight gain (Table 2) were significantly different between treatments (P<0.01), and the values were lower in treatment NC (negative control), as expected, with declines of 50 and 35%, respectively, when compared with PC (positive control). These reductions were due to the high absorption of AFB1 and FB1 by the gastrointestinal tract. The metabolism of these compounds in the liver generates toxic metabolites that cause liver injury and inhibition of protein synthesis, culminating in anorexia, as also reported by Minami et al. (2004) and Yunus et al. (2011).
Studies using only AFB1 and others with FB1 have
demonstrated the impact of these mycotoxins on animal
performance. As FB1 has neurotoxic effects, most studies
are carried out in the initial rearing phase, because birds at this stage present an intense development process, and the harmful effects are more expressive (Ledoux et al., 1992). Rauber et al. (2013) studied contamination levels of 100 and 200 mg kg−1 FB
1 in chickens with 1 to 28 days
of age and found losses of up to 18% in weight gain of the animals receiving the highest level of FB1 compared with
the treatment without mycotoxin. The authors observed a reduction of over 30% in feed intake.
Miazzo et al. (2000) used levels of 2.5 mg kg−1 of AFB 1
and reported an 11% reduction in weight gain of broilers from 21 to 42 days. In this study, the highest reductions can be associated with the combination of the two mycotoxins, as evidenced by Miazzo et al. (2005), who used levels of 2.5 mg kg−1 of AFB
1 and 200 mg kg−1 of FB1, alone and in
combination, in diets for broilers from 29 to 50 days, and observed a 28% reduction in weight gain in the treatment with the combination of the two mycotoxins, compared with the treatment without mycotoxins. This value was higher than those of treatments with mycotoxins separately, indicating a synergistic effect.
The feed:gain ratio (Table 2) was significantly different between treatments (P<0.01). The lower feed:gain ratio with NC is mainly related to the drastic decrease in feed intake (51% in relation to PC), without causing the same decrease in weight gain (35% in relation PC). This was also reported by Lopes et al. (2006), who evaluated the inclusion of aflatoxin (2.5 mg kg−1 AFB
1) in the diet of chickens from 1 to
42 days. Therefore, the feed:gain ratio can lead to erroneous assessment. However, the inclusion of HSCAS minimizes the deleterious effect of the mycotoxins on feed:gain ratio (P<0.05).
Among the adsorbent levels, only 2 and 3 g kg−1 were
effective in minimizing the absorption of mycotoxins,
Table 2 - Growth performance and mortality of broilers fed diets containing mycotoxins (aflatoxin + fumonisin) and HSCAS
Treatment Feed intake(g) Weight gain(g) Feed:gain(g) Mortality(%)
PC 3169a 1685a 1.881a 5.13±3.72c PC+3AD 3197a 1688a 1.894a 5±3.53c NC 1551d 1093c 1.419c 20.13±9.45a NC+1AD 2042c 1115c 1.831ab 11.25±8.76b NC+2AD 2504b 1376b 1.819b 6.88±5.76c NC+3AD 2775b 1492b 1.860ab 6.63±5.28c
Significance ** ** ** **
CV (%) 7.26 6.10 3.03 8.34
HSCAS - hydrated sodium calcium aluminosilicate; PC - positive control; NC - negative control; AD - adsorbent (1 g kg−1, 2 g kg−1, and 3 g kg−1); CV - coefficient
of variation; NS - not significant. **P<0.01.
thus preventing a severe condition of mycotoxicosis, and ensuring superior performance (P<0.05) to the NC. The addition of HSCAS to diets free of mycotoxins (PC+3AD) produced no adverse effects on bird growth performance when compared with PC (P>0.05), indicating that even with some loss of nutrient by association with the adsorbent, as described by Leeson et al. (1995), it was not able to alter the performance characteristics and it did not alter growth or feed intake.
The highest (P<0.05) mortality (Table 2) observed in the NC treatment (20.13%±9.45) was expected,except the treatment with mycotoxin and 1 g kg−1 HSCAS in NC, which
had the second highest mortality (P<0.05) (11.25±8.76%). The other treatments (PC, PC+3AD, NC+2AD, and NC+3AD) showed similar mortality (P>0.05), around 6%, within the acceptable for poultry rearing.
Contamination of broiler chickens by AFB1 (2 mg kg−1)
causes liver impairment, weight loss, difficulty in protein synthesis, immune suppression, and anorexia, which expose these animals to other challenges present in the rearing environment, thereby increasing mortality (Lopes et al., 2006). However, the contamination with fumonisin at levels up to 200 mg kg−1 does not influence mortality
(Rauber et al., 2013). Treatment NC + 1AD showed that the addition of 1 g kg−1 HSCAS was not sufficient to prevent
acute mycotoxicosis, determining still high mortality rates. In the present study, the levels of AFB1 used in
contaminated diets is 100 times greater than the maximum limit of aflatoxins (AFB1 + AFG1 + AFB2 + AFG2 = 20 µg kg−1)
recommended by Resolution RDC 274, National Health Surveillance Agency (ANVISA) of the Ministry of Health, October 15th, 2002, and 40 times greater than the maximum limit of 50 µg kg−1 recommended for animal feed by the
Ministry of Agriculture, Livestock, and Supply through Ordinance MA/SDA/SFA 7 from November 9th, 1988. Under Brazilian law, the maximum limits of mycotoxin for ingredients and animal feed are set only for aflatoxin.
Regarding the hematological parameters (Table 3), the data of the PC treatments were above those advocated by Wakenell (2010), but close to those reported by Cardoso and Tessari (2003), who worked in a climate similar to that of the present study. The thrombocyte count was the only parameter that did not differ (P>0.05) between treatments; differences (P<0.01) were observed for the other parameters. The treatment with the inclusion of the adsorbent and free of mycotoxin was not different (P>0.05) from treatment PC for any of the variables analyzed, indicating once again that the adsorbent used is totally inert and does not interfere with performance and metabolism of poultry.
Treatment NC promoted reduction on hematocrit, erythrocyte, and hemoglobin levels (P<0.01) when compared with treatment PC, a situation that indicates anemia. Other results that prove anemia were the increase in MCH and MCV (P<0.05) and decrease in MCHC (P<0.05), demonstrating that red cells of these birds had a larger size than that of birds in treatment PC. This anemia may be due to a decrease in DNA protein synthesis, caused by AFB1 and FB1 and intensified by a deficiency of folic acid
and vitamin B12, resulting from the reduced feed intake. These results are similar to those described by Tessari et al. (2006), who also worked with AFB1 and FB1, but at lower
levels in the diets.
Treatments with the adsorbent controlled the anemia, since the lowest level of inclusion (1 g kg−1). Despite the
presence of mycotoxin and a possible decrease in protein and DNA synthesis, treatments with adsorbents increased
Table 3 - Hematological parameters of broilers fed diets containing mycotoxins (aflatoxin + fumonisin) and HSCAS
Variable Treatment CV (%) Significance
PC PC+3AD NC NC+1AD NC+2AD NC+3AD
Hemogram
Hematocrit (%) 41.5a 40.13a 26.74b 36.76ab 39.12a 40.74a 8.51 ** Erythrocytes (106 µL−1) 2.67a 2.58a 1.28b 2.25a 2.48b 2.63b 7.26 **
Hemoglobin (g dL−1) 7.14a 6.48a 3.97b 5.82ab 6.28a 7.09a 8.03 **
MCH (pg) 26.74b 25.11b 31.89a 25.90b 25.32b 26.95b 6.10 **
MCV (fl) 155.43c 155.54c 208.59a 163.37b 157.74c 154.90c 5.13 **
MCHC (g dL−1) 17.20a 16.20a 14.86b 15.83ab 16.05a 17.40a 7.62 **
Leukogram
Leukocytes (× 103 µL−1) 24.23a 24.15a 17.6c 18.98bc 20.26b 20.14b 7.65 **
Thrombocytes (× 103 µL−1) 30.93 31.45 29.67 29.62 32.13 31.82 6.10 NS
Lymphocytes (× 103 µL−1) 14.83a 13.13a 6.73c 8.12b 12.19a 10.32ab 8.36 **
Heterophiles (× 103 µL−1) 8.64a 8.87a 3.81bc 5.81b 7.98c 8.32a 11.0 **
Monocytes (× 103 µL−1) 1.85a 1.16b 0.32c 0.52c 0.89bc 1.23a 10.35 **
HSCAS - hydrated sodium calcium aluminosilicate; MCH - mean corpuscular hemoglobin; MCV - mean corpuscular volume; MCH - mean corpuscular hemoglobin concentration; PC - positive control; NC - negative control; AD - adsorbent (1 g kg−1, 2 g kg−1, and 3 g kg−1); CV - coefficient of variation; NS - not significant.
**P<0.01.
the feed intake when compared with the negative control, resulting in increased intake of folic acid and vitamin B12. All treatments showed white cell count (Table 3) within the limits prescribed for the species by Wakenell (2010), which are quite broad. The decreases in the values (P<0.05) in NC and NC+1AD pointed the onset of an immunosuppression condition, arising from the contamination with mycotoxin, mainly by AFB1, since the
mechanisms by which FB1 affects the immune response
system are not well understood. Treatments with addition of 2 and 3 g kg−1 HSCAS showed, mostly, leukocyte
count levels below PC (positive control); this is because mycotoxin is not 100% (fully) captured by the adsorbent, and some absorption may occur, consequently affecting the metabolism of the animal, as reported by Gimeno and Martins (2011).
Analyzing possible damage of mycotoxins on hepatic system (Table 4), changes (P<0.01) were found between treatments only in cholesterol and gamma glutamyl transferase (GGT), while triglyceride levels did not change (P>0.05). These changes occurred in the negative control (NC) and in the negative control with 1 g kg−1 HSCAS
(NC+0.10AD), reducing cholesterol levels by 36% and 26%, respectively, when compared with PC. Cholesterol levels were below the levels for the species, which, according to Schmidt et al. (2007), range from 100 to 200 mg dL−1.
This reduction may have been caused by the inhibition of the biosynthesis and transport of this metabolite due to the liver damage generated mainly by aflatoxin. Studies using histopathology showed that metabolism of aflatoxins generates hyperplasia of the bile ducts, which leads to a case of cholestasis that can be seen through the yellowish liver coloration, hepatocellular degeneration, fat changes in hepatocytes, and defense cells infiltration due to the initial inflammatory process.Metabolically, the damage generated in the liver can lead the animal to a process of anorexia, increasing the hormone glucagon levels, characterizing a
state of severe lipolysis and as a consequence the inhibition of HMG-CoA reductase activity and, therefore, inhibition of cholesterol biosynthesis in the liver cells (Ortatatli and Oguz, 2001; Eraslan et al., 2006). As the broilers were fed a plant-based diet with low cholesterol, the only way to obtain cholesterol would be the biosynthetic pathway. Therefore, the lowest level of cholesterol found in the NC + 1AD treatment can be indicative that the amount of adsorbent (1 g kg−1 HSCAS) was not sufficient to protect the hepatic
system of broilers and the damage caused by mycotoxins may have partly affected the cholesterol biosynthesis, leading to lower production of this metabolite. The results found in this study are similar to that found by Batina et al. (2005) and Maciel et al. (2007), who also observed a reduction in cholesterol levels in treatments containing aflatoxin. On the other hand, Rauber et al. (2013) recorded no differences in serum cholesterol levels when analyzing the effect of fumonisin.
Moreover, as further confirmation, levels of gamma-glutamyl transferase (GGT) in treatments NC and NC +1AD increased by 70% and 40% when compared with PC. Gamma-glutamyl transferase acts in the transfer of amino acids and peptides across cell membranes for the protein synthesis, and an increase in its level leads to hepatic damage, maybe through a cholestasis, as observed by Maciel et al. (2007) when using 5 mg kg−1 aflatoxin in broiler diets.
Triglyceride levels, in turn, were not influenced by mycotoxins (P>0.05). These data agree with Batina et al. (2005) and Maciel et al. (2007), who reported no differences in plasma triglyceride content between the positive and negative control containing 5 mg kg−1 of aflatoxins.
As regards the functionality of the kidney (Table 4), changes were detected (P<0.01) in serum uric acid and creatinine (P<0.05). Values of serum urea recorded in this study were within the range expected for the species between 0 and 5 mg dL−1 (Thrall, 2007). Because birds do not have
the urea cycle due to the absence of carbamoyl-phosphate
Table 4 - Biochemical parameters of broilers fed diets containing mycotoxins (aflatoxin + fumonisin) and HSCAS
Variable Treatment CV (%) Significance
PC PC+3AD NC NC+1AD NC+2AD NC+3AD
Hepatic system
Cholesterol (mg dL−1) 138.75a 139.68a 87.63b 101.54b 140.38a 138.65a 12.1 **
Triglyceride (mg dL−1) 70.92 71.75 69.67 72.34 72.78 73.51 8.56 NS
GGT (IU L−1) 22.11b 23.43b 37.7a 32.02a 24.79b 24.45b 13.65 **
Renal system
Uric acid (mg dL−1) 7.34a 7.10 4.08b 6.01c 6.59ac 6.37ac 6.10 **
Urea (mg dL−1) 3.64 3.75 3.22 3.59 3.25 4.0 7.69 NS
Creatinine (mg dL−1) 0.55a 0.52a 0.36b 0.48ab 0.58a 0.50a 8.89 *
HSCAS - hydrated sodium calcium aluminosilicate; GGT - gamma glutamyl-transferase; PC - positive control; NC - negative control; AD - adsorbent (1 g kg−1, 2 g kg−1, and
3 g kg−1); CV - coefficient of variation; NS - not significant.
*P<0.05; **P<0.01.
synthase in their metabolism, reasonable levels of urea are found in chicken sera, and are indicative of the efficiency of utilization of amino acids as well as uric acid (Bertechini, 2012).
The creatinine level of treatment NC decreased by 35% compared with treatment PC, a reduction also observed by Batina et al. (2005) and Maciel et al. (2007), who reported a 30% reduction in creatinine levels when birds were given a feed with 5 mg kg−1 aflatoxin. Nevertheless, the inclusion
of mycotoxin associated with adsorbents in the different levels tested promoted the control of serum creatinine compared with the control group (PC). Creatinine results from the degradation of muscle phosphocreatine. When muscle activity rates rise, creatinine levels increase and are indicative of kidney problems by not being reabsorbed by the organism and requiring elimination (Thrall, 2007). The decrease found in NC is the result of a lower muscle mass gain, associated with low feed intake due to liver problems caused by mycotoxin.
Like creatinine, uric acid in treatment NC had a 45% reduction when compared with PC. Uric acids are produced by protein metabolism from the degradation of purines, being the main form of nitrogen excretion by birds; in this way, a higher intake of protein increases the excretion of nitrogen. The reduction (P<0.05) of about 50% in feed intake of broilers in treatment NC, compared with PC, explains the low uric acid levels found. Batina et al. (2005) and Maciel et al. (2007) observed a similar reduction using an intoxication of 5 mg kg−1 aflatoxin in broilers.
These authors related this decline to possible changes in the hepatic metabolism and the intrahepatic lipid transport, due to the presence of aflatoxin, thus resulting in increased renal excretion of uric acid. Rauber et al. (2013) examined diets with varying contamination with fumonisin, from 0 to 200 mg kg−1, and detected no changes in serum uric acid.
Lastly, the levels of 2 and 3 g kg−1 of inclusion of
adsorbent in NC were efficient to normalize levels of the biochemical parameters, demonstrating that mycotoxins absorbed by birds receiving the adsorbents were not sufficient to cause renal damage.
Conclusions
Addition of aflatoxin B1 and fumonisin B1 at 2 mg kg−1
and 100 mg kg−1 causes adverse effects on most of the
response variables studied. The use of the adsorbent based on hydrated sodium calcium aluminosilicate at levels greater than or equal to 2 g kg−1 is effective in partially
reversing mycotoxicosis and alleviating losses in relation to the negative control.
References
Batina, P. N.; Lopes, S. T. A. and Saturio, J. M. 2005. Efeitos da adição de montmorilonita sódica na dieta sobre o perfil bioquímico de frangos de corte intoxicados com aflatoxina. Ciência Rural 35:826-83.
Bertechini, A. G. 2012. Nutrição de monogástricos. 2.ed. Editora UFLA, Lavras.
Cardoso, A. L. S. P. and Tessari, E. N. C. 2003. Estudo dos parâmetros hematológicos em frangos de corte. Arquivos do Instituto Biológico 70:419-424.
Eraslan, G.; Essiz, D.; Akdogan, M.; Karaoz, E.; Oncu, M. and Ozyildiz, Z. 2006. Efficacy of dietary sodium bentonite against subchronic exposure to dietary aflatoxin in broilers. Bulletin of the Veterinary Institute in Pulawy 50:107-112.
Ferreira, D. F. 2011. Sisvar a computer statistical analysis. Ciência e Agrotecnologia 35:1039-1042.
Gimeno, A. and Martins, M. L. 2011. Mycotoxinas y Micotoxicosis en Animales y Humanos. 3th ed. Special Nutrients-INC, Miame. Goldblatt, L. 2012. Aflatoxin: scientific background, control, and
implications. Elsevier, 2012.
Jain, N. C. 1993. Essentials of veterinary hematology. Lea & Febigner, Philadelphia.
Ledoux, D. R.; Brown, T. P.; Wibking, T. S. and Rottinghaus, G. E. 1992. Fumonisin toxicity in broiler chicks. Journal of Veterinary Diagnostic Investigation 4:330-333.
Leeson, S.; Diaz, G. and Summers, J. D. 1995. Poultry metabolic disorders and mycotoxins. University Books, Guelph.
Lopes, J. M.; Rutz, F.; Mallman, C. A. and Toledo, G. S. P. 2006. Adição de bentonita sódica Como adsorvente de aflatoxina em rações de frangos de corte. Ciência Rural 36:1594-1599.
Maciel, R. M.; Lopes, S. T. A.; Saturio, J. M.; Martins, D. B.; Rosa, A. P. and Emanuelli, M. P. 2007. Função hepática e renal de frangos de corte alimentados com dietas com aflatoxina e clinoptilolita natural. Pesquisa Agropecuária Brasileira 42:1221-1225.
Miazzo, R.; Rosa, C. A.; Carvalho, E. C. Q.; Magnoli, C.; Chiacchiera, S. M.; Palacio, G.; Saenz, M.; Kikot, A.; Basaldella, E. and Dalcero A. 2000. Efficacy of synthetic zeolite to reduce the toxicity of aflatoxin in broiler chicks. Poultry Science 79:1-6.
Miazzo, R.; Peralta, M. F.; Magnoli, C.; Salvano, M.; Ferreiro, S.; Chiacchiera, S. M.; Carvalho, E. C. Q.; Rosa, C. A. and Dalcero, A. 2005. Efficacy of sodium bentonite as a detoxifier of broiler feed contaminated with aflatoxin and fumonisin. Poultry Science 84:1-8.
Minami, L.; Meirelles, P. G.; Hirooka, E. Y. and Ono, E. Y. S. 2004. Fumonisinas: efeitos toxicológicos, mecanismos de ação e biomarcadores para avaliação da exposição. Revista Semina: Ciências Agrárias 25:207-224.
Ortatatli, M. and Oguz, H. 2001. Ameliorative effects of dietary clinoptilolite on pathological changes in broiler chickens during aflatoxicosis. Research in Veterinary Science 71:59-66.
Rauber, R. H.; Oliveira, M. S.; Mallmann, A. O.; Dilkin, P.; Mallmann, C. A.; GiacominI, L. Z. and Nascimento, V. P. 2013. Effects of fumonisin B1 selected biological responses and performance of
broiler chickens. Pesquisa Veterinária Brasileira 33:1081-1086. Rostagno, H. S.; Albino, L. F. T.; Donzele, J. L.; Gomes, P. C.; Oliveira,
R. F.; Lopes, D. C.; Ferreira, A. S.; Barreto, S. L. T. and Euclides, R. F. 2011. Tabelas brasileiras para aves e suínos: composição de alimentos e exigências nutricionais. 3.ed. UFV, Viçosa, MG. Schmidt, E. M. S.; Locatelli-Dittrich, R.; Santin, E. and Paulillo, A. C.
Shephard, G. S.; Sydenham, E. W.; Thiel, P. G. and Gelderblom, W. C. A. 1990. Quantitative determination of fumonisin B1 and B2 by high performance liquid chromatography with fluorescence detection. Journal of Liquid. Chromatography 13:2077-2087. Shotwell, O. L.; Hesseltine, C. W.; Stubblefield, R. D. and Sorenson,
W. G. 1966. Production of aflatoxin on rice. Applied Microbiology 14:425-428.
Soares, L. M. V. and Rodriguez-Amaya, D. B. 1989. Survey of aflatoxins, ochratoxin A, zearalenone and sterigmatocystin in some Brazilian foods by using multi-toxin thin-layer chromatographic method. Journal of Association of Official Analytical Chemists International 72:22-26.
Tessari, E. N. C.; Oliveira, C. A. F.; Cardoso, A. L. S. P.; Ledoux, D. R. and Rottinghaus, G. 2006. Parâmetros hematológicos de
frangos de corte alimentados com ração contendo aflatoxina B1 e
fumonisina B1. Ciência Rural 36:924-929.
Thrall, M. A. 2007. Hematologia e bioquímica clínica veterinária. Roca, São Paulo.
Wakenell, P. S. 2010. Hematology of chickens and turkeys. p.958-967. In: Schalm’s veterinary hematology. 6th ed. Weiss, D. J. and Wardrop, K. J., eds. Blackwell, Philadelphia.
Weibking, T. S.; Ledoux, D. R.; Bermudez, A. J.; Turk, J. R.; Rottinghaus, G. E.; Wang, E. and Merril Jr., A. H. 1993. Effects of feeding Fusarium monilifome culture material, containing known levels of fumonisin B1, on the young broiler chick. Poultry Science 72:456-466. Yunus, A. W.; Razzazi-Fazeli, E. and Bohm, J. 2011. Aflatoxin B1 in