Article
Printed in Brazil - ©2018 Sociedade Brasileira de Química*e-mail: [email protected]
Effect of Calcination Temperature on Catalytic Performance of CeCu Oxide in
Removal of Quinoline by Wet Hydrogen Peroxide Oxidation from Water
ZhaojieJiao,a,bGuilinZhou,bHaidongZhang,bYuShen,bXianmingZhang,b
JuexuanLibandXuGao*,a,c
aFaculty of Urban Construction and Environmental Engineering, Chongqing University, 400045
Chongqing, China
bEngineering Research Centre for Waste Oil Recovery Technology and Equipment of Ministry of
Education, Chongqing Technology and Business University, 400067 Chongqing, China
cChongqing Water Group Company Limited, 400015 Chongqing, China
A facile citric acid-mediated complexation-calcination approach is reported in this paper to prepare the CeCu oxide composite with a porous structure that is highly efficient and durable for treating simulated quinoline wastewater by catalytic wet hydrogen peroxide oxidation (CWPO). As the results indicate, Cu species can be dissolved in CeO2 lattice to fabricate a solid solution.
The calcination temperature is critical for an optimum catalyst structure and catalytic performance. As found in investigating the structure and catalytic performance of the CeCu oxide prepared at calcination temperatures ranging from 350 to 750 °C, the optimum temperature is 650 °C, at which a loose surface, a porous structure and considerable adsorbed surface oxide/hydroxyl oxide species are fabricated over the catalyst. This resultant catalyst also takes on the optimal performance with an oxidation conversion reaching 98% for quinoline, a removal efficiency of 80.6% for total organic carbon (TOC) and a low Cu2+ leaching value of 19.3 mg L-1. Besides,
the high performance is maintained by the catalysts in a wide pH range of 5.1-10.5. This work generally provides an efficient way to design and fabricate the catalyst for CWPO reaction, which can also be applied in other reactions.
Keywords: CeCu oxide, catalyst, wet hydrogen peroxide oxidation, quinoline, waste water
Introduction
As modern industry is leaping forward, a growing number of organic pollutants were discharged into the water. Those organic pollutants, being hard to remove, pose a serious threat to human and environment. The nitrogen-containing heterocyclic compounds, e.g. quinoline, are highly toxic and hard to remove, being notorious for their carcinogenicity, teratogenesis and mutagenicity.1,2
These compounds normally have a cyclic structure with a relatively stable closed conjugate system, which exert remarkable molecular steric hindrance effect and decrease charge density in the biodegradation as catalyzed by lipase centers. Then, the electrophilic substitution reaction catalyzed by the activity centers of microbial enzyme can rarely occur as these compounds are inaccessible to the activity centers of microbial enzyme.3 Quinoline, as
a typical nitrogen-containing heterocyclic compound, is primarily found in the wastewater discharged from oil refining, coking, dye production, rubber industry and pharmaceutical production, etc.4 The quinoline amount in
the oily wastewater and coking wastewater, having been treated through biochemical processes, is approximately 0.15 and 5% of the total mass,6 respectively. In this regard, it
is critical for studying the technology treating the quinoline containing wastewater.
The adsorption method,7 membrane separation method,8
supercritical water oxidation,9 ozone oxidation,10 ultraviolet
radiation,11 photocatalytic oxidation,12 electrocatalytic
oxidation,13 wet oxidation14 and biological method can
treat quinoline containing oily wastewater and coking wastewater.15 Comparatively, the technique of catalytic
advanced oxidation processing technology developed in the recent two decades. In a CWPO process, heterogeneous catalysts other than homogeneous catalysts are adopted in Fenton reaction. The hydroxyl radicals (
⋅
OH) generated in a CWPO are highly active in oxidation,17 thus beingcapable of oxidizing and decomposing the organic matters that are hard to biodegrade or treat with common oxidation methods.18 On that basis, they can be treated biochemically,
or directly mineralized into water, carbon dioxide and other inorganic compounds. The CWPO technique outperforms the traditional wet oxidation technique. It is advantaged in low operation cost, and operation at the low temperature and under low pressure. Also, CWPO can avoid the inevitable problems in homogeneous catalytic oxidation technique, which involve the loss of active components in catalysts, the failure to repeated use, and the secondary pollution resulting from homogeneous process.19
The core of developing CWPO is a highly effective catalyst. Currently, transition metal, rare-earth metal and precious metal are involved as the active component of reported CWPO catalysts. The precious metal catalysts are expensive. The rare-earth metal catalysts are normally not as active as precious metal catalysts get, and the transition metal catalysts have low cost and high activity. Yet the loss of active component and secondary pollution in use are major problems we have to cope with in the study of transition metal catalysts. The ceria-based oxides take on potent oxygen storage property, and have dual roles of stabilizing the crystal structure and blocking the volume shrinkage.20 The cerium oxide can be formed
with the transition metal oxide to increase the dispersion and mechanical strength of active components on the catalyst surface at high temperature. Therefore, the loss of transition metal components can be inhibited, which makes catalyst more stable.21 CuO catalysts are found
highly active in CWPO,22,23 whereas the Cu component
is apparently dissolved in catalytic reaction tests.24,25
CeCu-mixed oxide catalysts give a promising approach to preserve Cu component and an adjustable way to increase the catalytic activity. The calcination temperature affects the structure, composition, stability and mechanical strength of CeCu-mixed oxide catalysts remarkably. It is critical for investigating the impact exerted by calcination temperature on the catalytic performance of CeCu-mixed oxide catalysts.
The CeCu-mixed oxide catalysts were prepared in this study with a citric acid-aided complexation-calcination method at varying calcination temperatures, and were investigated in the CWPO of quinoline with wastewater contained. The catalysts were characterized using X-ray diffraction (XRD), scanning electron microscopy
(SEM), Brunauer-Emmett-Teller (BET), H2 temperature
programmed reduction (H2-TPR) and X-ray photoelectron
spectroscopy (XPS). The structure-catalytic performance relationship of CeCu-mixed oxide catalysts in the CWPO reaction of quinoline containing wastewater was studied.
Experimental
Preparation of CeCu-mixed oxide catalysts
CeCu-mixed oxide catalysts were prepared using complexation method with citric acid (abbreviated as CA) as complexing agent. In a typical preparation, Cu(NO3)2·3H2O and Ce(NO3)3·6H2O with 1:1 Cu/Ce molar
ratio were dissolved in distilled water. CA was added into the solution in a certain amount to attain a 1.8 molar ratio of CA to (Ce + Cu).26,27 Then the mixture was stirred to
make transparent solution. On that basis, the obtained transparent solution was evaporated to attain solid powder, which was then treated at 100 °C for 20 h. Afterwards, the dry powder was calcined in a muffle furnace for 3.0 h to fabricate CeCu-mixed catalysts. The ramping rate of the muffle furnace reached 10 °C min-1. The CeCu-mixed oxide
catalysts were marked as CC350, CC450, CC550, CC650 and CC750 corresponding to the calcination temperatures at 350, 450, 550, 650 and 750 °C, respectively. The foregoing analytical reagents were purchased from Chengdu Kelong Chemical Reagent Factory.
Characterizations of CeCu-mixed oxide catalysts
The XRD studies of CeCu-mixed oxide catalysts were performed as 2θ ranged from 20 to 80° on a Rigaku XRD-6100 X-ray diffractometer with Cu Kα line filtered by Ni. The tube had 40 kV voltage and 30 mA current.
The scanning rate was 5° min-1. The SEM images of
CeCu-mixed oxide catalysts were captured with a Hitachi’s S-4800 instrument. In each H2-TPR test of CeCu-mixed
oxide catalysts, 30 mg of sample was placed in a U-shape quartz tube. The flow (25 mL min-1) of 5.0% H
2-Ar mixture
gas was controlled by a mass flow controller with the ramping rate of 10 °C min-1. The chemical states of Ce, Cu
coupled plasma-optical emission spectroscopy (Jiangsu Skyray Instrument Co., Ltd.). Besides, the wavelengths of copper and cerium are 224.7 and 413.4 nm, respectively. The BET measurements were performed at –196 °C using a Micromeritic ASAP 2020 automatic analyzer. The samples were degassed under vacuum at 300 °C for 6.0 h prior to the measurement. Given the adsorption data, the BET method was adopted to calculate the specific surface area.
Catalytic tests of CeCu-mixed oxide catalysts
The CWPO of quinoline containing wastewater was performed in a flask. In a typical run, catalyst was added into the flask in a certain amount, followed by adding quinoline containing wastewater (initial pH value of 7.3) and hydrogen peroxide solution (30%, AR, Chengdu Kelong Chemical Reagent Com.). The reaction mixture was preserved at a constant temperature in a water bath shaker for a certain period. The centrifugal separation was then conducted. The supernatant fraction was extracted to measure total organic carbon (TOC) value and catalytic activity. The quinoline conversion in the CWPO process of simulated quinoline containing wastewater was measured adopting a Shimadzu UV-2550 ultraviolet-visible spectrophotometer (UV-Vis). The wavelength at 312.4 nm was established for measuring the quinoline absorbance.
The catalytic activity was characterized by quinoline TOC removal (η) and quinoline oxidation conversion (β), which are calculated via equations 1 and 2 below:
(1)
(2)
where η is the TOC removal, C0 is the TOC concentration
of initial solution, Ci is the TOC concentration of the
solution after reaction, β is the quinoline conversion, A0 is
the absorbance of initial solution and Ai is the absorbance
of the solution after reaction.
Results and Discussion
XRD characterization
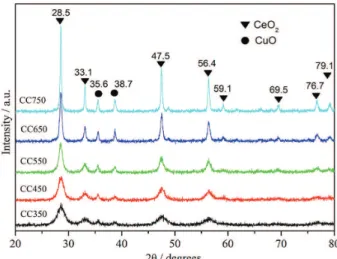
The X-ray diffraction analysis of CeCu-mixed oxide catalysts is illustrated in Figure 1. In the X-ray diffraction analysis, eight diffraction peaks at 28.5, 33.1, 47.5, 56.4, 59.1, 69.5, 76.7 and 79.1° can be identified and corresponded to the (111), (200), (220), (311), (222), (400), (331) and
(420) lattice planes of the cubic CeO2 with fluorite structure,
respectively (JCPDS No. 65-2975).28 Two XRD peaks at
35.6 and 38.7° can also be identified and corresponded to the CuO formation (JCPDS No. 41-0254).29
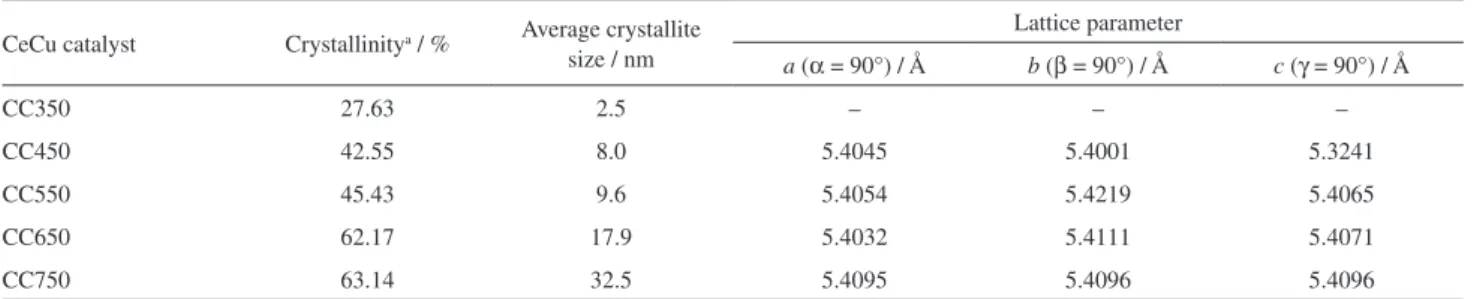
The parameters of CeCu-mixed oxide catalysts calculated following the XRD data in Figure 1 are listed in Table 1. The intense diffraction peaks associated with the crystalline phases of CeO2 and identifiable diffraction
peaks bound by the crystalline phases of CuO are observed in the X-ray diffraction analysis of the CeCu-mixed oxide catalysts prepared at different calcination temperatures. Yet, no shift for the diffraction peaks associated with the crystalline phases of CeO2 is observed, which indicates
that CuO species are dissolved in the CeO2 lattice to form
the CeCu-mixed oxide. These diffraction peaks associated with the CeO2 crystalline phases are identified in the XRD
spectra of all catalysts prepared at different calcination temperatures, which indicates that these catalysts take on high thermal stability. In the XRD patterns of the catalysts prepared at relatively low calcination temperature, the diffraction peaks of CuO and CeO2 are broad and
relatively less intense, which indicates that the particle of the CuO and CeO2 grains prepared at low calcination
temperature is small in size and poorly crystallized, or even some amorphous units are contained in these CuO and CeO2 grains. As calcination temperature rises, the XRD
diffraction peaks of CuO and CeO2 become progressively
intense and sharp, which is an indication of crystallinity. This complies with the trend presented in Table 1 that the crystallinity and particle size increase as calcination temperature rises.
CuO and CeO2 grains, which are associated with less
intense and broad XRD diffraction peaks. As calcination temperature rises, the particle of CeO2 and CuO grains also
become large and well crystallized. The narrow and intense XRD diffraction peaks are then observed. As indicated in Table 1, the crystal cell parameter a of CeCu-mixed oxide catalysts is less than a normal CeO2 crystal cell (5.4103 Å),
which indicates that the calcination at high temperature can convert Cu2+ with small ion radius into CeO
2 lattice to
fabricate CeCu-mixed oxide. The mixed oxide formation can make CuO and CeO2 strongly interacted and Cu–O
and Ce–O bonds effectively weak. In catalytic reactions, these bonds will be broken to generate highly active oxygen species. Besides, the Cu+/Cu2+ and Ce3+/Ce4+ ion pairs
formed between CuO and CeO2 can facilitate the electron
transfer and provide active species and active center for catalytic reaction.30
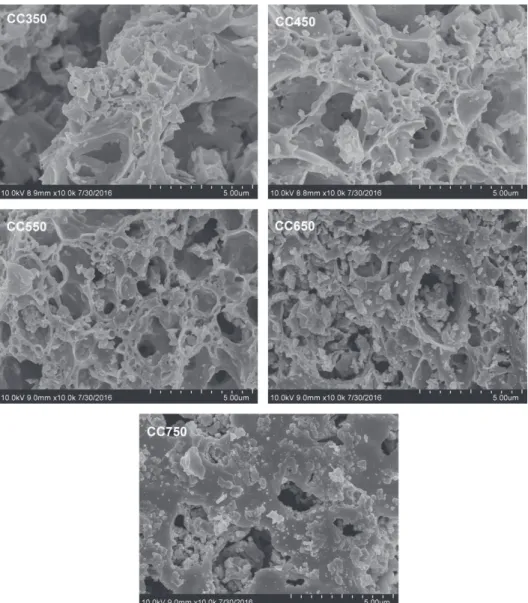
Morphology and structure analysis
As indicated in Figure 2, the CeCu-mixed oxide catalysts are different in surface porosity, particle size and uniformity, whereas with rough, loose and porous flocculent structure. As these catalysts are being prepared, Cu2+ and Ce4+ are well mixed with citric acid added. In the
drying and calcinations, the citric acid and nitrate in the precursors are decomposed at high temperature to generate considerable CO2, CO, H2O and NOx, which largely form
the rough surface, loose and porous structure of these catalysts. As calcination temperature rises, the precursor was greatly enhanced in the thermal decomposition ability, and more gas was released to better form porous structure in the catalyst. Yet, as the temperature rises continuously, it may collapse the porous structure on the catalyst surface, or even burned down. Consequently, the particles may be aggregated on the catalyst surface, and the specific surface area may reduce. As presented in Table 2, the specific surface area of the prepared catalyst decreases
as the calcination temperature rises, which indicates that calcination temperature greatly impacts the specific surface area structure.
H2-TPR analysis
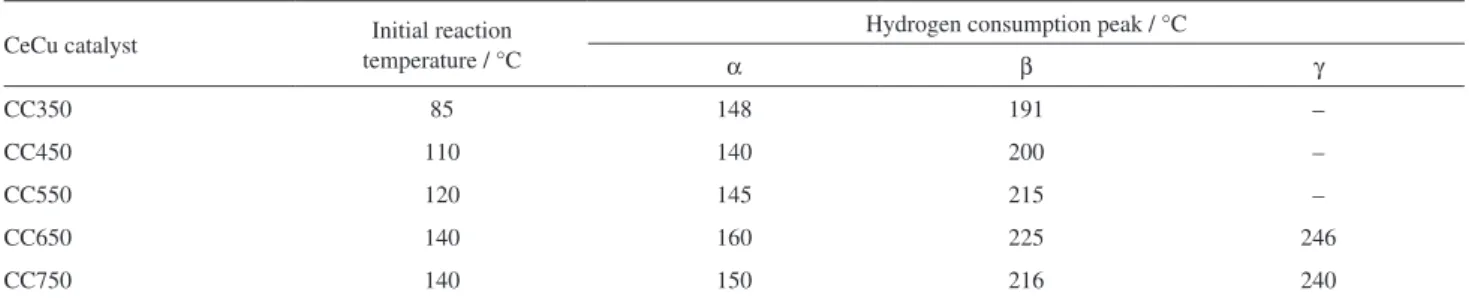
Figure 3 presents the H2-TPR profiles of the prepared
CeCu-mixed oxide catalysts. Table 3 lists the data of catalyst baseline deviation and hydrogen consumption peak positions. As presented in Table 3, the initial reaction temperature and hydrogen consumption peak position of catalysts vary with the calcination temperature for preparing catalysts. These data evidently tend towards high temperature as calcinations temperature rises.
In the H2-TPR profiles of the CeCu catalyst, the amount
of reducible species can be revealed by the peak area. The hydrogen consumption peak corresponding to lower temperature is associated with better reducibility of the reduced species. In the meantime, H2-TPR profiles also
reveal the dispersion and valence of reducible species. Pure CeO2 presents two H2-TPR hydrogen consumption peaks at
500 and 800 °C.31 Pure CuO indicates the H
2-TPR hydrogen
consumption peak at approximately 300 °C.32 CeCu-mixed
oxide catalyst is apparently lower than pure CeO2 or CuO
in the reduction temperature. This indicates that CeO2 and
CuO species in the CeCu-mixed oxide catalysts is evidently increased in reducibility.
As acquired from the SEM images, the CeCu-mixed oxide catalyst surface contains rough and porous flocculent structures, which provides effective sites for adsorption and reaction of H2 molecules, and then better reduces the
reducible species on catalyst surface. As presented from the XRD results, as Cu2+ is dissolved into the CeO
2 lattice,
CeCu-mixed oxide starts to form, and the interaction is enhanced between CuO and CeO2 species. This, to a certain
extent, weakens the Cu–O and Ce–O bonds in the catalysts. Therefore, the reducibility of the corresponding components is increased, presenting good low-temperature reducibility. Table 1. Parameters of the catalysts prepared at different calcination temperatures
CeCu catalyst Crystallinitya / % Average crystallite
size / nm
Lattice parameter
a (α = 90°) / Å b (β = 90°) / Å c (γ = 90°) / Å
CC350 27.63 2.5 – – –
CC450 42.55 8.0 5.4045 5.4001 5.3241
CC550 45.43 9.6 5.4054 5.4219 5.4065
CC650 62.17 17.9 5.4032 5.4111 5.4071
CC750 63.14 32.5 5.4095 5.4096 5.4096
aCrystallinity was calculated by the Debye-Scherrer formula. CC350, CC450, CC550, CC650 and CC750 correspond to the calcination temperatures at
Thus far, views are diverse about the contribution of the CuO/CeO2 catalyst to reducing hydrogen-consumption
peak. As Liu and Flytzani-Stephanopoulos33 stated, the
reduction peak at 157 °C was contributed to the CuO clusters interacting with CeO2 strongly, while the reduction
peak at 180 °C was contributed to the large CuO particles interacting with CeO2. CuO/CeO2 doped by La was studied
by Kundakovic and Flytzani-Stephanopoulos,34 and the
conclusion similar to that of Cu–Ce catalysts was obtained.
As proposed by Jiang et al.,35 the reduction of the highly
dispersed CuO on the surface of CeO2, compared with the
reduction of large CuO particles, results in the reduction peak at lower temperature.
In Figure 3, the α hydrogen consumption peaks at low temperature are formed via the hydrogen-consumption reduction of highly-dispersed CuO, which is strongly interacted with CeO2. The β hydrogen-consumption
peaks at high temperature are formed via the hydrogen-Table 2. The initial copper and cerium content of the catalysts and the specific surface area (SBET)
CeCu catalysta CC350 CC450 CC550 CC650 CC750
Cu/Ceb / mol 1.02 1.08 1.00 1.12 1.04
Cu/Ceb / at.% 25.7/67.8 26.7/54.2 25.4/55.6 27.4/53.5 26.1/54.9
SBET / (m2 g-1) 38 17 9 6 3
aThe CeCu-mixed oxide catalysts were marked as CC350, CC450, CC550, CC650 and CC750 corresponding to the calcination temperatures at 350, 450,
550, 650 and 750 °C, respectively; bthe Cu/Ce (mol, at.%) were ascertained using an ICP2060T.
consumption reduction of CuO in the bulk phase, which is stemmed from the CuO agglomeration and also strongly interacted with CeO2. For CC650 and CC750 catalysts,
the γ hydrogen-consumption peaks are formed through reducing isolated CuO on the catalyst subsurface. As presented in Figure 3, the initial temperature of the curve deviating from the baseline and the temperature of the reduction peak overall increase as calcination temperature rises. As accordingly indicated, the highly-dispersed CuO on CeO2 is agglomerated with grain size increased as
calcination temperature rises.
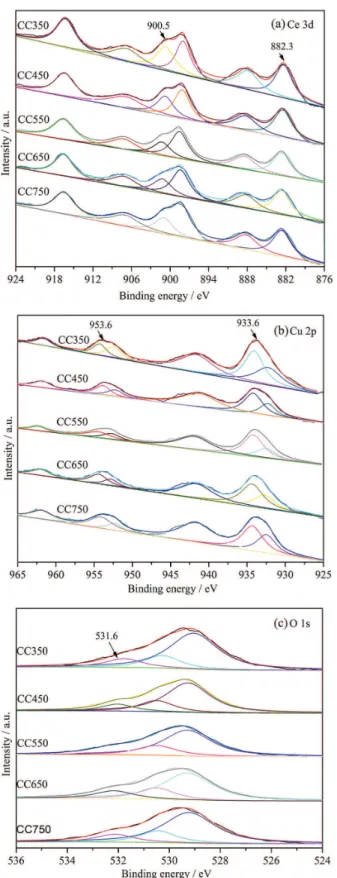
XPS analysis
Ce 3d, Cu 2p and O 1s XPS spectra of CeCu-mixed oxide catalysts prepared at different calcination temperatures are presented in Figure 4. As indicated in Figure 4a, six intense XPS peaks can be identified at 916.5, 907.1, 900.5, 897.9, 888.2 and 882.3 eV, in the Ce 3d XPS spectra of the CeCu-mixed oxide catalysts. The peaks at 900.5 and 882.3 eV are stemmed from the major peaks of Ce 3d3/2
and Ce 3d5/2, respectively. The peaks at 916.5, 907.1,
897.9 and 888.2 eV refer to satellite peaks of Ce 3d3/2 and
Ce 3d5/2. This indicates that the Ce species in the catalysts
primarily exist as Ce4+, and the Ce species on the surface
of the catalyst prepared primarily exist as CeO2 species.36
It complies with the XRD characterization result. For Ce 3d spectra of the catalysts, the electron binding energy values of the XPS peaks are consistent. As accordingly indicated, the calcination temperature less impacts the chemical environment of the Ce species on the surface of the CeCu-mixed oxide catalyst.
In Figure 4b, four obvious XPS peaks at 961.6, 953.6, 941.8 and 933.6 eV, are observable in the Cu 2p XPS spectra of the CeCu-mixed oxide catalysts. The peaks at 953.6 and 933.6 eV are respectively deemed as the major peaks of Cu 2p1/2 and Cu 2p3/2. The peaks at 961.6 and
941.8 eV refer to satellite peaks of Cu 2p1/2 and Cu 2p3/2,
respectively. These 4 XPS peaks are the typical peaks for Cu2+ species,37 which indicate that the Cu species on the
surface of CeCu-mixed oxide catalysts primarily exist as CuO. In Figure 4b, a weak peak of Cu 2p3/2 at 932.4 eV is
observable and deemed as the typical peak of Cu+ species.38
This indicates that trace amount of Cu2O species may be
present on the catalyst surface, possibly resulting from the reduction of CuO species at high temperature by CO or other reductive gases produced from the decomposition of citric acid during catalyst preparation.
The O 1s XPS spectra of the prepared CeCu-mixed oxide catalysts are presented in Figure 4c. The O 1s spectra is well fitted by three curves with maximum at 531.6, 530.3 and 529.2 eV. The peaks ranging from 528.5 to 529.8 eV are stemmed from lattice oxygen O2- species
on the catalyst surface. The peaks ranging from 529.8 to 531 eV are stemmed from the absorption oxygen O22- or
O- species on the catalyst surface. The peak at 531.6 eV
is from the hydroxyl oxygen OH-39 of absorbed water
on catalyst surface. O- is reported as the most active in
oxidation whereas O2- is comparatively lower in activity.40
As listed in Table 4, more adsorption oxygen species can be generated on the surface of CC550 and CC650 catalysts,
Table 3. Data of catalyst baseline deviation and hydrogen consumption peak positions
CeCu catalyst Initial reaction temperature / °C
Hydrogen consumption peak / °C
α β γ
CC350 85 148 191 –
CC450 110 140 200 –
CC550 120 145 215 –
CC650 140 160 225 246
CC750 140 150 216 240
CC350, CC450, CC550, CC650 and CC750 correspond to the calcination temperatures at 350, 450, 550, 650 and 750 °C, respectively. Figure 3. H2-TPR profiles of CeCu-mixed oxide catalysts attained at
which is likely to provide more active oxygen species for the catalytic reaction. As presented in Figure 4c, the
XPS peak of lattice oxygen species, compared with that of the adsorption oxygen and hydroxyl oxygen, is more intense. The content of lattice oxygen surmounts 65%. This indicates that dispersed CuO, CeO2 or CeCu-mixed
oxide are dominant on catalyst surface. As CuO and CeO2
are interacted, more oxygen vacancies may be formed, thus increasing the mobility and availability of lattice oxygen.41
Adding Ce into these catalysts better increases lattice oxygen content in catalyst. As listed in Table 4, Cu and Ce are different in the content on the catalyst surface, and the mole ratio of Cu and Ce is under 1.0 on the studied catalyst surface, which indicates that the calcination temperature greatly impacts the Cu and Ce species contents on the catalyst surface. It also shows that the Cu species can be effectively dissolved into the CeO2 lattice to form CeCu
oxide solid solution catalyst.
As the calcination temperature rises, the Cu/Ce molar ratio increased. This is probably a result of the formation of crystal CuO from highly dispersed or amorphous CuO species, or the leaching of Cu species from the lattice of CeCu oxide solid solution. Consequently, the Cu species content increases on the surface of the catalyst. As also indicated, low temperature is not conducive to the dissolution of Cu species into the CeO2 lattice.
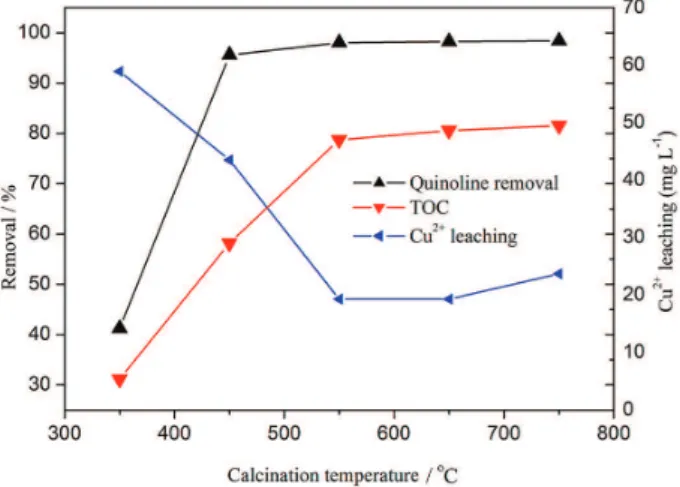
Impact exerted by calcination temperatures on the activity of catalyst
25 mg of catalyst, 25 mL of simulated quinoline wastewater with 100 mg L-1 in concentration and 7.3
as pH value, and 0.5 mL of 30% H2O2 were mixed in a
reaction flask for each catalytic reaction test. The removal was measured 2.0 h after reaction at 75 °C. As indicated in Figure 5, quinoline oxidation conversion increases as calcination temperature of the catalyst rises. For CC350 catalyst, the quinoline oxidation conversion is merely 41.2%. CC450 catalyst gives a quinoline oxidation conversion of 95.6%. It shows that the calcination temperature for the catalyst preparation has a great impact on the quinoline degradation. When the temperature rises continuously, the quinoline oxidation conversion is progressively smooth, which indicates that the conversion increases little after a certain temperature is reached.
The adsorption of the catalysts, the quinoline volatilization and the simple oxidation by H2O2 on removal
of quinoline were also probed into, and the removals of quinoline are 9.84, 8.93 and 8.55%, respectively. As can be seen from the results, the adsorption, volatilization and oxidation by H2O2 are negligible. In this regard, the high
removal obtained in this study primarily owns to the CWPO of quinoline.
As presented in the TOC removal curve of quinoline, the quinoline removal of TOC also increases as calcination temperature of the corresponding catalysts rises. The TOC removals of quinoline are 31.1, 58.2, 78.7 and 80.6% for CC350, CC450, CC550 and CC650 catalysts, respectively. As apparently indicated, the calcination temperature greatly impacts the TOC removal. As presented in the Cu2+ leaching curve, CC350 catalyst has the largest
amount (58.9 mg L-1) of Cu2+ leached. The Cu2+ leaching
amount at the calcinations temperatures of 550 and 650 °C decreases obviously. A 19.3 mg L-1 Cu2+ leaching amount
can be attained for CC650 catalyst. Yet, as calcinations temperature rises continuously, the Cu2+ leaching amount
increases. The Cu2+ leaching amount for CC750 catalyst
reaches 23.7 mg L-1. This indicates that the calcination
temperature greatly impacts the structural stability of the catalyst.
As presented in the XRD result, the catalyst, prepared at low calcination temperature, has comparatively poor crystallinity and small grains and takes on low activity with considerable Cu2+ leaching in the catalytic oxidation
degradation of quinoline. This indicates that low calcination temperature is not conducive to dissolving Cu species into CeO2 lattice to form CeCu-mixed oxide. In the
catalyst prepared at low calcination temperature, either CuO highly dispersed or amorphous is the dominant Cu specie. As the oxidant of the reaction, H2O2 releases H+ in
the reaction, thus making the reaction system acid. Under acidic conditions, highly dispersed or amorphous CuO in the catalyst is easy to dissolve to form Cu2+. Consequently,
the CeO2 and CuO species in CeCu-mixed oxide catalysts
turn out to be less active.
As calcination temperature rises, Cu2+ may be easier to
dissolve into the CeO2 lattice to form stable CeCu-mixed
oxide, which may greatly decrease the highly dispersed or amorphous CuO content in the catalyst, thus more reducing the leaching of Cu2+ in the acid environment. However, a
further increase in the calcination temperature up to 750 °C will convert the highly dispersed or amorphous CuO species to large-grain crystalline CuO, and what’s worse, the Cu species in the resultant material may be easier to escape from the CeCu oxide solid solution, resulting in an increase of Cu2+ in the CWPO reaction. In heterogeneous
catalytic reactions, the adsorption and activation of reactant molecules on catalyst surface are critical. A catalyst with porous structure is usually more suitable to catalyze a heterogeneous catalytic reaction.42 As indicated by the SEM
characterization result, the calcination at high temperature can better form rough and porous flocculent structure in CeCu oxide catalysts, thus fabricating more catalytic active centers available for the adsorption of reactant molecules. Yet, the excessively high calcination temperature can also dramatically decrease the specific area of the catalysts.
Consequently, the interaction between CuO and CeO2
can be weakened, thus decreasing the catalytic activity of such catalyst.
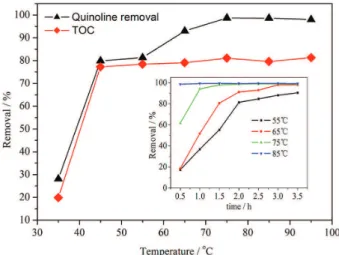
Impact exerted by reaction temperature on catalytic activity
25 mg of CC650 catalyst, 25 mL of simulated quinoline wastewater with 100 mg L-1 as concentration and 7.3
as pH value, and 0.5 mL of 30% H2O2 were mixed in a
reaction flask for each catalytic reaction test. Then, they were reacted at different reaction temperatures for 2 h. Table 4. XPS analysis results of CeCu-mixed oxide catalyst
CeCu catalyst oxygen / %Lattice oxygen / %Adsorbed oxygen / %Hydroxyl Cu / at.% Ce / at.% O / at.% Cu/Ce / mol
CC350 69.29 17.79 12.92 13.77 21.37 64.86 0.64
CC450 68.32 20.00 11.69 12.02 23.54 64.44 0.51
CC550 66.44 20.56 13.00 12.83 21.62 65.55 0.59
CC650 65.49 20.38 14.13 13.95 19.75 66.31 0.71
CC750 68.73 18.47 12.80 14.14 19.78 66.08 0.72
CC350, CC450, CC550, CC650 and CC750 correspond to the calcination temperatures at 350, 450, 550, 650 and 750 °C, respectively.
The results were presented in Figure 6. As presented in Figure 6, the quinoline oxidation conversions are 28.1, 79.9, 81.3 and 93%, with TOC removals at 19.9, 77.3, 78.5 and 79.1% after 2.0 h of reaction test at 35, 45, 55 and 65 °C, respectively. At 35 and 45 °C, the quinoline oxidation conversion and TOC removal are especially enhanced. This indicates that the reaction temperature has a great impact on the catalytic activity. Besides, the quinoline oxidation conversion increases as reaction temperature rises. At low reaction temperature, the reaction rate is low of quinoline catalytic oxidation. First and foremost, H2O2 molecules
are difficult to activate at low reaction temperature for the formation of highly active ·OH species. Secondly, low reaction temperature is also not conducive to activating quinoline molecules.43 Therefore, the quinoline molecules
in solution cannot be oxidized effectively.
At the lower temperature, as reaction temperature rises, the quinoline oxidation conversion increases remarkably. Yet, continuous rising of the reaction temperature after reaching 75 °C cannot further increase the quinoline oxidation conversion and TOC removal, which indicates that the reaction temperature over 75 °C will not evidently impact the catalyst activity. The reason may be as follows: firstly, at high temperature, H2O2 decomposes and then
reacts with excessive ·OH.44 In the meantime, after most
quinoline has been oxidized, the rate of the reaction between the residue of quinoline and ·OH will be much lower than that for quinoline and ·OH in high content. Another factor to be considered is the inevitable formation of refractory short-chain organic acids like maleic, oxalic and formic acids after a certain run time.38
As presented in Figure 6, the time for the quinoline oxidation reaction to reach a high conversion varies at different reaction temperatures. At 55 °C, it takes 3.5 h for the
quinoline oxidation reaction to reach a conversion of 90%. At 75 °C, the foregoing time falls to 1.0 h. At 85 °C, it takes merely 0.5 h to reach the 98.5% quinoline conversion. The color of the reaction mixture also varies with temperature. At low reaction temperature, the reaction mixture color turns pale brown from colorless within 5 min and the pale brown color gets progressively deeper within 5-10 min and reaches the highest intensity at 30 min and then fades progressively. At 75 °C, the reaction mixture color turns brown within merely 1.0 min. At 85 °C, no color variation of the reaction mixture is observable. This indicates that the life of the generated intermediates depends much on reaction temperature in the quinoline degradation.
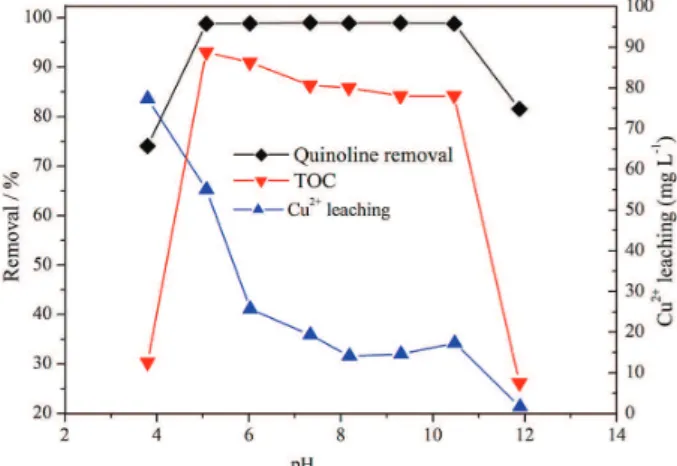
Impact exerted by initial pH value on the quinoline removal
25 mg of CC650 catalyst, 25 mL of simulated quinoline wastewater with 100 mg L-1 as concentration, but with
different pH values, and 0.5 mL of 30% H2O2 were mixed in
a reaction flask for each catalytic reaction test. The removal was measured 2.0 h after reaction at 75 °C. The results were presented in Figure 7. As can be seen in Figure 7, for pH 3.8 of reaction mixture, the quinoline oxidation conversion and TOC removal are 74.1 and 30.4%, respectively. As the pH value of reaction mixture increases to 5.1, the quinoline oxidation conversion and the TOC removal increase dramatically to 98.8 and 93%, respectively. As pH value ranges from 5.1-10.5, although the TOC removal is apparently decreasing, the quinoline oxidation conversion and the TOC removal are constantly over 98.8 and 84.1%, respectively, which indicate higher catalytic performance. For pH 11.9 of reaction mixture, the quinoline oxidation conversion and the TOC removal decline dramatically to 81.6 and 26.2%, rspectively. It is shown that the pH value has a great impact on the catalytic oxidation degradation of quinoline and the removal of TOC. As accordingly indicated, in the quinoline CWPO reaction, CeCu-mixed oxide catalysts take on good stability in a wide range of pH value. For pH 3.8 of the reaction mixture, the leaching amount of Cu2+ is peaked at 77.3 mg L-1. For pH 8.19
of the reaction mixture, the leaching amount of Cu2+
decreases to the minimum at 14.2 mg L-1, which indicates
that the leaching concentration of Cu2+ is also remarkably
associated with the pH value of reaction mixture. This concentration decreases as pH value increases.
For relatively low pH of the reaction mixture, the CuO species in CeCu catalysts are dissolvable under acidic condition, and then the structure of CeCu-mixed oxide can be destroyed as active centers decrease on the catalyst surface. Consequently, the activation of H2O2 molecules is
also diminished. Additionally, the decomposition of H2O2
to form
⋅
OH is inhibited at extremely low pH value. The decrease of highly active⋅
OH species makes quinoline oxidation conversion and TOC removal decrease.For pH value of the reaction mixture over 11.9, the quinoline oxidation conversion and the TOC removal sharply decrease. At high pH value, H2O2 reacts with
⋅
OH to generate HO2⋅
and O2.44 Thus, the amount ofOH generated in the solution decreases sharply, and the oxidation conversion of quinoline is diminished.
CeCu-mixed oxide catalysts take on good stability in a wide range of pH value. This can be stemmed from the addition of rare-earth Ce, which forms the CeCu-mixed oxide. This formation is crucial for dispersing the active components and stabilizing the crystal structure of catalysts. Compared to CuO catalyst, it is more conducive to reducing the leaching of Cu2+. In this regard, under the
condition of weak acid or alkaline, the structure of the solid solution is not easy to destroy, and more active centers can be preserved in the reaction system.
Conclusions
Using a citric acid-aided complexation-calcination method, CeCu-mixed oxide catalysts were successfully prepared, in which the Cu species can be dissolved in CeO2 lattice to form a solid solution. The calcination
temperature is crucial for an optimum catalyst structure and catalytic performance. As calcination temperature rises, CeO2 and CuO increase in the grain size and become well
crystallized. Proper calcination temperature at 650 °C can better form porous structure and abundant active oxygen species for an enhanced redox performance of these catalysts. The CeCu-mixed oxide catalysts take on good catalytic performance in the quinoline CWPO process. The quinoline oxidation conversion and TOC removal are overall dependent on the calcination temperature of the catalysts
and the reaction temperature. The calcination temperature of the catalyst and the initial pH value of the quinoline wastewater greatly impact the stability of these catalysts. For low calcination temperature and initial pH value, the CuO species in the catalysts are more likely to be leaching as Cu2+ and deteriorate the catalytic activity of the catalysts.
The CC650 catalyst prepared at 650 °C is highly active if the pH value of reaction mixture is ranging from 5.1 to 10.5. For CC650 catalyst, the oxidation reaction rate and TOC removal of quinoline are 98.0 and 80.6%, respectively, in the CWPO of quinoline at 75 °C and pH 7.3. In the meantime, the Cu2+
leaching rate reaches a minimum of 19.3 mg L-1.
Acknowledgments
This work is supported by the Key Special Project of Strategic International Scientific and Technological Innovation Cooperation (2016YFE0205600), the Project of National Natural Science Foundation of China (21676037, B061201,51408215), the Project of Scientific and Technological Research Program of Chongqing Municipal Education Commission (KJ120720), the Project of Chongqing Technology and Business University of Young Doctor Foundation (1352023) and the Project of Research Program of Chongqing Science & Technology Commission (cstc2015shmsztzx20001, cstc2017jcyjAX0192).
References
1. Thomas, J. K.; Gunda, K.; Rehbein, P.; Ng, F. T. T.; Appl. Catal., B 2010, 94, 225.
2. Wang, C. R.; Ma, K. K.; Wu, T. T.; Ye, M.; Tan, P.; Yan, K. C.;
Chemosphere 2016, 149, 219.
3. Zhu, S. Y.; Yang, X.; Yang, W.; Zhang, L. L.; Wang, J.; Huo, M. X.; Int. J. Chem. React. Eng. 2012, 9, 548.
4. Rubio-Clemente, A.; Torres-Palma, R. A.; Peñuela, G. A.; Sci. Total Environ. 2014, 478, 201.
5. Sun, L. L.; Tuo, B. H.; Wang, Q. F.; Yan, J. B.; Pet. Process. Petrochem. 2012, 43, 71. DOI: 10.3969/j.issn.1005-2399.2012.05.017.
6. Zhang, P.; Zhang, X. P.; Fang, Y. M.; Lan, Y. H.; Chem. Ind. Eng. Prog. (Beijing, China) 2013, 32, 1.
7. Mitome, T.; Uchida, Y.; Egashira, Y.; Hayashi, K.; Nishiura, A.; Nishiyama, N.; Colloids Surf., A 2013, 424, 89.
8. Niu, J. J.; Conway, B. E.; J. Electroanal. Chem. 2002, 521, 16. 9. Pinto, L. D. S.; dos Santos, L. M. F.; Al-Duri, B.; Santos, R. C.
D.; J. Chem. Technol. Biotechnol. 2006, 81, 912.
10. Chen, A. L.; Zhang, L. P.; Chang, F. M.; Ge, Y. J. K.; Wang, J.;
Chinese J. Environ. Eng. 2015, 9, 5795.
11. Stapleton, D. R.; Konstantinou, I. K.; Karakitsou, A.; Hela, D. G.; Papadaki, M.; Chemosphere 2009, 77, 1099.
12. Lin, R.; Chen, Y.; Guo, S. J.; Shao, D. W.; Geng, Z.; Huo, M. X. Z.; Liu, Q.; Zhu, S. Y.; Int. J. Chem. React. Eng. 2016, 10,
60.
13. Xing, X.; Zhu, X. P.; Li, H. N.; Jiang, Y.; Ni, J. R.; Chemosphere
2012, 86, 368.
14. Thomsen, A. B.; Laturnus, F.; J. Hazard. Mater. 2001, 81, 193.
15. Tuo, B. H.; Yan, J. B.; Fan, B. A.; Yang, Z. H.; Liu, J. Z.;
Bioresour. Technol. 2012, 107, 55.
16. Zhu, H.; Ma, W. C.; Han, H. J.; Han, Y. X.; Ma, W. W.; Chem. Eng. J. 2017, 327, 91.
17. Navalon, S.; Alvaro, M.; Garcia, H.; Appl. Catal., B 2010, 99, 1. 18. Ismael, F. M.; Elena, D.; Juan, J. R.; Angel, F. M.; Chem. Eng.
J. 2017, 318, 153.
19. Kurian, M.; Nair, D. S.; Rahnamol, A. M.; React. Kinet. Catal. Lett. 2014, 111, 591.
20. Mnasri-Ghnimi, S.; Frini-Srasra, N.; Korean J. Chem. Eng.
2015, 32, 68.
21. Trovarelli, A.; Leitenburg, C. D.; Boaro, M.; Dolcetti, G.; Catal. Today 1999, 50, 353.
22. Han, J.; Zeng, H. Y.; Xu, S.; Chen, C. R.; Liu, X. J.; Appl. Catal., A 2016, 527, 72.
23. Jiang, S. S.; Zhang, H. P.; Yan, Y.; Sep. Purif. Technol. 2018, 190, 243.
24. Tan, Y. J.; Jiang, Z. P.; Zhu, W. P.; Luo, W. S.; J. Environ. Sci. (Beijing, China) 2000, 4, 82.
25. Oxana, P. T.; Andrey, N. Z.; Artemiy, B. A.; Svetlana, A. Y.; Roman, V. P.; Zinfer, R. I.; Vladislav, V. G.; Valentin, N. P.;
Chem. Eng. J. 2015, 282, 108.
26. Zhou, G. L.; Lan, H.; Song, R. Y.; Xie, H. M.; Du, Q. X.; RSC Adv. 2014, 4, 50840.
27. Xie, H. M.; Du, Q. X.; Li, H.; Zhou, G. L.; Chen, S. M.; Jiao, Z. J.; Ren, J. M.; Korean J. Chem. Eng. 2017, 34, 1994.
28. Cao, Y. Y.; Huang, S. B.; Yin, J. Z.; J. Mol. Catal. (China) 2016,
30, 159.
29. Wang, G. Y.; Li, J. C.; Wuhan Univ. (Nat. Sci. Ed.) 2011, 57, 220. DOI: 10.14188/j.1671-8836.2011.03.005.
30. Menon, U.; Poelman, H.; Bliznuk, V.; Galvita, V. V.; Poelman, D.; Marin, G. B.; J. Catal. 2012, 295, 91.
31. Yao, H. C.; Yu Yao, Y. F.; J. Catal. 1984, 86, 254.
32. Zeng, J.; Zhou, G. L.; Ai, Y. M.; Li, N.; Zhang, G. Z.; Int. J. Chem. React. Eng. 2013, 11, 1.
33. Liu, W.; Flytzani-Stephanopoulos, M.; Chem. Eng. J. 1996, 64,
283.
34. Kundakovic, L.; Flytzani-Stephanopoulos, M.; Appl. Catal., A
1998, 171, 13.
35. Jiang, X. Y.; Lu, G. L.; Zhou, R. X.; Mao, J. X.; Chen, Y.; Zheng, X. M.; Appl. Surf. Sci. 2001, 173, 208.
36. He, C.; Yu, Y. K.; Chen, C. W.; Lin, Y.; Qiao, N. L.; Shen, Q.; Chen, J. S.; Hao, Z. P.; RSC Adv. 2013, 3, 19639.
37. Zhu, J. K.; Gao, Q. M.; Chen, Z.; Appl. Catal., B 2008, 81, 236.
38. Zeng, S. H.; Wang, Y.; Liu, K. W.; Liu, F. R.; Su, H. Q.; Int. J. Hydrogen Energy 2012, 37, 11640.
39. Song, Z. G.; Ning, Q. L.; Zhang, Q.; Liu, X.; Zhang, J. H.; Wang, Y. C.; Duan, Y. K.; Huang, Z. Z.; J. Mol. Catal. A: Chem. 2016, 413, 15.
40. Bielański, A.; Haber, J.; Catal. Rev.: Sci. Eng. 1979, 19, 1.
41. Dai, Q. G.; Huang, H.; Zhu, Y.; Deng, W.; Bai, S. X.; Wang, X. Y.; Lu, G. Z.; Appl. Catal., B 2012, 117, 360.
42. Avgouropoulos, G.; Ioannides, T.; Appl. Catal., B 2006, 67, 1. 43. Zhou, G. L.; Wei, M. Y.; Fei, L. S.; Wu, M.; Cao, Y. Y.; Zhou,
X. X.; Xie, H. M.; Water Treat Technol.2012, 38, 52. DOI: 10.14188/j.1671-8836.2011.03.005.
44. Huang, M. L.; Xu, C. F.; Wu, Z. B.; Huang, Y. F.; Lin, J. M.; Wu, J. H.; Dyes Pigm. 2008, 77, 327.
Submitted: January 18, 2018
Published online: May 25, 2018