583 Revista Científica Hermes n. 22, p. 598-605, set.-dez., 2018
APPLICATION OF QUALITY TOOLS IN SOLVING PROBLEMS IN THE PRODUCTION PROCESS OF AN ABC COMPANY – CASE STUDY
APLICAÇÃO DAS FERRAMENTAS DA QUALIDADE NA SOLUÇÃO DE PROBLEMAS NO PROCESSO PRODUTIVO DE UMA EMPRESA
ABC – ESTUDO DE CASO
Recebido: 18/04/2018. Aprovado: 12/08/2018. Publicado: 30/09/2018 Processo de Avaliação: Double Blind Review
Délvio Venanzi1
Doutor em Educação pela Universidade de Sorocaba (UNISO) Coordenador do Curso de Engenharia de Produção da UNISO
João Augusto Gali2
Mestre em Engenharia Aeronáutica e Mecânica pelo Instituto Tecnológico de Aeronáutica (ITA)
Professor do curso de Engenharia de Produção da UNISO
Haroldo Lhou Hasegawa3
Doutor em Ciência e Engeharia de Materiais pela Universidade Federal de São Carlos (UFSCAR)
Professor da Universidade Federal de Itajuba (UNIFEI)
1 Autor para correspondência. UNISO – Universidade de Sorocaba, Rodovia Raposo Tavares, km 92,5, Vila Artura, Sorocaba/ SP, Brasil. CEP: 18023-000. E-mail:
delvio.venanzi@prof.uniso.br 2 joao.gali@prof.uniso.br
584 Revista Científica Hermes n. 22, p. 598-605, set.-dez., 2018
Orlando Roque da Silva4
Doutor em Engenharia de Produção pela Universidade Metodista de Piracicaba – (UNIMEP)
Coordenador do Mestrado em Administração do Centro Universitário das Faculdades Metropolitanas Unidas (FMU)
ABSTRACT
Companies are increasingly focused on the market and its trends, being forced to seek competitive advantage through continuous improvement in process and product manufacturing methods or service generation. Hence, the article discusses the importance of an adapted proposal Troubleshooting analysis method as an effective tool in solving problems in the production process. This article aims to discuss the improvement of processes through quality tools, by focusing on the reduction of equipment downtime and their probable causes, in addition to financial loss resulting from these failures. The article intends to expose clearly a study of the applicability of quality chosen for research tools (Diagram Ishikawa and Pareto Chart) plus Matrix GUT, Stratification, Linear Regression and FMEA. The article shows that it is possible to obtain gains in processes that may be analyzed in enterprises, whenever the suggested method is applied.
Keywords: Quality tools; Quality control; Process; MASP.
RESUMO
As empresas estão cada vez mais focadas no mercado e em suas tendências, sendo forçadas a buscar o diferencial competitivo por meio da melhoria contínua nos processos e nos métodos de fabricação de produtos ou de geração de serviços. Frente a isso, o artigo aborda a importância de uma proposta adaptada do Método de Análise e Solução de Problemas (MASP) como uma ferramenta eficiente na resolução de problemas no processo de produção. O presente artigo tem como objetivo abordar a melhoria dos processos por meio do uso de ferramentas da qualidade, dando enfoque à diminuição das paradas de equipamentos e suas prováveis causas, além do desperdício
585 Revista Científica Hermes n. 22, p. 598-605, set.-dez., 2018
financeiro decorrente dessas paradas. O artigo pretende expor, de maneira clara, um estudo da aplicabilidade de ferramentas da qualidade escolhidas para a pesquisa (Diagrama de Ishikawa e Diagrama de Pareto) além de Matriz GUT, Estratificação, Regressão Linear e FMEA. O artigo mostra que é possível a obtenção de ganhos em processos que venham a ser analisados nas empresas, em sendo aplicado o método sugerido.
586 Revista Científica Hermes n. 22, p. 598-605, set.-dez., 2018
1. INTRODUCTION
In the global scenario, staying competitive has become a battle to be fought daily. No industry is at the top of its segment comfortably without worrying about what is being delivered to its customers. Protecting yourself from any risk has been the most effective way of not causing problem with your consumers and meeting your expectations. For this, the productive process has worked with tools that precede the problems that can reach its esteemed clients, proposing an action in case a deviation occurs.
The dynamic aspect of the human being implies constant intellectual, social, economic and technological evolution. In the last decades, an increase in the pace of the transformation of society is perceived. With so many changes, business survival has come to be threatened for several reasons. They see their products being replaced by new, better and/or cheaper ones; countries raising their levels of requirements to levels that are difficult to achieve in their process; its competitors using high technology equipment, adding value and increasing quality as a whole. The industrial scenario also did not remain free of transformations. At first, the companies focused only on production volume. There was no concern about the quality and compliance of the process. However, the intensification in the competitive environment has forced companies to review their processes to meet customer demans in terms of price, time and quality.
Within this context, the need to offer better products and services to compete in the market has arisen. For practical application of the concepts of quality management, tools were developed to operationalize the theory and make possible its effective use. The achievement of positive results for the isolated processes showed that the use of the quality management system combined with the tools can generate better performance in order to contribute with global benefits for the company's competitiveness.
As the relevance of this subject is great, since that there are many materials available on quality tools, this research was developed under a qualitative/quantitative character, aiming to share and expand specific knowledge and applied nature, pointing at specific problems. A case study was developed applying an adaptation of the Analysis and Problem Solving Method (MASP) in a production process. This article aims to present,
587 Revista Científica Hermes n. 22, p. 598-605, set.-dez., 2018
in a concise and concrete way, tools applied to the anticipation, treatment and mitigation of the failure modes found in a company which operates on pulp and paper industry.
2. RESEARCH METHODOLOGY
The strategy of research adopted was the case study of the company ABC in the pulp industry. The choice of this approach is in accordance with the propositions of Yin (1994), because one wishes to "investigate a current phenomenon within its real context, when the boundaries between phenomenon and context are not clearly defined and using various sources of evidence". The field research, which was carried out through a case study, used a qualitative method of descriptive (or exploratory) research. According to Lazzarini (1997), the qualitative methods are characterized by a greater focus on the understanding of the facts than in their measurement.
In the data collection the content analysis was used – which, besides performing the interpretation after the data collection, is developed through somewhat refined techniques. Content analysis has been shown to be one of the most used data analysis techniques in the field of Business in Brazil, especially in qualitative research (DELLAGNELO; SILVA, 2005).
A semi-structured questionnaire was sent to interviewers and managers. The interviews were recorded, evaluated by the researcher, transcribed to magnetic medium, and the main issues and issues addressed to the structuring of the work were analyzed. The document examination was also the subject of the study. It is worth mentioning that these interviewees have at least ten years of experience in the same company. Therefore, the article aims to discuss the improvement of processes through specific tools, focusing on the reduction of equipment downtime and its causes, supported by the financial losses to the company that this problem can cause.
3. THEORETICAL FRAMEWORK
The concern with the quality of goods and services is not recent. Consumers have always had the concern of inspecting the goods and services they received. According to Longo (1996), the concern with quality management brought a new managerial
588 Revista Científica Hermes n. 22, p. 598-605, set.-dez., 2018
philosophy based on the development of concepts, methods and techniques appropriate to a new reality. Quality is no longer an aspect of the product and only department-specific responsibility, but has become a company's problem, covering all aspects of its operation. Longo (1996) also states that implementing a quality management system in companies does not require expensive and laborious processes. It can be carried into companies without major expense through concepts that need to be absorbed by each of the workers within the company. However, it takes leadership and motivation to make everyone change their way of thinking, so the company can improve as a whole.
For Gitlow (1993), emphasizing productivity alone will sacrifice quality. On the other hand, emphasizing quality is more important because it can increase productivity, leading to the desired results: customers get high quality at a competitive price, suppliers get predictable business sources in the long run, and investors make profits, or everybody wins. A company that does not have quality planning or that does not have good quality in its processes tends to lose competitiveness.
For Deming, up to 85% of the cost of quality is managerial problems. When the matter of quality arrives at the base, at the level of the workers, they have little control to exercise. For example, if in the construction of a highway managers suggest the use of a lower asphalt, the workers who apply it can do little about quality (HELDMAN, 2006). Deming is considered the creator or main contributor of Total Quality Management (TQM), who considers the process to be the problem, not people (HELDMAN, 2006). Analyzing Deming's 14 points, it is possible to notice this when he says that companies must constantly improve the production and service system, improving quality and productivity, always reducing costs, establishing work training, leadership, adopting new philosophies, breaking down barriers between departments, so that everyone sees themselves as a team and not as competitors, ending the dependence on quality inspection as a way to achieve quality – as it generates, in addition to rework, more costs – and involving the entire organization in the task of achieving transformation. The problem should be avoided at the beginning of the process and not at the end. The Quality tools are resources to be applied as support in methods for problem solving and decision making, so it is possible to achieve the best use of resources and allowing the collection and implementation of actions to control and improve processes. These tools can help in obtaining systems that ensure continuous quality improvement.
589 Revista Científica Hermes n. 22, p. 598-605, set.-dez., 2018
Through them, one can collect, organize and analyze data and information about the processes and use the results of the analysis to identify and eliminate the root causes of the problems, solving them completely and definitively (DRUCKER, 2008). Based on this line of reasoning, the tools and techniques used in the research are described below.
3.1 LINEAR REGRESSION
The simple linear regression is to establish a linear mathematical function that describes the relation between two variables. The purpose of the regression process is then to estimate values of one variable, based on known values of the other. In this regression, Y values are predicted based on known or given values of X. Therefore, being Y as a function of X, Y is called the dependent variable, while X is called the independent variable. The most commonly used method of fitting a line to a set of points is known as the least squared technique.
Simple linear regression and correlation are two closely related techniques involving estimation. The correlation analysis provides a number that summarizes the degree of relation between two variables; as we have seen, regression results in a mathematical function that describes this relation. Correlation is the determination of the strength of the relation between two observations. The term "correlation" literally means "co-relation", because it indicates what extent the values of one variable is related to those of the other. The correlation coefficient is part of the method.
The determination of the correlation between two variables by an inspection in the annotated pairs or the corresponding dispersion diagram is not very precise and depends on training and sensitivity of the observer. One way to overcome this difficulty is to look for a measure that characterizes this correlation. The instrument used for this measure is the correlation coefficient (or "Pearson's r"), proposed by Karl Pearson. This coefficient indicates the degree of intensity of the correlation between two variables and the meaning of this correlation (positive or negative) (CALLEGARI-JACQUES, 2003).
590 Revista Científica Hermes n. 22, p. 598-605, set.-dez., 2018
3.2 ISHIKAWA DIAGRAM
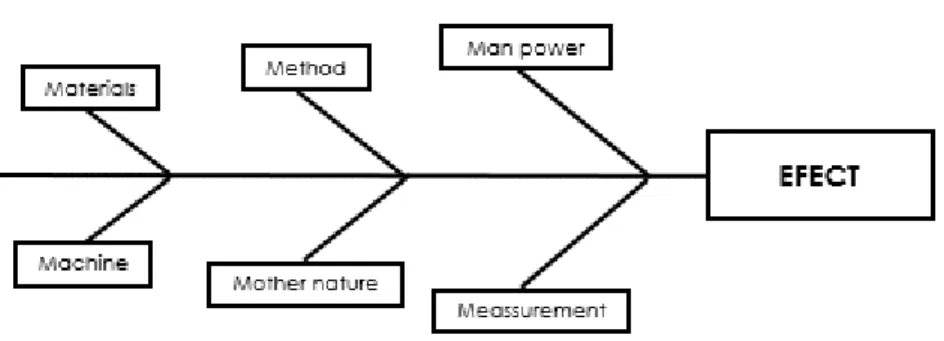
The Ishikawa Diagram was proposed by the Japanese Kaoru Ishikawa, a quality control engineer and Japanese company management theorist, who lived between 1915 and 1989. The Ishikawa Diagram, also known as the Cause and Effect Diagram or Spine of Fish, allows to hierarchically structure the causes of a problem or opportunities for improvement. It might also be used for other purposes, in addition to the one presented, because it allows structuring any system that results in a response (uni or multivariate) in a graphical and synthetic way. The causes of a problem can be grouped, from the concept of "6Ms", as a result of failures in: materials, methods, labor, machines, environment and measures. The use of the 6Ms helps to identify the causes of a problem and serve as an initial structure to facilitate reasoning in the analysis of this problem (ISHIKAWA, 1982). See Figure 1 below.
Figure 1 Ishikawa’s diagram Using 6M. Source: The authors based onIshikawa (1982).
For Ishikawa (1990), the constraint due to hierarchical (non-relational) structure is often irrelevant, especially in early approaches. The Ishikawa Diagram can evolve into a Relation Diagram (one of the Seven Quality Planning Tools or Seven New Quality Tools) that already has a more complex, non-hierarchical structure. The Ishikawa Diagrams allow us to visualize possible stratifications to be applied in the systems being studied. The stratification consists of unfolding of the system in such a way that the control items, for example, as in Figure 2, are studied in homogeneous situations, allowing the causes of the problems to be detected with greater sensitivity. For this
591 Revista Científica Hermes n. 22, p. 598-605, set.-dez., 2018
purpose, there is the "6Ms" division, which directs where the problems of a process can be:
• Labor: When an employee performs an improper procedure, does his job in a hurry, is reckless, has been poorly trained etc.
• Material: when the material does not comply with the requirements for carrying out the work.
• Environment: when the problem is related to the external environment, such as pollution, heat, dust etc., or even to the internal environment, such as lack of space, inadequate equipment dimensioning etc.
• Method: when the undesired effect is a consequence of a method chosen improperly for the work, or when there are method failures.
• Machine: when the defect is in the machine used in the process.
• Measure: when the deffect is caused by failures in overall aspect of measurements. For instance, inadequate instruments, uncalibrated indicators, improper indicators for the situation, data collection and presentation of information made in a variable periodicity, among others.
From then on, those involved need to start assessing the causes of the problem, considering the "6Ms".
FMEA is the acronym that refers to "Failure Mode and Effects Analysis" (COLLINS, 1993). In Brazil, the acronym was translated as "Análise dos modos de falhas e seus efeitos" and it works as a tool with the objective of avoiding possible problems during an industrial process. To this end, the method performs an analysis of possible failures that can occur in components generating an effect on the function of the whole set. Thus, potential failures are analyzed and improvement actions for product or process development is proposed. FMEA therefore makes use of prevention by detecting failures before they occur. Particularly the FMEA is proper to minimize or even eliminate the incidence of failures in products and processes, as well as to avoid their consequences.
Indirectly, the tool can be used to reduce costs and can also reduce the inputs used during the procedures, making processes more efficient. By lowering the chances of product or process failure, the customer also wins. When purchasing the manufactured item, the consumer will run a lower risk of buying a product that has manufacturing
592 Revista Científica Hermes n. 22, p. 598-605, set.-dez., 2018
problems, avoiding the need to contact technical assistance. Even when the outsourced service readily repairs and covers the failure, there is a degree of customer dissatisfaction.
FMEA appeared in 1949 in the United States. At that time, it was called "Procedures for Performing a Failure Mode, Effects and Criticality Analysis". Its purpose consisted of a technique for evaluating the reliability of systems and equipment failures. After some time, NASA also took over the method, and began to use variations of the tool developed by the military (STAMATIS, 2003).
Risks are evaluated in traditional FMEA in three ways: (i) severity, (ii) occurrence and (iii) detection. Severity is the assessment of the level of impact of a failure mode on the client. Occurrence is the incidence frequency of the cause of the failure mode. Detection is an evaluation of how well the product or process controls detect the causes (or possible causes) corresponding to each failure mode.
These three indexes are evaluated from a scale ranging from 1 to 10, and for all of them, the lower the score, the lower the risk. The lower the severity, the lower the impact on the customer of a possible failure (for example, severity equal to "1" is considered as no noticeable effect; severity equal to "10" involves failure to meet safety and/or regulatory requirements). The lower the occurrence score, the lower is the probability that a particular cause of a failure occurs (for example, an occurrence equal to "1" is considered as a very low probability of occurrence of the cause of the failure mode or that this cause is eliminated; on the other hand, "10" is the value assigned when the probability of failure mode cause is very high). To achieve a lower detection rating, generally the controls should be improved (for example, detection equal to "1" indicates that the problem will almost certainly be perceived; the number "10" is assigned when detection is practically impossible).
The RPN (Risk Priority Number) is traditionally determined by the product of three input factors, namely Severity (S), Occurrence (O) and Detection (D). RPN = SxOxD is then obtained. The generated result is expressed by a value between 1 and 1,000. (TENG, 2006).
593 Revista Científica Hermes n. 22, p. 598-605, set.-dez., 2018
3.3 PARETO CHART
The Pareto Chart is a bar chart that orders problems, identifying the most significant ones and measuring them in several scales, allowing the use of Pareto's theory (few essential, very trivial), that is, there are many unimportant problems before the more important ones. In addition, the Pareto Chart allows you to group data in different ways, measure the impact of process changes, and break down generic causes into specific causes. It is a graphical resource used to establish an ordering in the causes of losses that must be remedied.
It is intrinsically related to the Pareto's Law, also known as the 80-20 principle, or the 80/20 law. According to this law, 80% of the consequences derives from 20% of the causes. This law was proposed by Joseph M. Juran, a famous business consultant, who named it as a tribute to the Italian economist Vilfredo Pareto. During his research, Pareto found that 80% of the wealth was in the hands of only 20% of the population. Through this law it is possible to state that:
A. 20% of the clients are responsible for more than 80% of the profits of a certain company;
B. More than 80% of the discoveries in the scientific world results from 20% of scientists.
The Pareto Chart aims to understand the action – cost benefit ratio, that is, prioritize the action that will bring the best result. It is composed of a bar chart that sorts the occurrence frequencies in descending order and allows the localization of vital problems and the mitigation of future losses. It is one of the seven basic quality tools and it is based on the principle that most losses have few causes, or that few causes are vital and most of them are trivial.
According to Juran (2000), in the Pareto Chart values in percentage and the accumulated value of the occurrences are often included. Thus, it is possible to evaluate the cumulative effect of the surveyed items. For best results it is important to follow six basic steps:
1. Determine the purpose of the diagram, i.e., what kind of loss will be investigated;
594 Revista Científica Hermes n. 22, p. 598-605, set.-dez., 2018
classified;
3. In a table, or check sheet, organize the data with the categories of the defined aspect;
4. Make the frequency calculations and group the low frequency categories under the name "others";
5. Calculate the total and percentage of each item in relation to the total; calculate the cumulative percentage;
6. Plot the diagram.
3.4 SHEET/CHECKLIST
The Checklist begins with planning the data that must be observed, establishing the period in which the data should be collected. It contributes strongly to the analysis of the data collected and the frequency with which they occur. In addition, the Sheet/Checklist provides subsidies for other tools, built from tables (GOETSCH; DAVIS, 2016).
3.5 GUT MATRIX
Its advantage in the management of problems is to help the manager to quantitatively assess the resolution of problems that, a priori, have only qualitative characteristics, aiming to prioritize possible corrective and preventive actions to achieve a partial or total elimination of the problem. The starting point for assembly of the GUT Matrix is to list the problems, contemplating the aspects to be analyzed. Next, a note will be given for each problem listed, in three aspects: severity, urgency and trend. Severity represents the impact of the analyzed problem on some aspects such as tasks, people, results, processes and organizations, particularly the cost aspect, that represents the possible damages or losses that can result from a situation. Its effects should be analyzed in the medium and long term. To which it refers, the urgency aspect means the need for time availability to solve the problem. In other words, it represents the question of the time that exists to solve a given situation. The greater the urgency, the shorter the time available to solve the problem in question and vice versa.
595 Revista Científica Hermes n. 22, p. 598-605, set.-dez., 2018
In the trend, the potential of the problem is evidenced and the probability of the problem becomes larger over time. It is the evaluation of growth tendency, reduction or disappearing of the problem.
The calculation rule that will determine the priority of the problem is multiplied by the values assigned to severity (G), urgency (U) and trend (T). Those who present a larger product will be those faced first, since they will be the most serious, urgent and with a tendency to become worse (KEPNER; TREGOE, 1981).
4. PRACTICAL CASE
The case study was carried out in a pulp and paper company in the countryside of São Paulo state, in Brazil, which will be called ABC company. The study prioritizes the identification of problems in a paper machine, working 24 hours a day, with stops programmed only for the replacement of components with expired life cycle. This is a critical resource because, since this machine can present some downtime, the process and the entire production line are penalized, since its cost/hour is R$ 30,545.00. In order to eliminate this critical factor, by using an adaptation of the Troubleshooting Analysis Method (CAMPOS, 2004), the machine was treated as a component of a priority process to be worked on.
This way, the method contributed to a broader view of the problem. During the paper production process, the machine acts along with various items: scrubbers, inboxes, flat tables, the pressing phase and, last but not least, the drying phase of the paper produced. The scrubbers in a paper machine are responsible for removing the impurities charged in the cellulosic pulp (compared to a sieve). The inbox is responsible for the distribution of the cellulosic pulp on the flat tables, which perform the paper forming process. When pressing, a percentage of water is removed from the paper, preparing it for the drying process, where the machine stage is finished, with the paper leaving the rewinder with a moisture content of around 7.5%. Through internal control, during a certain shift, within several groups, when the forming paper passed through the flat table, downtime was detected several times for different reasons, as shown in Table 1 below:
596 Revista Científica Hermes n. 22, p. 598-605, set.-dez., 2018
Table 1 Downtime on flat table.
Downtime Time
(min)
Type
(Responsible sgment) Issue (efect) Failure (cause)
1st 21 Operational Paper rupture Obstructed tube
2nd 63 Electrical Lack of electrical
energy
Overloading (high demand)
3rd 44 Mechanical Equipment broken Wearing (lack of
maintenance) Source: Data collected in company.
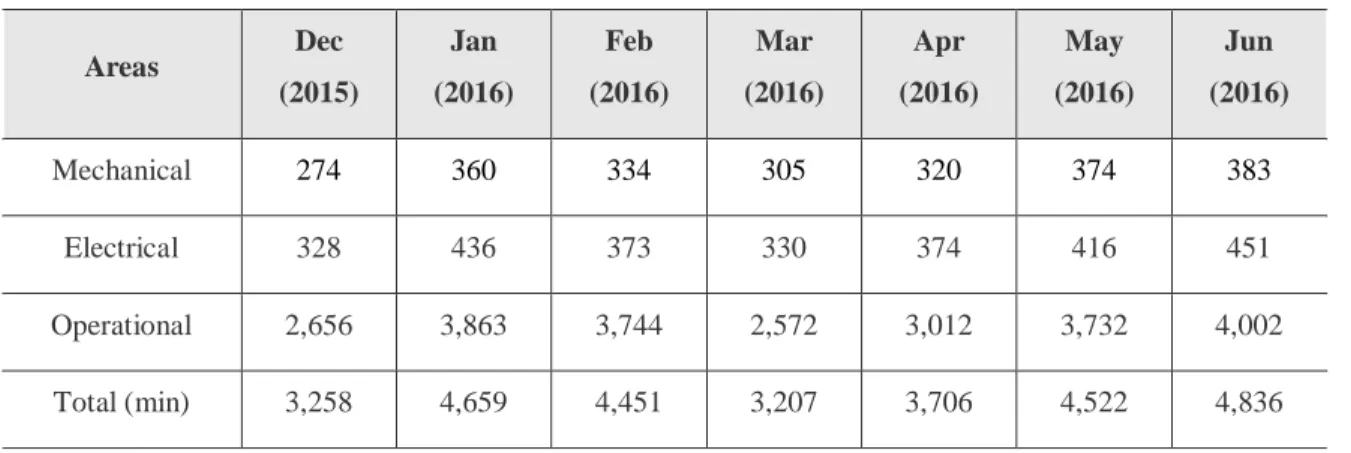
This led to the need for a better investigation, and, to this end, the records of the Production departament, from December, 2015 to June, 2016, classified within the areas (Mechanical, Electrical and Operational) were accessed. 2. The maximum limit of stops per month was of 1,100 hours involving all the categories, which was established by the production management of the factory.
Table 2 Total downtime in the period (min/month).
Areas Dec (2015) Jan (2016) Feb (2016) Mar (2016) Apr (2016) May (2016) Jun (2016) Mechanical 274 360 334 305 320 374 383 Electrical 328 436 373 330 374 416 451 Operational 2,656 3,863 3,744 2,572 3,012 3,732 4,002 Total (min) 3,258 4,659 4,451 3,207 3,706 4,522 4,836
Source: Data collected in company.
Therefore, in terms of financial losses generated by these stops, during the period surveyed, the months of January and June 2016, having more than 4,000 minutes of stops, can be classified as the most representative, within the Operational area, more representative, adding up to 18,468 minutes, or 307.8 hours, generating the amount of R$ 9,401,751.00 or, on average, approximately R$ 1,343,107.29 per month. By the fact that the result is expressive, it is unnecessary to comment on the prioritization of
597 Revista Científica Hermes n. 22, p. 598-605, set.-dez., 2018
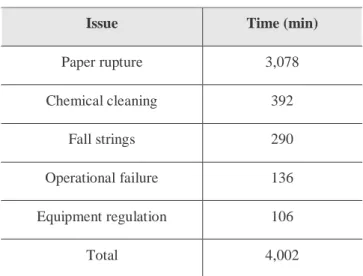
negotiations aimed at mitigating the causes that contribute to this loss. In the search for more information about the downtime occurred during the periods, the most critical was June, the largest within every month, and extracting the stops within this month were obtained its main reasons, which totalized 4,002 min. For the research at hand, along with the management of the factory, June was prioritized.
Table 3 Issues for Downtime – Operational area.
Issue Time (min)
Paper rupture 3,078 Chemical cleaning 392 Fall strings 290 Operational failure 136 Equipment regulation 106 Total 4,002
Source: Data collected in company.
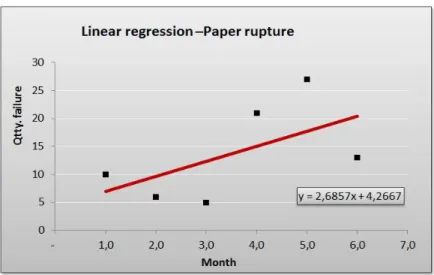
To find out the reasons that should be addressed first, a GUT Matrix was built. As Table 4 shows, it was possible to classify the problems according to the treatment priority (it would have been interesting if the costs, which justified the severity, were presented). According to this matrix, the problem that should be prioritized was "Paper breaking". For the classification of the trend, the simple linear regression method was used, and the relation between the amount of failure and time was studied.
598 Revista Científica Hermes n. 22, p. 598-605, set.-dez., 2018
Table 4 GUT Matrix for prioritizing.
Discussion of problems G (Severuty) U (Urgency) T(Tendency) GUT Priority
Paper rupture 5 5 4 100 1st
Chemical cleaning 5 5 3 75 2nd
Fall strings 3 3 3 27 4th
Operational failure 4 4 3 48 3rd
Equipment regulation 3 3 2 18 5th
Source: Data collected in company.
As a result, we have the function f(x) = 2.6857x + 4.2666, giving a slope line of approximately 69.58 degrees. It was suggested that this slope was taken as the trend qualification parameter, as shown in Table 5 below and later in the plot, in Chart 1:
Table 5 Classification of tendency versus inclination.
Inclination Tendency 0 a 17,5º 1 17,6º a 35º 2 35,1º a 52,5º 3 52,6º a 70º 4 Above 70º 5
599 Revista Científica Hermes n. 22, p. 598-605, set.-dez., 2018
Chart 1 Linear regression. Source: The authors.
In order to improve the investigations, a Pareto Diagram was built to classify the incidences related to the rupture of paper. The diagram shows that the paper break is related to the factors "Failure to cut (nozzle)" and "Dirt in the process", respectively represented by 33% and 25% of occurrences. Thus, these factors were taken for treatment in Chart 2.
Chart 2 Main ocurrences in Pareto form. Source: Data collected in company.
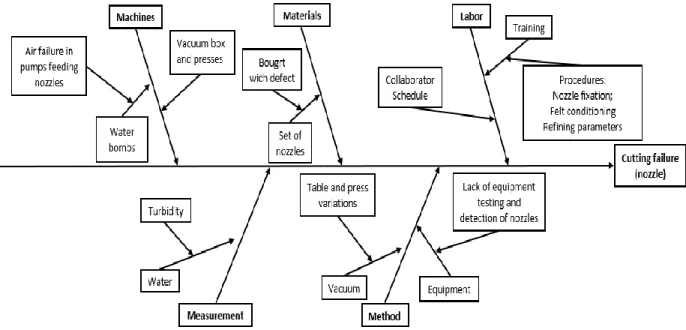
In order to analyze the causes of "Failure to cut (break)" and "Dirt in the process", another quality tool was used: the Ishikawa Diagram. Thus, it was possible to list details that contributed indirectly so that the "Paper Break" was the problem with priority of treatment. Next, in figure 2, the opening of the diagram for greater visualization of the components contributing to the effect "Cut-off (nozzle)".
600 Revista Científica Hermes n. 22, p. 598-605, set.-dez., 2018
Figure 2 Ishikawa diagram used for analysis. Source: Data collected in company.
Considering the "Machines" aspect, it will be necessary to negotiate with maintenance personnel, and employees will be alerted and aware of the problems and costs involved, emphasizing an improvement in maintenance management.
As for "Materials", management will need to have a better planning involving procurement, given the quantity of defective parts purchased. Why did this happen? Because in "Method", it was noticed that there was no equipment to test and no detection of defective nozzles during the acquisition process, making it impossible to place materials under conditions of use.
Still in "Method", there is a need for improvements in checking the tables and presses by the staff. Regarding the "Workforce", investing in training and preparing new talent: even though there was procedures to be followed, this was not happening, a fact that put managers on alert for guidelines for the mandatory and correct sequence of Internal procedures, thus seeking to reduce the chances of failure.
In "Measurement," efforts will need to be intensified. In addition to the "Method", there are problems with the pattern of nozzle fixation procedure. For this purpose, an Ishikawa Diagram has also been developed with the purpose of stratifying the causes, unfolding the problem and analyzing the reasons for each "M".
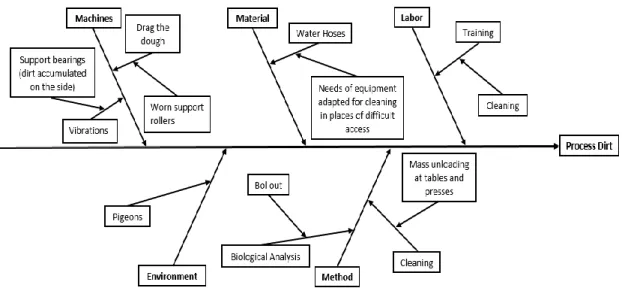
In "Machines", the analysis of the managers was directed to the bearings and support rolls. "Materials" showed the need for logistics staff to check the layout improvement,
601 Revista Científica Hermes n. 22, p. 598-605, set.-dez., 2018
to more easily access places where it can not be cleaned. The problem involving "Labor" is similar to the previous case, that is, it is necessary to invest in training and prepare new talent, since the non-execution of work as planned is considered serious fault on the part of the employees.
As for the "Medium", emphasis should be placed on the pigeons' dirt, looking for attracting these pigeons to another location, without harming them. Considering the "Method", it is necessary to meet with the microbiological analysis staff to review the "Boil Out" procedure, in addition to cleaning in general, as this may lead to leftovers from masses. This analysis resulted in the expansion of the Ishikawa Diagram allowing an analysis as detailed in Figure 3.
Figure 3 Ishikawa diagram after root cause analysis. BaseSource: Data collected in company.
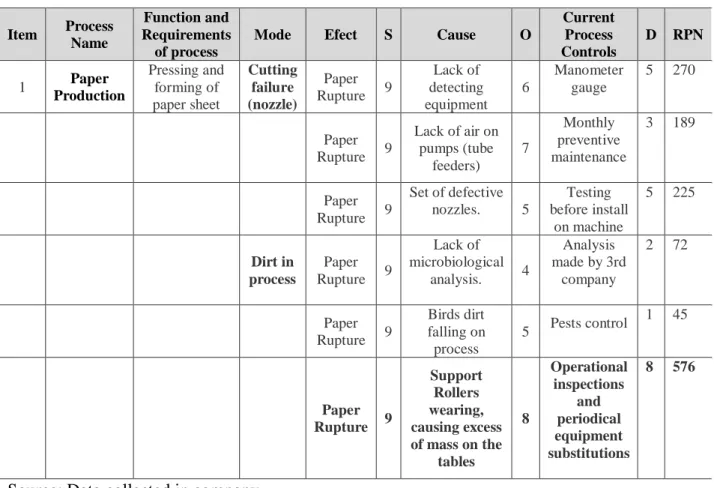
In order to choose which observations about the mentioned Ishikawa Diagrams we would work on, another tool was used: FMEA, whose objective was to relate the failure modes during the paper production process, establishing the priority of performance on them, according to the score obtained in the Columns "Severity" (S), "Occurrence" (O) and "Detection" (D), Table 6 transcribes the tool that also demonstrates the Risk Priority Number (RPN).
602 Revista Científica Hermes n. 22, p. 598-605, set.-dez., 2018
Table 6 FMEA analysis on paper production process. Item Process
Name
Function and Requirements of process
Mode Efect S Cause O
Current Process Controls D RPN 1 Paper Production Pressing and forming of paper sheet Cutting failure (nozzle) Paper Rupture 9 Lack of detecting equipment 6 Manometer gauge 5 270 Paper Rupture 9 Lack of air on pumps (tube feeders) 7 Monthly preventive maintenance 3 189 Paper Rupture 9 Set of defective nozzles. 5 Testing before install on machine 5 225 Dirt in process Paper Rupture 9 Lack of microbiological analysis. 4 Analysis made by 3rd company 2 72 Paper Rupture 9 Birds dirt falling on process 5 Pests control 1 45 Paper Rupture 9 Support Rollers wearing, causing excess of mass on the tables 8 Operational inspections and periodical equipment substitutions 8 576
Source: Data collected in company.
According to the multiplication of the Severity, Occurrence and Detection attributes raised, the "Process Dirt" failure mode (RPN = 576) should be treated as a priority, which cause is related to the wear the support rollers and which has ineffective detection mechanisms failure, or even failure cause or effect. In order to do so, the company must use action plans with responsibility and deadlines, in order to act on the problem.
5. CONCLUSIONS
This case study, from the problem that has emerged, it was possible to find a solution to figure out the Analysis and Problem Solving Method, in order to clarify the main stops of the object of study. The selection of the tools used in this article to highlight the paths and answers to the problem was based on the characteristics of the process of the studied company. The long period chosen for the sample was due to the representativeness of the machine in the production process and the financial amount in stops involved. By using tools, it was possible to search the reasons for the causes of
603 Revista Científica Hermes n. 22, p. 598-605, set.-dez., 2018
these stops, allowing the company's management to focus on the most important aspects and, consequently, on mitigating the waste. After all the evidence pointed out in the study, it is clear the importance of the applicability of the proposed method, and how beneficial this can be for the company. It is up to the Management from the moment the main reasons of the stops have come to light, the appropriate measures and corrections as soon as possible, so that the process is controlled. It has been emphasized in this article that after the problems presented, the training, the involvement of the areas, the importance of the correct use of tools, the practice of standards adopted in the process, and finally several improvements to be made to avoid such waste.
REFERENCES
CALLEGARI-JACQUES, S. M. Bioestatística: princípios e aplicações. Porto Alegre: Artmed, 2003.
COLLINS, J. A. Failure of materials in mechanical design: analysis, prediction, prevention. 2nd ed. John Wiley & Sons. Inc, Columbus, 1993.
DELLAGNELO, E. H. L.; SILVA, R. C. Análise de conteúdo e sua aplicação em pesquisa na administração. In: VIEIRA, M. M. F.; ZOVAIN, D. M. (Orgs.), Pesquisa qualitativa em administração: teoria e prática, p. 97-118. São Paulo: FGV, 2005.
DEMING, W. E. Qualidade a revolução da administração. Rio de Janeiro: Marques Saraiva, 1990.
DRUCKER, P. Ferramentas da qualidade, 2008. Available in: <http://qualidade.wordpress. com/>. Access in: July 1st, 2016.
GITLOW, H. S. Planejando a qualidade, a produtividade e a competitividade. Rio de Janeiro: Qualitymark, 1993.
604 Revista Científica Hermes n. 22, p. 598-605, set.-dez., 2018
GOETSCH, D. L.; STANLEY, D. Quality Management for Organizational Excellence Lecture. Nova Jersey: Pearson Prentice Hall, 2016.
HELDMAN, K. Gerência de Projetos: Guia para o exame oficial do PMI. 3rd ed. Rio de Janeiro: Elsevier, 2006.
ISHIKAWA, K. Guide to quality control. Tokyo: Asian Productivity Organization, 2nd review in English, 1982.
______. Introduction to Quality Control, Tokyo: 3A Corporation, 1989.
______. Introduction to quality control. California: 3A Corporation, 1990.
______. Controle de qualidade total: à maneira japonesa. Rio de Janeiro: Campos, p. 79, 1993.
JURAN, J. Juran’s quality handbook. New York: McGraw-Hill Professional, 5th ed., 2000.
KEPNER, C. H.; TREGOE, B. B. O administrador racional. São Paulo: Atlas, 1981.
LAZZARINI, S. G. Estudos de caso para fins de pesquisa: aplicabilidade e limitações do método. Pioneira, São Paulo, 1997.
LONGO, R. M. J. Gestão da qualidade: evolução histórica, conceitos básicos e
aplicação da educação, 1993. Available in:
<http://www.ipea.gov.br/pub/td/td_397.pdf>. Access in: July 1st , 2016.
STAMATIS, D. H. Failure modes and effect analysis: FMEA from theory to execution. 2nd ed. Milwaukee, Wisconsin: ASQ Quality Press, 2003.
605 Revista Científica Hermes n. 22, p. 598-605, set.-dez., 2018
TENG, S.; et al. Implementing FMEA in a collaborative supply chain environment. International Journal of Quality & Reliability Management, v. 23, n. 2, p. 179-196, 2006.