AN ANALYSIS OF EAGLE
s
:
EMERGING AND GROWTH-LEADING ECONOMIES
Inês Maria Aparício Marques
Dissertation submitted as partial requirement for the conferral of
Master in International Management
Supervisor:
Prof. António Robalo, Prof. Catedrático, ISCTE Business School, Departamento Marketing, Operações e Gestão Geral
III RESUMO
A globalização abriu imensas oportunidades em várias áreas, com os países cada vez mais integrados e, consequentemente, contribuindo para o desenvolvimento econômico mundial. Existem nações – países desenvolvidos – mais evoluídos do que outros – países emergentes, principalmente devido às fortes políticas de controlo, onde as agências governamentais desempenham um papel central na economia. Mas estas tendências estão a mudar e as nações emergentes estão a fazer avanços no sentido da liberalização, privatização e mudanças legislativas.
EAGLEs (Emerging and Growth-Leading Economies) é um acrônimo criado pelo BBVA Research e designa um grupo de países que são considerados como países emergentes. É importante mencionar que o relatório pertinente é revisto anualmente, proporcionando assim uma análise actualizada e uma maior credibilidade. Em 2012, nove nações foram consideradas EAGLE: Brasil, China, Índia, Indonésia, México, Rússia, Coréia do Sul, Taiwan e Turquia.
Neste trabalho foi feita uma análise comparativa aos países indicados,nomeadamente foi realizada a análise PESTEL, a fim de se verificar se um EAGLE deve ser considerado como país emergente ou avançado.
Depois de um exame profundo a 100 indicadores importantes, abrangendo todas as categorias de PESTEL, chegou-se à conclusão de que a Coreia do Sul e Taiwan devem ser considerados como desenvolvidos e, portanto, devem ser excluídos dos EAGLEs. De fato, existem grandes diferenças em alguns tópicos entre 2 EAGLEs (Coréia do Sul e Taiwan) contra 7 EAGLEs (Brasil, China, Índia, Indonésia, México, Rússia e Turquia) e, a fim de defender a teoria de que ambos os países devem ser apresentados como desenvolvidos, a comparação com outros mercados desenvolvidos, pela classificação 2014 do Fundo Monetário Internacional, é tido em conta nesta tese.
IV ABSTRACT
Globalization opened up immense opportunities in many fields, with countries increasingly integrated and, consequently, contributing for world economic development. There are nations – developed countries – more evolved than others – developing countries, mostly due to the strong control policies, where government agencies play a central role in economy. But these trends are changing and the emerging nations are making advances towards liberalization, privatization and legislative changes.
EAGLEs (Emerging And Growth-Leading Economies) is an acronym created by the BBVA Research and designates a group of countries which are considered as emerging countries. It is important to mention that the pertinent report is revised yearly, thus providing an updated analysis and a greater credibility. In 2012, 9 nations were considered EAGLE: Brazil, China, India, Indonesia, Mexico, Russia, South Korea, Taiwan and Turkey.
In this workwas made a comparative analysis was made of the countries listed, namely was performed a PESTEL analysis, in order to verify if an EAGLE should be regarded as emerging or advanced country.
After a deep examination of 100 important indicators, covering all categories of PESTEL, it came to conclusion that South Korea and Taiwan must be considered as developed and, therefore, must be excluded from EAGLE. Indeed, there are major differences in some topics between 2 EAGLEs (South Korea and Taiwan) vs 7 EAGLEs (Brazil, China, India, Indonesia, Mexico, Russia and Turkey) and, in order to defend the theory that both countries must be presented as developed, a comparison with other advanded markets, by 2014 International Monetary Fund classification, is take into account in this thesis.
VI INDEX
Resumo ... III Abstract ... IV
Index ... VI Index of tables and figures... IX
List of abbreviations ... XIII Glossary ... XV
Sumário executivo ... XIX
Chapter 1: Introduction ... 1
I. Introduction ... 2
II. Methodology and structure ... 2
Chapter 2: Globalization and emerging countries ... 4
I. Globalization ... 5
II. Emerging countries ... 6
III. Globalization in emerging countries ... 8
Trade ... 9
Capital movements ... 9
Movement of people ... 11
Spread of knowledge (and technology) ... 12
IV. Emerging countries: terminology ... 13
List of emerging countries by group of analysts ... 13
V. BBVA Research ... 14
VI. EAGLEs ... 16
VII
Economic outlook ... 17
EAGLEs Macroeconomic risks ... 19
EAGLEs potential brakes to growth ... 21
Chapter 3: EAGLEs – PESTEL analysis ... 24
I. Brazil ... 25 Sector composition ... 26 II. China ... 27 Sector composition ... 28 III. India ... 29 Sector composition ... 30 IV. Indonesia ... 31 Sector composition ... 32 V. Mexico ... 33 Sector composition ... 34 VI. Russia ... 35 Sector composition ... 36
VII. South Korea ... 37
Sector composition ... 38
VIII. Taiwan ... 39
Sector composition ... 40
IX. Turkey ... 41
Sector composition ... 42
Chapter 4: EAGLEs – 2050: 2 perspectives ... 43
I. Introduction ... 44
II. Dadush and Shaw (2011) ... 44
VIII
Chapter 5: Conclusions ... 48
I. Introduction ... 49
II. Developing countries ... 49
III. Developed countries ... 57
IV. Conclusions ... 65 Limitations ... 66 Bibliography ... 71 Annexes ... 78 Tables ... 79 Figures ... 118
IX INDEX OF TABLES AND FIGURES
Tables ... 79
Table I: World merchandise trade by region and selected economies ... 79
Table II: World trade in commercial services by region and selected economies ... 80
Table III: MPI for emerging markets ... 81
Table IV: Economy: the largest by PPP ... 81
Table V: Population: the largest ... 82
Table VI: Estimates of the gain from migration ... 82
Table VII: South-South migration rivaling South-North ... 83
Table VIII: A snapshot of the BRICs ... 83
Table IX: Emerging markets by each group of analysts version 1 ... 84
Table X: Emerging Markets and Industrialized Economies considered by BBVA Research ... 85
Table XI: Emerging Markets by Each Group of Analysts version 2 ... 86
Table XII: EAGLEs against other economic concepts ... 87
Table XIII: Real GDP growth rates adjusted by PPP ... 87
Table XIV: 45 Emerging Markets and G7 projections ... 88
Table XV: Contribution to world economic growth ... 89
Table XVI: Assessment on challenges form demographic and Labour market dynamics .. 90
Table XVII: How much less/more growth is needed for an EAGLE /Nest to end up in the Nest/EAGLE group ... 90
Table XVIII: Macroeconomic risks indicators ... 91
Table XIX: Potential brakes to growth indicators ... 92
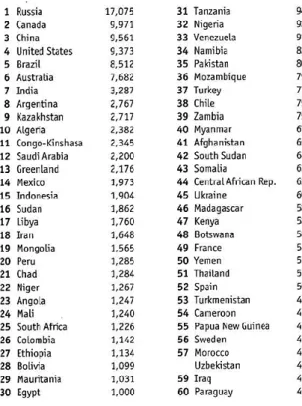
Table XX: Countries: the largest ... 93
Table XXI: Official reserves ... 93
Table XXII: Largest industrial output ... 94
Table XXIII: Largest services output ... 94
Table XXIV: Largest agricultural output ... 95
Table XXV: Largest market capitalisation ... 95
Table XXVI: Largest value traded ... 96
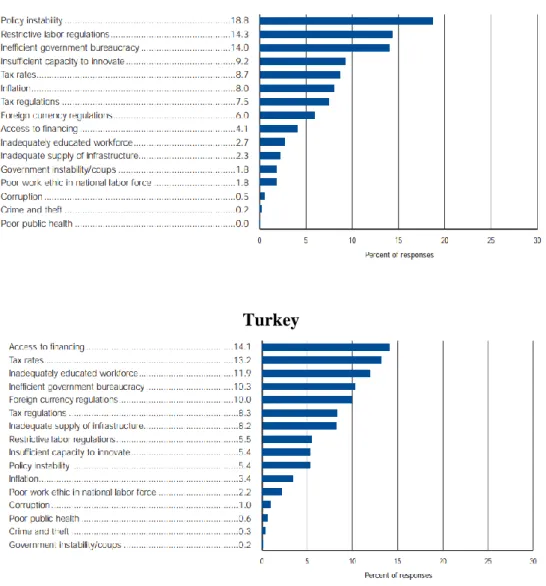
Table XXVII: The most problematic factors for doing business ... 96
Table XXVIII: The World’s 10 largest economies ... 99
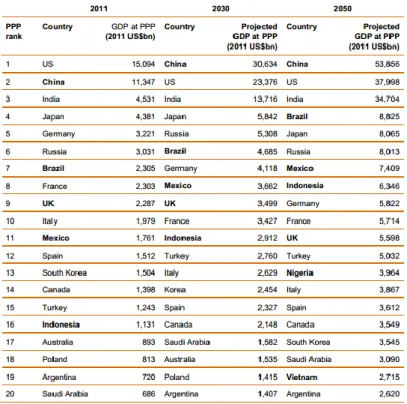
Table XXIX: Actual and projected top 20 economies ranked based on GDP in PPP terms ... 100
Table XXX: Investment rate assumptions ... 100
X
Table XXXII: Information from The Economist ... 105
Table XXXIII: List of countries ... 107
Table XXXIV: Conclusions ... 112
Figures ... 118
Figure I: Population pyramid of EAGLE’s ... 118
Figure II: Share of key global economic factors ... 121
Figure III: GDP based on PPP share of world total – Emerging countries ... 122
Figure IV: Export shares fall for the developed, climb for the developing ... 122
Figure V: Financial flows to developing countries – Risings before The Great Recession ... 123
Figure VI: Developing country reserves surpass the high-income share ... 123
Figure VII: FDI inflows, global and by group of economies ... 124
Figure VIII: FDI outflow shares by major economic groups ... 124
Figure IX: MNC’s top prospective host economies for 2012-2014 ... 125
Figure X: More immigrants in industrial countries ... 125
Figure XI: Membership criteria for the EAGLEs and the Nest ... 126
Figure XII: EAGLEs and Nest ... 126
Figure XIII: 45 EM without BRICs vs G6: current economic size and incremental GDP 2011-2021 ... 127
Figure XIV: EAGLEs, Nest and G7: current economic size and incremental GDP 2011-2021 ... 127
Figure XV: Real GDP growth rates adjusted by PPP ... 128
Figure XVI: Share of World GDP adjusted PPP: 45 Emerging Markets vs Industrialized Economies ... 128
Figure XVII: Global Leaders in the next 10 years: GDP adjusted by PPP ... 129
Figure XVIII: Global Leaders in the next 10 years: contribution to World economic growth 2011-2021 ... 129
Figure XIX: EAGLEs (excluding China and India): contribution to World economic growth 2011-2021 ... 130
Figure XX: G6 (G7 excluding the US): contribution to World economic growth 2011-2021 ... 130
Figure XXI: EAGLEs (excluding China and India)* vs G6 Economies: current economic size and contribution to World economic growth 2011-2021 ... 131
Figure XXII: Nest, G6 and Other Economies: current economic size and contribution to World economic growth 2011-2021 ... 131
Figure XXIII: Contribution to World economic growth by region between 2011-2021 ... 132
Figure XXIV: GDP (PPP) per capita (intl $), 1990-2011 ... 132
XI
Figure XXVI: Average real growth in GDP at PPP (2011 – 2050) ... 135
Figure XXVII: Relative size of G7 countries and E7 economies: 2011 and 2050 ... 136
Figure XXVIII: E7 and G7 growth paths in PPP terms ... 136
Figure XXIX: Relative GDP at MER’s and PPP’s in 2050 (as % of US level) ... 136
Figure XXX: Projected GDP growth paths of China and the US ... 137
Figure XXXI: GDP per capita levels in PPP terms for the G7 and E7 economies ... 137
Figure XXXII: UN estimates of average working age population growth to 2050 (% per annum) ... 138
XIII LIST OF ABBREVIATIONS
2 EAGLEs – South Korea and Taiwan
7 EAGLEs – Brazil, China, India, Indonesia, Mexico, Russia and Turkey B – Billion
BBVA – Banco Bilbao Vizcaya Argentaria
BM&F BOVESPA – Brazilian Securities, Commodities and Futures Exchange BRIC – Brazil, Russia, India and China
BRICS – Brazil, Russia, India, China and South Africa
CCASG – Cooperation Council for the Arab States of the Gulf CIA – Central Intelligence Agency
CIVETS – Colombia, Indonesia, Vietnam, Egypt, Turkey and South Africa E7 – Brazil, China, India, Indonesia, Mexico, Russia and Turkey
EAGLEs – Emerging and Growth-Leading Economies EIU – Economist Intelligence Unit
EM – Emerging Markets EU – European Union
FDI – Foreign Direct Investment FII – Foreign Indirect Investment
FTSE – Financial Times and Stock Exchange
G6 – France, United Kingdom, Canada, Japan, Italy and Germany
G7 – France, United States, United Kingdom, Canada, Japan, Italy and Germany GDP – Gross Domestic Product
GNI – Gross National Income HDI – Human Development Index IE – Industrialized Economies IMF – International Monetary Fund IGDP – Incremental GDP
IT – Information Technology M – Million
M&A – Mergers and Acquisitions MER – Market Exchange Rates
XIV MNC – Multinational Corporation
MNE – Multinational Enterprise MPI – Market Potential Index
NAFTA – North American Free Trade Agreement
NEXT ELEVEN (N-11) – Bangladesh, Egypt, Indonesia, Iran, Mexico, Nigeria, Pakistan, Philippines, South Korea, Turkey and Vietnam
OECD – Organisation for Economic Co-operation and Development PPP – Purchasing Power Parity
PRB – Population Reference Bureau PwC – PricewaterhouseCoopers R&D – Research and Development ROI – Return On Investment T – Trillion
TI – Transparency International TFP – Total Factor Productivity
UNCTAD – United Nations Conference on Trade and Development UNDP – United Nations Development Programme
USCB – United States Census Bureau USSR – Union of Soviet Socialist Republics WEO – World Economic Outlook
WFE – World Federation of Exchanges WIR – World Investment Report WTO – World Trade Organization
XV GLOSSARY
Brownfield Investment – Acquisition of existing production facilities
Broad money – “Quasi money” (total quantity of time, savings and foreign currency deposits) plus narrow money
Commonwealth of Independent States – Armenia, Azerbaijan, Belarus, Kazakhstan, Kyrgyzstan, Moldova, Russia, Tajikistan and Uzbekistan (former Soviet Union)
Cost of living – Cost of sustaining a typical international lifestyle in the nation. Countries are ranked by urban prices characterized in each economy, where people will face these costs overseas. Also, prices are based on products which are comparable quality internationally and are bought in supermarkets or department stores
Democracy Index – Based on 5 dimensions: political culture; political participation; electoral process and pluralism; civil liberties and functioning of government. Moreover, there are 4 types of regimes: full democracies; flawed democracies; hybrid regimes; and authoritarian regimes
Ease of Doing Business Index – Regulatory environment in starting and operation of a local company on 10 topics: starting a business; dealing with construction permits; getting electricity; registering property; getting credit; protecting investors; paying taxes; trading across borders; enforcing contracts and resolving insolvency
Economic Freedom Index – Labour and business freedom information. Banking system, property rights, trade policy, foreign investment procedures, regulation policy, black market size, extension of price and wage controls and economic output spent by the government are also taking into account
External balance – Amount of surplus or deficit in the current account of a country. Reflects the money gained by exports and the money spent on imports
FDI Inflow – A country receives investment from other economies FDI Outflow – A nation which makes investments in other markets
Financial Assets – Foreign stocks; bonds issued by governments or firms and currency Fiscal Balance – Quantity of surplus or deficit money that a government of a country has from tax income plus profits of assets sold minus government expenditure
Foreign Indirect Investment – Process when money is used to purchase financial assets in another economy, expecting generate positive financial return
XVI Foreign Direct Investment – Process when a company establishes, acquires or increases production facilities in a foreign economy
G6 – G7 countries but excluding United States due to its size. However, USA are only excluded from benchmark in EAGLEs analysis
G20 – Together account for more than 80 percent of world GDP and global trade: Argentina, Australia, Brazil, Canada, China, European Union, France, Germany, India, Indonesia, Italy, Japan, Mexico, Russia, Saudi Arabia, South Africa, South Korea, Turkey, United Kingdom, United States
Gender Inequality Index – Inequality in achievement between men and women in 3 categories: labour market; reproductive health and empowerment
Gini Index – Disparity relative to distribution of wealth within an economy. From 0 (perfect income equality, same amount of money for all citizens) to 100 (imperfect income inequality, this means that one person has all income/consumption and all others have none)
Global Competitiveness Index – Productivity and prosperity of an economy in 12 pillars: institutions; infrastructure; macroeconomic environment; health & primary education; higher education & training; goods market efficiency; labour market efficiency; financial market development; technological readiness; market size; business sophistication and innovation Greenfield Investment – Establishment of new production facilities
Gross Domestic Product – Total value of a country’s output of goods and services.
1. Purchasing Power Parity: is accurate because it measures relative living standards because it compensates the weakness of local currencies of developing countries in international markets. Also, it compares goods with similar costs in different economies. Measures the domestic purchasing power of average consumer or producer within an economy
2. Market Exchange Rates: is the exchange rate in the international foreign exchange market. However, this method do not decrease the discrepancy between high and low income nations
Gross domestic savings – Final consumption spending minus Gross national disposable income (GNI + current transfers in cash receivable - current transfers in cash payable, between resident and non-resident entities): personal saving + business saving + government saving. Higher savings leads to a higher income of a country and, consequently, the increase of national wealth
XVII Gross National Income (PPP) – Total domestic and foreign value added by all citizens of a nation, plus product taxes (minus subsidies) not included in output, plus net income received from abroad
Human Development Index – Takes into account various spheres (life expectancy at birth; mean years of schooling; expected years of schooling; Gross National income per capita) Incremental GDP – Expected GDP growth average rate in the next 10 years
Inflation rate – Percent change of prices between actual and previous year and measures the cost of purchasing a basket of goods and services to the average consumer
Liquidity – Degree of buy or sell an asset in the market without affect the asset’s price
Market capitalization – Total value of issued shares of public companies and represents the worth value of an enterprise in public markets
Market value – Stock price of a share, where each share has their own price and they are available in publicly traded markets for investors to sell and buy
Money supply (M2) – “Cash” available to purchase goods and services Narrow money (M1) – Total money in circulation and demand deposits
Networked Readiness Index – How prepared a country is in order to apply information and communications technology. Economies with higher score are best promoting economic growth, productivity and quality employment
Press Freedom Index – Degree of freedom which citizens, journalists and news enterprises in a nation. Efforts made by authorities in order to respect and guarantee respect for freedom are also taking into account.
Private Capital Outflows – Difference between account deficit and the sum of changes in reserves and net capital inflows
Prosperity Index – Ranked by the performance of 8 different indicators: economy; social capital; health; personal freedom; governance; education; safety & security and entrepreneurship & opportunity
Risk Aversion – Certainty/uncertainty of buying or selling an asset which involves an expected payoff
Stock of domestic credit – Total amount of credit, in a local currency, provided by banks and other organizations
Total Factor Productivity – Degree of efficiency of all inputs in a production process
Trade Openness – Openness to international trade and economic integration. Reflects the dependence on exports and imports of goods and services in GDP
XIX SUMÁRIO EXECUTIVO
A integração das economias emergentes, particularmente das de rápido crescimento (com mais de 5% de crescimento anual), nas transações comerciais globais e investimentos internacionais, salienta a crescente participação destes países na globalização. À medida que a globalização progrediu, as condições de vida melhoraram significativamente em quase todos os países e milhares de pessoas saíram da pobreza. Com o crescimento da classe média nas nações em desenvolvimento, a procura de produtos e serviços mais avançados tem aumentado, comparativamente há uns anos atrás.
Estes países estão interessados em melhorar a quantidade e qualidade das suas infraestruturas com o objetivo de fomentar a sua competitividade no mundo. De fato, as nações emergentes têm maior quota de população, capital e tecnologia, que impulsiona o crescimento do produto interno bruto (PIB) mundial. Atualmente, os mercados emergentes representam no mundo 85% da população; 78% de área na terra; 76% das reservas em moeda estrangeira; 58% da energia consumida; 50% do PIB em termos de paridade do poder de compra; 50% das exportações; 32% do PIB e 12% em capitalização do mercado.
O BBVA Research identificou um grupo de países-chave emergentes em 2010, denominado por EAGLEs. Em 2012, 9 países faziam parte deste grupo: Brasil, China, India, Indonésia, México, Rússia, Coreia do Sul, Taiwan e Turquia, sendo esperado que os mesmos contribuíssem aproximadamente 58% para o desenvolvimento global económico, no período 2011-12. As principais vantagens deste estudo são a dinâmica de entrada e saída de países do grupo, conforme a sua performance; não é um grupo fixo ligado a um acrónimo (como por exemplo, BRICS, CIVETS, MIST/MIKT, onde cada letra representa a inicial do nome de um país) e é revisto anualmente e de acordo com as últimas previsões. Por outro lado, EAGLEs foca-se no PIB incremental e, consequentemente, no seu contributo para o desenvolvimento económico mundial na próxima década.
Em 2050, China, Brasil, India, Rússia, Indonésia e México estarão no top 10 das maiores economias no mundo e um dos fatores responsáveis pelo crescimento espontâneo é a tecnologia. Os países emergentes do G20 (todos os EAGLEs com exceção de Taiwan e outros) irão apresentar incrementos superiores comparativamente aos países avançados em termos de mão-de-obra, investimento, poder de compra, atratividade do mercado, valorização das taxas de câmbio e produtividade total os fatores. Além disso, 68% do PIB em termos de paridade do poder de compra irá pertencer às nações em desenvolvimento do G20 e 70% da atividade e
XX comércio internacional, em 2050. De fato, o peso da China, Brasil, India, Rússia, Indonésia e México no PIB dos G20 irá verificar um aumento de 19,6% em 2009 para 50,6% em 2050.
Em 2017, China irá ultrapassar os Estados Unidos como a maior economia a nível mundial no PIB em termos de paridade do poder de compra. India será terceiro e Brasil quarto. Turquia será maior que a Itália; México e Indonésia maior que o Reino Unido e a França. A Rússia será a maior economia na Europa, ultrapassando a Alemanha em 2020.
Depois de uma árdua análise de vários indicadores entre as várias categorias PESTEL (Política, Econômica, Social, Tecnológica, Ambiental e Legal), chegou-se à conclusão que os 9 países considerados pelo BBVA Research em 2012 como EAGLEs, existem 2 países que devem de ser considerados como países desenvolvidos e não emergentes: Coreia do Sul e Taiwan.
Por fim, é importante mencionar que a Coreia do Sul e Taiwan, como países desenvolvidos, registam valores muito superiores em alguns importantes indicadores comparativamente aos restantes EAGLEs (Brasil, China, India, Indonésia, México, Rússia e Turquia), nomeadamente densidade populacional; produto interno bruto per capita; valor $ per capita no setor da indústria e serviços; saídas de investimento estrangeiro direto per capita; número de empresas registadas per capita; ranking liberdade econômica; índice facilidade em fazer negócios; menor índice de corrupção; stock de crédito interno; exportações em valor per capita e em percentual do PIB; capitalização do mercado; menor fragilidade do estado; avaliação geral da infraestrutura; esperança média de vida; menor mortalidade infantil; menor desigualdade de rendimento; pesquisa e desenvolvimento como percentual do PIB; consumo de energia; índice desempenho ambiental; reservas oficiais per capita; ranking prosperidade.
1 CHAPTER ONE
2 I. Introduction
The topic of this thesis is the analysis of Emerging And Growth-Leading Economies, a grouping of key emerging countries developed by BBVA Research and its advantages over other known studies like BRICS and Next Eleven by the Goldman Sachs and CIVETS by the Economist Intelligence Unit. What is presented is a deep investigation of each EAGLE, based on BBVA Research 2012 report, in order to verify the verisimilitude of each country within the group.
The development and transformation of the globalization process has become a necessary consequence for economic development. The world is experiencing one of the greatest revolutions in history, with the transfer of economic power from developed to most emerging countries. This is due to market reforms (targeted policies to the outside world), where developing nations are growing much faster than the developed and are gathering all the necessary conditions to develop even further.
Economic activity will become increasingly concentrated in developing countries in general and, more specifically, a limited group of countries, i.e., EAGLEs. This study considered 9 countries in 2012: Brazil, China, India, Indonesia, Mexico, Russia, South Korea and Taiwan where it is expected that they will lead economic growth in the next 10 years.
Developing countries are of strategic importance for sustainable development worldwide. These nations should demonstrate a growing demographics, rising incomes in the household, increasing the availability of credit to households and businesses and, finally, productivity.
II. Methodology and Structure
In the present chapter, introduction to the context of this thesis has been defined, where the methodology and structure have been addressed (chapter one).
In the following chapter, we illustrate the conceptualization of globalization and the current predominance of power in the global economy as well new challenges and opportunities due to globalization. Furthermore, an introduction to emerging countries is made and their advantages to develop even further are mentioned. Afterwards, a connection between globalization and developing economies is made, identifying four indicators of globalization (trade; capital movements; movement of people; spread of knowledge (and technology)) where, in each topic, emerging markets are described. Afterwards, different terminologies about developing nations (BRICS; Next Eleven; MIST/MIKT; CIVETS; EAGLEs, among others) created by different
3 institutions are presented and a table with countries is presented in order to identify the countries that each organization sets as emerging. As the EAGLEs study belongs to the BBVA Research, this institution is introduced in this thesis and the EAGLEs concept is explained as well the advantages over other studies about developing economies. Moreover, the 2012 report of the BBVA Research is exposed and their statistics taken into account: the economic outlook subchapter. Indeed, two essential themes were addressed and developed: EAGLEs macroeconomic risks and EAGLEs potential brakes to growth (chapter two).
The PESTEL analysis (Political, Economic, Social, Technological, Environmental and Legal) was used in order to describe past and current facts about the 9 EAGLEs (Brazil, China, India, Indonesia, Mexico, Russia, South Korea, Taiwan and Turkey), with a subchapter about the sector composition: agricultural, industrial and service sectors (chapter three).
An analysis about the future, with estimations about the 9 EAGLEs in the year of 2050 is presented next. Two perspectives made by different sources are illustrated: Dadush and Shaw, 2011; PricewaterhouseCoopers, 2013. In both perceptions, key challenges and opportunities, essentially in GDP and demographics, for emerging countries in 2050 demonstrate similarity in their results (chapter four).
Finally, the 9 countries are discussed based on international rankings from reliable sources, characterized in each PESTEL category. After extensive research, it came to conclusion that some EAGLEs should be considered as developed and not as developing economies: South Korea and Taiwan. To defend this theory, it is essential to illustrate major differences between these 2 countries with other EAGLEs but, on the other hand, it is also important to mention advanced countries in this analysis in order to compare similarities with South Korea and Taiwan. Moreover, it is worth mentioning that, in order to have a comparable basis between countries, the value of each indicator assessed is divided by population of the respective country and, when comparing per capita values of these two nations with industrial economies, should be with similar population: Spain will be for South Korea and Australia to Taiwan. A table with 100 indicators was created and organized accordingly to 9 EAGLEs and a classification was given: 1 – best positioned to 9 or below – worst positioned, in each subject. This means that a country with 1 was best placed in a world ranking, comparatively with other EAGLEs. Major topics were mentioned: GDP by PPP, infrastructure, governance, sector composition, FDI, debt, trade, population, labour force, income, R&D, among others (chapter five).
4 CHAPTER TWO
5 I. Globalization
The term globalization achieved an important relevance in the 80s since it was used to describe technological advances in international transactions. Currently, it defines the growing intensity of worldwide interconnectedness (Baylis et al., 2011).
Globalization can be conceptualized as “the process through which an increasingly free
flow of ideas, people, goods, services, and capital leads to the integration of economies and societies. Major factors in the spread of globalization have been increased trade liberalization and advances in communication technology” (IMF, 2006) and as “a movement which facilitates the coordination and/or the integration of industrial and marketing operations beyond national borders, by generating the decompartmentalisation of markets and underlining the interdependence of the actors” (Milliot and Tournois, 2010).
Hamilton and Webster (2012) depict globalization as the process of global economic, political, social, technological and environmental integration among nations. Depending on the levels of integration, these links can be weak or strong. For Czinkota et al. (2011), it involves the exchange of goods, services, money and people where barriers (physical, political, economic and cultural) between countries and regions are reduced or even removed. The downfall of these barriers means that all countries worldwide have unrestricted access to other nations and their markets (Lawal, 2006).
While the importance of international exchanges increases, nations build relationships in an integrated and interdependent way. Yet, several countries are becoming more integrated into the global economy and more quickly than others. Economies with high integration have faster growth mainly due to outward-policies which are essential for economic development since they bring greater wealth and dynamism instead of inward-policies (economy flat or decreased, poverty raising and high inflation).
Until now, the global economy was predominantly constituted by three trade blocs: NAFTA which includes Canada, USA and Mexico;
Japan;
Western Europe, mainly, the EU member states.
A major share of foreign trade and investment is made within and between these clusters. They are called the triad and their main traders and investors are the big multinational companies. Moreover, most of the world trade is internal. According to Hamilton and Webster (2012), more than 60% of EU trade is made between the member states.
6 In international trade, the triad represents 55 percent of world exports and imports. WTO: World Trade Report 2012 shows that weight between goods (82%) and services (18%) in world trade is discrepant, in 2011 (Annexes Table I). United States was the largest trader (10.47% imports + exports) in merchandise. However, their imports were superior to exports (+39,5pp), according to weight of total trade (imports + exports). China was second (10.18 percent) and Germany third (7.62%). Regarding commercial services (Annexes Table II), United States was still first (12.1pp), Germany takes second place (6.7 percent) and United Kingdom third (5.55 %). Finally, in international investment, the triad is leading but China and India are quickly growing in this area (Hamilton and Webster, 2012).
New challenges and opportunities for global growth have emerged due to globalization: new markets and capital flows, innovative technology, stabilized macroeconomic conditions, cheaper imports, larger export markets, higher savings and investment rates, effective government support in the private-sector and improved cross-cultural communication, according to Dadush and Shaw (2011). Still, there are some risks: the higher the interdependence, the higher the vulnerability of actors to external events (Nester, 2010).
II. Emerging countries
“India and China, which constitute the majority of the world’s population, may also provide the biggest potential market opportunity for marketers in the twenty-first century”
(Czinkota et al., 2011).
Emerging markets “have growing economies and a growing middle class. Some of these
countries were once poor, and some still have high rates of poverty. Many are undergoing profound social and political change for the better” (Logue, 2011).
FTSE (2010) quotes that “the generic term emerging markets is used to describe a nation's
social or business activity in the process of rapid industrialization. The term "rapidly growing economy" is now being used to denote emerging markets”.
A World Bank economist referred that emerging nations are in a transitional phase from developing to developed status. These countries are working in order to restructure their economies, to integrate in market-oriented globalization where opportunities in trade, technology transfers and foreign investment are available. According to MPI - Global Edge (2012), Singapore is first on the rank, followed by Honk Kong and China, in 2011 (Annexes Table III).
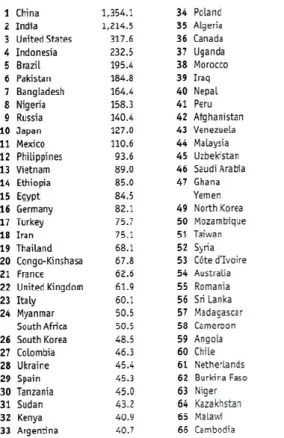
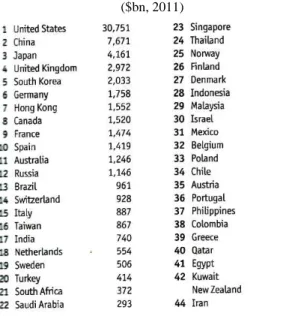
7 More than 100 countries worldwide are not triad members. Most of them are emerging markets characterized by their rapid growth and impact in global economy (Czinkota et al., 2011). In 2010, four developing nations - China (2nd), India (4th), Russia (6th) and Brazil (9th) – were ranked in top 10 of largest economies in the world by the Economist (Annexes Table IV) and it is forecasted by the Wealth Report 2012 a higher growth in the coming years.
Emerging countries are generally represented by large population and an important source of inputs including products, technology and value-adding capabilities. In these nations, the government is changing traditional policies for achieving a sustainable economic and market-oriented growth. Furthermore, they are the world’s fastest growing economies, an essential part of the contribution to international trade development and, possibly, the major buyers of goods and services in future (Ganster, 2001).
According to USCB and PRB (2012), demographic profiles of developing markets are typically characterized by a large majority of population between 25 and 59 years old (Annexes Figure I). These are the age bands with the highest work productivity. Therefore, an opportunity arises for creation of low-cost labour in order to boost economic development. In 2010, China and India were the most populous countries worldwide, with over than 1 B each (Annexes Table V).
Generally, emerging countries are very rich in natural resources. 90% of the world’s proven oil reserves are located in these nations. Other raw materials like copper, gold and platinum are abundant in Latin America.
Currently, emerging markets represent worldwide (Annexes Figure II): 85 percent of population;
78% of land mass;
76pp of foreign currency reserves; 58 percent of energy consumption; 50% of GDP by PPP
50pp of export; 32 percent of GDP;
12% of market capitalization.
Wealth in these markets is increasing, as the rise of better standards of living and consumerism: they have people who are willing to integrate the western lifestyle in their lives. Consequently, western MNCs are expanding their brands of goods and services to developing
8 countries and, yet, local competitors are rapidly increasing: they both have the willingness of satisfying the needs and wants of emerging market consumers (Fidelity, 2008/2009).
Innovative technology is essential for the progress of TFP and is conditional to quality of systems in governance, education, physical and organizational structures. Emerging nations should develop their know-how in order to attract foreign investment, which is still lower than their counterparts.
Gamble (2011) wrote that markets in South Korea (355%), Brazil (436%) and India (470%) are growing since 2001. However, Indonesia and Russia are the developing countries with the highest growth.
These progresses represent many new opportunities as well as new risks. Some of these risks are from volatile capital movements and from social, economic and environmental degradation, as a consequence of poverty. Openness to volatile capital flows must be managed cautiously to have effective control on risk-taking. These risks are inevitable because they are intrinsic to world economic and demographic development. Thus, it is very important to embrace outward-oriented policies to build a stronger framework for international coordination in trade, finance and migration (IMF, 2002 and Dadush and Shaw, 2011).
Developing countries are strategically important to world development. Therefore, they should exhibit favourable consumer demographics; increase of household incomes; rising availability of credit and expansive productivity resulting in more attractive prices (Czinkot et al., 2011).
III. Globalization in emerging countries
The accelerated integration over the last twenty years of emerging nations in global markets, emphasize the growing involvement of these countries in globalization (Milliot and Tournois, 2010). However, the progress made in these countries in order to achieve of development in advanced economies is different for each market, according to Dadush and Shaw (2011).
This new paradigm can be justified mainly by four structural changes: the rise of share in trade of manufactures; the expansion of middle class; the increase of FDI and integration in the global value-added chains and the leadership on elaboration of new trade policies (trade agreements at regional and bilateral level).
9 Therefore, developing nations represent a major role in international transactions and their participation in foreign agreements is imperative. IMF (2002) considers four indicators of globalization:
Trade
Trade is a crucial component of global economic activity. This indicator weighs in a country's GDP. Yet, the less is the weight in GDP, the lower vulnerability to external volatilities (OECD, 2009).
Dadush and Shaw (2011) states that importance of emerging countries as export market has risen since 1980 (from 19.5% in 1996 to 30% in 2006, in merchandise) due to an increase of population and incomes by having greater accessibility to international exchange which allowed them to acquire better quality and diversity of goods and services available in global market.
The nature of export profits is dissimilar between developed and developing countries: the first ones are based on manufactured goods, technology and services while the second ones rely on primary products and raw materials (Czinkota et al., 2011).
In 2011, China was the largest exporter of goods, with 10.7% (Annexes Table I). Also, trade to GDP ratio of China from 2009 to 2011 is 53.2pp, according to WTO statistics database 2012. This means that China is particularly dependent on trade (WEO database, 2012). Furthermore, from 1993 to 2013, China registered the highest improvement of GDP based on PPP share of world total, followed by India, in a selected group of developing markets, as shown in Annexes Figure III.
Dadush and Shaw (2011) quote that from 1996 to 2006, EU exports to China more than quadrupled. Russia and India exports also increased. On the other hand, export share of many developed nations fell – United States, Japan, and European Union (Annexes Figure IV).
Capital movements
Private capital flows in emerging markets has risen because of strong economic growth, an optimistic financial environment and a local policy progress. They are becoming important actors in global financial markets (Dadush and Shaw, 2011).
External capital movements to emerging nations increased strongly before the last global financial crisis (Annexes Figure V). Nevertheless, the rise of official reserves is the most
10 outstanding achievement of these countries, from 16 percent in 1990 to 57 percent in 2009 in global reserves (Annexes Figure VI). Reserves of almost all developing countries have risen relatively to exports and GDP due to the ability of these markets to live above their expectations. Private capital outflows of emerging economies has increased from $91 B in 2003 to $658 B in 2008. Was estimated that $61 T, 15pp of global GDP, contributed for total external assets of these countries in 2008 (Dadush and Shaw, 2011).
Foreign Indirect Investment (or Portfolio Investment)
One important FII is migrant remittances. Migrants usually send money to their home countries. In 2010, India, China and Mexico were the largest receivers. Each one of these countries earned more than $20 B. Their biggest source was from the United States, sending $48 B in 2009.
Foreign Direct Investment
For emerging markets, FDI is the largest source of external finance and it accounts around 30% of their GDP (Hamilton and Webster, 2012).
According to UNCTAD – WIR 2012, these economies accounted for almost 50% of global FDI and their inflows reached a new record: $684 B, in 2011. China and India increased their inflows by 8 and 31 percent, respectively. Turkey also registered a strong rise. Dadush and Shaw (2011) quote that these inflows raised from 2.2% in 2003 to 3.7%t in 2008 of their GDP. According to annexes Figure VII, the weight of emerging markets regarding global FDI inflows has risen over the past twenty years.
FDI Outflows in developing countries fell 4% (to $384 B), in 2011. For instance, China decreased their outflows by 5 percent from 2010, to $65 B. Yet, they reached the second highest level recorded, since 2000 (Annexes Figure VIII).
Emerging economies are important to MNEs as locations for foreign production. Plus, they select these countries as destination for their FDI in medium term, according to UNCTAD – WIR 2012. National policy progress and fast-growing economy in these nations contributes to the attraction of FDI and other flows due to the improvement of creditworthiness (Dadush and Shaw, 2011).
China is the most attractive economy for location of FDI by foreign multinationals because of cheaper labour and greater market potential (Annexes Figure IX).
11 Greenfield and Brownfield Investment
According to UNCTAD – WIR 2012, FDI Inflows in developing economies are increasing mainly by Greenfield investments.
Regarding Brownfield investments, cross-border mergers and acquisitions have a major role to MNCs. Companies from China, India and Russia are playing a prominent role as key purchasers. In 2009, almost one third of cross-border M&A took place in emerging economies (Hamilton and Webster, 2012).
Movement of people
Currently, 200 million of people reside outside their home countries. In industrial markets, migration is increasing relative to population (Annexes Figure X). Since 1960, immigrants have significantly increased their share in population in higher-income countries, achieving 10 percent in 2005. Some nations like Switzerland (22%), Singapore (43%), Kuwait (62%), United Arab Emirates (71%) and Qatar (78%) have higher shares of immigrants. Rich countries can get immigration restrictions due to rapid increase of population and income in emerging economies. However, the average life expectancy of population in industrial countries is increasing and, consequently, the need of skilled migration as well.
(Annexes Table VI) Generally, migration generates profits for migrants (higher earnings), home countries (more foreign exchange) and destination countries (increased supply of services and improved efficiency of production inputs). Recorded remittances of advanced countries rose from $31 B (0.8% of GDP) in 1990 to an estimation of $317 B (1.9% of GDP) in 2009. Yet, this result would be much higher because of unrecorded remittances. Opportunities for migration will be driven by:
Demographic trends – Generally, population from developed countries are getting old and birth rates are decreasing. This aging will demand more migrants in order to provide more services;
Advances in technology – The progress made in reduction of costs of transportation and communication is beneficial for migrants. Internet is an essential tool for access of information about migration opportunities;
Networks – Migrants from countries with a rich network of connections can help them to provide information about job opportunities, conditions and expenses;
12 Climate change – Many changes in nature (soil erosion, flooding, etc.) will force
people to move to other regions with a more productive land.
People move from one nation to another with motive of finding better employment, learning opportunities and for personal motives. Most of population from emerging nations (Asia, Latin America and Africa) leave their homes in order to find better life condition in higher-income nations mainly in North America and Europe. Moreover, people migrate for a variety of reasons:
Economic - To find work, to earn higher wages, to follow a career path; Social - To find a better quality of life, to be closer to family or friends; Political - To escape political persecution, war, violation of human rights; Environmental - To escape natural disasters.
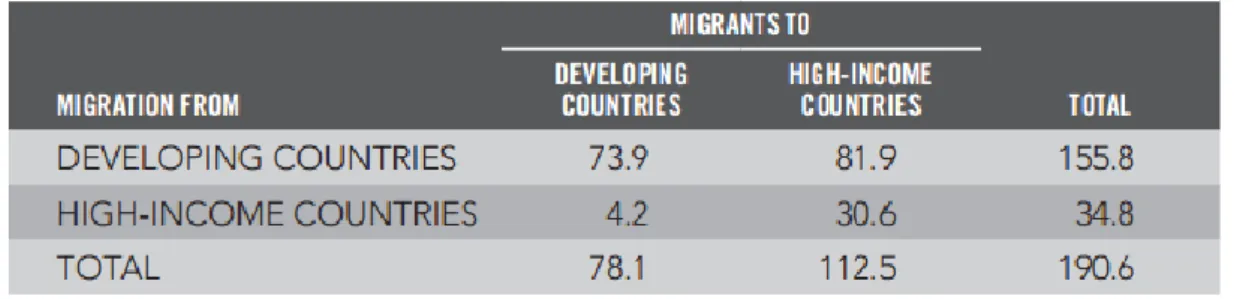
Movement of people also happens between developing economies: South-South migration. The rapid economic growth in these markets is one of reasons. This type of migration is increasing significantly, approaching number of migrants from developing to developed countries (Annexes Table VII). Besides, around 80% of South-South migration is with neighbour countries. But, this number can stabilize once the growth progress is similar between countries within a region (Dadush and Shaw, 2011).
Spread of knowledge (and technology)
Information exchange is an essential aspect of globalization. For instance, when FDI brings physical capital stock (computers, machinery, buildings) it also brings technical innovation as knowledge about production process, managerial system, export markets and economic policies available at low-cost. This represents a high valuable resource for developing economies.
India is a good example of a country that has benefited from advances in communications technology. As they provide cheap educated labour, reduction in costs and improvement in quality and reliability of telephony, India is becoming more important in call centre jobs. Consequently, there has been a movement of jobs from higher-income regions (UK and Unites States) to South-East Asia. Moreover, almost 50% of world’s top 500 companies are outsourcing IT and other business to India.
One of the most vital sources of economic development is capability to create new technologies and apply them to new products (Milliot and Tournois, 2010).
13 IV. Emerging countries: terminology
In 2001, Jim O’Neil - chief economist of Goldman Sachs - coined the acronym BRIC: Brazil, Russia, India and China. He predicts that these markets can surpass total GDP of G7 countries by 2027 (Foroohar, 2009) and accounting around 40 percent of global GDP by 2050 (Keohane, 2011).
According to Logue (2011), BRIC represent 42% of world’s population and 23% of world’s output of goods and services. They differentiate from other developing nations due to strong rise of population, which is relatively young, fast economic growth and large extension of territory (Annexes Table VIII). These countries have opportunity of becoming developed nations and to be true economic great powers.
In 2010, South Africa was officially added to BRIC acronym, standing now as BRICS, by Goldman Sachs (Hervieu, 2011). However, there are some critics who state that the join of South Africa to BRIC was not based on a purely economic criterion. García-Herrero (2011) estimates that South Africa will contribute less to world economic development than any of countries that constitutes the EAGLEs.
Beyond the BRICS, there are other known proposals (Martin, 2012; Wassener, 2010, Moore, 2012; García-Herrero, 2011): N-11 is a group of big eleven emerging markets identified by Goldman Sachs who have high potential of becoming the world's largest economies, along with BRICS. In 2011, Jim O’Neil created a new acronym called MIST/MIKT in which he considered as the four biggest markets in Goldman Sachs’s N-11 Equity Fund. Moreover, the EIU developed the acronym CIVETS in 2008. Publicized by HSBC Bank, these markets will be the future generation of developing nations. Finally, the BBVA Research identified a group of key emerging economies in 2010, called EAGLEs, which are expected to lead world economic growth in the next 10 years.
List of emerging countries by group of analysts
There are several lists of developing economies made by various important entities (Annexes Table IX). Turkey is the only country who shows up in every list. Yet, there are several nations which appear only in one list such as Bangladesh, Bulgaria, Hong Kong, Iran, Israel, Latvia, Lithuania, Nigeria, Romania, Saudi Arabia, Singapore, Slovenia, United Arab Emirates and Ukraine. On the other hand, the Economist is the analyst with highest number of emerging markets in their list (27), followed by the IMF (23) and EIU (22).
14 V. BBVA Research
BBVA is a multinational Spanish banking group, formed in 1999 by the merger of BBV and Argentaria. It was recognized by top financial publications as the world’s best bank by Forbes, the best bank in Spain, both in 2000. In 2001, was also renowned as the best bank in Latin America by Forbes and the best European bank by Lafferty. Also, they have a strong international presence in Europe, in Asia-Pacific, in North, Central and South America.
In 2010, BBVA Research department created a study about emerging markets called Emerging and Growth-Leading Economies (Annexes Figure XI), “whose contribution to World
economic growth in the next ten years is expected to be larger than the average of the leading industrialized nations, namely the G6 countries”.
The Nest “is a watch list of countries with expected incremental GDP in the next 10 years
to be lower than the G6 average but higher than the smallest contributor of that group”. These
countries can be future EAGLE based on their improvement of performance above current forecasts.
BBVA Research is composed by a group of 200 economists and strategists scattered in Western hemisphere, Europe and Asia and they consider a group of emerging markets and industrialized economies in their analysis, as shown in Annexes Table X.
In 2011 EAGLEs annual report, they identified 10 markets as EAGLE: China, India, Brazil, Indonesia, South Korea, Russia, Mexico, Egypt, Taiwan and Turkey, whose contribution to the World’s economic growth is expected to be around 51% from 2010 to 2020. On the other hand, the Nest countries were in Thailand, Nigeria, Poland, Colombia, South Africa, Malaysia, Vietnam, Pakistan, Bangladesh, Argentina, Peru and Philippines: 12 members who were expected to deliver 8 percent for world’s incremental GDP in same time period.
Regarding 2012 EAGLEs annual report, all economies maintained their EAGLE status, except Egypt which is now in Nest (Annexes Figure XII). This new group is expected to contribute around 58% to global economy development in 2011-2012 period. In Nest countries, there are new 3 members: Egypt, Chile and Ukraine and they all shall contribute 10 percent in following ten years for global economy growth.
According to Annexes Table XI, the top 7 of emerging countries with the highest number of presences in a list made by different group of analysts, are also included in BBVA’s list. The exceptions are Taiwan and South Korea with 7 and 6 presences, respectively. When comparing EAGLEs concept with other proposals (BRIC, N-11 and CIVETS), his methodology is different
15 from others in several ways (García-Herrero, Navia and Nigrinis, 2010; García-Herrero, 2011; García-Herrero and Schwartz, 2011):
Dynamic concept: is not a fixed group and is not linked to an acronym, like BRICS, allowing the entrance or exit of countries with better or worse performance over time. This approach is used to select the key leading economies in developing markets. The number of countries is variable in the sense that entering one country does not mean the exit of another one;
Yearly revision: their research is revised once a year, according to latest forecasts (performance and changes in economic conditions) relative to higher-income countries, exploring the potential growth paths with greater accuracy;
Objective measure: IGDP vs. absolute size, giving less importance to economic size and population, separately. Thus, the combination of both is what is really important: population is constant and almost impossible to anticipate trends in long term and economic size is partly generated by incremental demand;
The Nest: number of nations in EAGLEs is changeable due to their growth prospects over time. So, it is important to have a watch list of EM, which may become an EAGLE in the future. These economies are contributing considerably to economic growth worldwide. Still, is not sufficient to enter the EAGLEs list;
Cut-off point: is explicit. Each emerging market can be considered relevant enough in terms of its contribution to global growth and, consequently, becoming an EAGLE. The only requisite is that IGDP in the next 10 years has to be greater than expected average of G6 economies;
“Falling Angel”: a country that drop out the EAGLEs status due to a large downward revision on growth projections in a 10 years period. The chances of this happening are higher when the country is small and closer to the cut-off point;
Short horizon: forecasts are based in a 10 years period, while most other analysis is considered a range from 20 to 50 years. They are able to make accurate trends in long term and not falling in error of making predictions almost impossible to reach in a larger horizon of years, as global economy may suffer huge variations in a long period of time;
EAGLEs outlook: BBVA provides quarterly economic reports and a yearly report where is made a new updated evaluation, taking into account any economic developments that might impact developing economies, within a period of 10 years.
16 The main objective of this annual report is to review status of EAGLEs and the entrance of new countries in the list;
Investors: the methodology created by BBVA Research is essential to investors as they search for guidance in their reports with constant updates and based on real facts. This is a relevant concept due to identification of business and market opportunities with more anticipation;
Focus: BRIC (absolute size), Next-11 (population and GDP size) and CIVETS (young population) have ambiguous focus which may be misleading in determining market potential. On the other hand, EAGLEs focuses in on incremental GDP and, consequently, in their contribution for world economic growth (Annexes Table XII);
Methodology: based on demographic trends (taking into account structural changes in workforce: productivity and participation rates) and capital accumulations (projections of investment rates).
In conclusion, the EAGLEs concept is objective with rigorous and transparent criteria.
VI. EAGLEs
Introduction
BBVA annual report of 2012 states that EAGLEs and Nest contribution to world economic development rises from 59 (2011 estimation) to 68 percent, in 2011-2021 period. Furthermore, G7 countries are expected to contribute around 16% (increased 2pp from last year estimation). In 2011, 10 countries were EAGLEs (BBVA annual report). Nevertheless, 9 countries maintain their status: China, India, Brazil, Indonesia, Korea, Russia, Turkey, Mexico and Taiwan. Egypt is the first “fallen angel” due to a downward revision, in short horizon, to his growth perspective. Until recently, no country in Nest has upgraded their level to EAGLEs membership. With update of forecasts, number of countries in Nest increased from last year to 15 members: Chile, Egypt, Ukraine (the new ones), Argentina, Bangladesh, Colombia, Malaysia, Nigeria, Pakistan, Peru, Philippines, Poland, South Africa, Thailand and Vietnam.
The EAGLEs assessment of vulnerabilities has six types of risks: growth model, external demand, macro disequilibria, institutional factors, social unrest and inclusive growth challenge. These risks are generally limited when comparing with developed markets and their degree of vulnerability is different in every EAGLE member.
17 Regarding growth model risks, productivity can be improved in China, India, Indonesia and Mexico. On the other hand, workforce will decline in Russia and will rise relatively in China and Taiwan.
In external demand risks, Brazil, Indonesia and Russia heavily rely on merchandise trade. However, Brazil, South Korea and Taiwan are very dependent on China whereas Russia, Turkey and Mexico have low growth in higher-income countries.
Concerning macroeconomic disequilibria risks, India and Brazil show fiscal fragility, external deficit and high public debt. Turkey presents a large current account imbalance.
Finally, in institutional factors, social unrest and inclusive growth challenge risks, China, India, Indonesia and Russia are facing institutional and social challenges, while Brazil and Mexico have opportunity to improve their social inclusion and, therefore, to increase their potential to grow. Moreover, due to high income per capita, South Korea and Taiwan presents a propitious situation in this regards.
Economic outlook
In 2011, developing countries continue to demonstrate an outstanding performance for global economic development despite of all difficulties, as crisis that reaches Europe about sovereign debt, lack of liquidity, decline of demand from industrial markets and the rise of global risk aversion.
China is the economy with the highest contribution to worldwide growth. As shown in Annexes Table XIII, EAGLEs members contributed with 7.1 percent, in 2011. Their performance was better than all 45 EM (6.3%), even excluding China (5%) and BRIC nations (4.8%). BRICs show the highest share of contribution (7.6%) but, without China, result is lower (-2.1pp).
EM and IE are following distinct patterns: first group will continue to thrive globally, while second group will maintain or even reduce their progress in world economic growth, where Italy was revised downwards in G6/G7 countries.
The current economic size of 45 EM without BRICs represents around 52 percent vs. G6 countries (Annexes Figure XIII). Still, in the next 10 years, their share will be 59pp and IGDP of these economies will be 79% against 21% of G6. When comparing EAGLEs plus Nest vs. G7, actual GDP of these two groups is higher than G7 (Annexes Figure XIV). Moreover, in 2011-2021 period, EAGLEs will generate an IGDP of 69 percent (Nest = 12% and G7 = 19%).
18 There has been a positive evolution since the 80’s regarding increase of GDP in 45 EM: from 3 percent to around 6% in the next ten years, contrasting the decline in G7 (from almost 3 in 1980s to 2pp in 2011-2021). Regarding share of global GDP by PPP, 2012 is critical once the 45 EM surpasses the supremacy of IE, reaching an upward tendency (Annexes Figure XV and XVI).
China will be the global leader in the next decade, with the highest incremental GDP (+ $13 B) out of the three: China (1st), US (2nd) and India (3rd). Also, China (34%) will be the greatest contributor for world economic growth, where India (11.9%) will be second and United States (9.6%) third, highlighting that rest of the world will have a major important share of contribution, with 44.5 percent (Annexes Figure XVII and XVIIII).
There are three countries that registered an improvement from the previous BBVA yearly report: India, Russia and Turkey. India made more investment and productivity gains, which is expected to boost economic growth to 8 percent and to have higher IGDP than United States. Russia increased trade and production of commodities. Yet, its institutional structure and high social unrest are threatening Russia’s growth. Finally, Turkey had a faster capital accumulation process and higher productivity.
In the next decade, Brazil and Indonesia will be highest contributors for world economic growth than Japan. Also, South Korea will have the same performance as Japan. From 7 EAGLEs members, excluding China and India, all of them, except Taiwan, could surpass Germany. Finally, Taiwan will equal United Kingdom and will exceed Canada, France and Italy (Annexes Figure XIX to XXII).
According to annexes Table XIV and XV, EAGLEs will have the highest improvement of GDP from 2011 to 2021, with an average annual growth of 6.6%, followed by Nest (4.9 percent) and G7 (1.9 percent). In 2021, EAGLES and Nest will be responsible for 52% of global GDP, while G7 with 31%. When comparing the ranking 2011 vs. ranking 2010 of countries contribution to world economic growth in the next decade, Turkey is the country with the biggest improvement within EAGLEs (from 14 to 9 position).
Asia will be the region with the major contribution for global economic development, with 59.7 percent. With the supremacy of Asia, big changes will happen in allocation of great powers worldwide. In the next 10 years, Latin America (7.8%) will overtake Western Europe (5.8%) by 2pp in terms of IGDP but it won’t surpass North America (10.5 %). Eastern Europe (6.0%) will be greater than Western Europe by 0.2 percent and Australia + New Zealand will contribute with 1pp Finally, Africa and Middle East will share similar contribution, with 4.1% and 5%, respectively (Annexes Figure XXIII).
19 Relatively to membership sensitivity between EAGLEs and Nest, Taiwan is the EAGLE that is more close to the cut-off point. This means that a downward revision in the annual average growth for the next decade of 0.1%, Taiwan would be no longer an EAGLE member. Plus, Taiwan, Mexico (-0.5%) and Turkey (-0.9%) are the countries with greater risk of leaving EAGLEs. Thailand (+ 0.3pp), Egypt (+0.4pp) and Argentina (+0.6pp) are the Nest countries with high probability of becoming an EAGLE, if they are able to accelerate annual growth to an EAGLE scenario.
EAGLEs Macroeconomic risks (Annexes Table XVIII)
In general, EAGLEs exhibit an on average performance (above average, on average and below average of the average for 45 EM) in three dimensions: growth model risks, external demand risks and macro disequilibria.
Out a total of 14 variables, South Korea is the economy with more above average in 7 different indicators, followed by Taiwan with 6 and Brazil with 5, while Mexico and Turkey have only one variable above average. Also, Turkey presents on average in 8 indicators and Mexico has below average in 7 variables. In conclusion, South Korea is the EAGLE with the best relative evaluation, followed by Turkey and China. On the other hand, Indonesia, India and Brazil present the worst relative assessment.
R&D expenditure is the variable with more above average from EAGLEs with 5, whereas that external debt has zero above average. Moreover, expected fiscal balance presents 7 countries with on average performance, while commodity exports dependency has only one. Finally, trade openness shows 6 EAGLEs with below average expectation. On the other hand, China exports dependency and expected fiscal balance have only one below average each.
China has the strongest expected labour force productivity growth (8.3pp next 10 years) of all EAGLEs. Also, R&D expenditure (1.4% of GDP) and expected external balance (6.5 percent next 5 years) are both in above average. China has low external debt (9.3pp of GDP), very low commodity exports dependency (6.3% of total exports) and relatively low trade openness (50.6 percent of GDP). However, there are some potential concerns regarding low expected labour force growth (1.9pp next 10 years), who is the second weakest of all EAGLEs, and low tertiary education enrolment (24.3 percent).
India and Brazil present the worst assessment in macro disequilibria, where both have the highest public debt in EAGLEs: 64.1% and 66.8% of GDP, respectively, way more than the 45 EM average. Yet, both countries show a low external debt: 17.8 percent of GDP for India and
20 16.6 percent of GDP for Brazil. India has the worst expected fiscal balance deficit (-7.1pp next 5 years) and Brazil the second worst expected external balance (-3.0% next 5 years). On the other hand, Brazil growth acceleration from 2002-07 to 2011-21 period is expected to be flat, which is above the 45 EM average. India expected labour force growth (16.9pp) and expected labour force productivity growth (6.1%) in the next decade are one of the highest of all EAGLEs, while Brazil is below average (3.0 percent) in the last indicator mentioned before. They both have low quality of overall infrastructure (average of 3.7 of a total score of 7). In terms of R&D expenditure, Brazil is above average (1.1pp of GDP) and India is below average in tertiary education enrolment (16.2 percent). Furthermore, both countries have the lowest trade openness of EAGLEs, which means that they have less exposure to global demand variations (18.8% of GDP for Brazil and 33.5% of GDP for India). Lastly, Brazil has high dependency in China exports (15.6pp of total exports) and in commodity exports (61.9 percent of total exports).
Indonesia is the only EAGLE with a positive growth acceleration (0.9% between 2011-21 and 2002-07) and one of the three above average in expected labour force productivity growth (5.3 pp next 10 years). Nevertheless, the main concern is in TFP indicators: quality of overall infrastructure (3.7 score), R&D expenditure (0.0% of GDP) and tertiary education enrolment (22.4 percent) which are very low. Indonesia is also characterized by low trade openness (41.0pp of GDP), high expected trade partners’ growth (4.5 percent next 10 years) and high commodity exports dependency (62.2% of total exports). In macro disequilibria, Indonesia exhibits a low public debt (27.4% of GDP) when comparing with the 45 EM average.
Despite the slight decrease of 0.9% in growth acceleration, South Korea exhibits an above average performance. Also, South Korea has the highest improvement of all EAGLEs in TFP variables: quality of overall infrastructure (score of 6 out of 7), R&D infrastructure (3.2% of GDP) and tertiary education enrolment (103.9pp). The country shows an above average in expected trade partners’ growth (4.7 next 10 years) and in China exports dependency (25.1 percent of total exports). South Korea is the only economy with above average in expected fiscal balance (2.7 pp next 5 years), while in commodity exports dependency shows a below average performance (11.1 percent of total exports).
Russia faces big challenges: it is the EAGLE who is positioned in last in growth acceleration (-5.2 pp) and the only one who is expected to suffer a decrease in labour force growth (-7.7 percent next 10 years). Russia is also characterized by below average in quality of overall infrastructure (3.6 score), contrasting the above average in R&D expenditure (1.0% of GDP) and tertiary education enrolment, which is the second highest among EAGLEs (75.9%).