THE PARADOX OF AGEING
1Authors: Carlos Manuel Pereira da Silva*
Full Professor, ISEG-Technical University of Lisbon Pedro Corte Real
Assistant Professor, Universidade Nova, Lisbon Jorge Miguel Bravo
Assistant Professor, University of Évora – Depart. of Economics Sara Sofia Vaz-Paralta
Master in Monetary and Financial Economics
* Author for all correspondence: CIEF, ISEG-Technical University of Lisbon, Rua Miguel Lupi, 20, Gab.
201, 1249 - 078 Lisboa – Portugal, Tel.:+351 213906850, Fax: +351 213967971, E-mail: [email protected]
ABSTRACT
In this paper, we discuss the so-called paradox of ageing, with respect to the members of the age group 55-64 years of age. This generation is (currently) too young to retire, despite the length of their working lives – for some in excess of forty years – and high earnings, yet is too old to continue working, since employers prefer to hire younger, more flexible and less expensive workers. Furthermore, official statistics show that the longevity of this generation is higher than its predecessors, an evolution that would apparently call for a gradual increase in the retirement age. The argument put forward by its advocates is that by keeping people at work for some more years, additional contributions will be received while delaying pension expenditure, thus compensating for the longer longevity prospects. We argue that, from the point of view of the long-term financial sustainability of the Social Security system, it would be preferable to provide this generation with an option to anticipate the retirement age, while penalising their retirement pension until they reach the age of 65. Such an option would serve as an alternative to a scenario of long-term unemployment in which individuals are granted unemployment benefits, normally exceeding the amount of the “anticipated pension“, at the same time as they continue to accumulate pension rights with no contributions to the system. Faced with a situation in which rationing exists in the supply of individual life annuities by the insurance market, we discuss the creation of a financial reserve fund to support life-expectancy increases for all generations, funded by a supplementary contribution, which would be used to pay for the pensions in excess of those resulting from a constant lifespan at the age of retirement for all of the generations.
Since the “ageing equation” has no single solution, our aim is to broaden the current debate on the long-term financial sustainability of the Social Security systems towards a richer perspective, in which raising the age of retirement is not the only solution.
Keywords: ageing, longevity, Social Security, pension
1.INTRODUCTION
In the course of the next 20 years, the approximately 2.4 million Portuguese who currently constitute the age group 45 to 64 years will reach the age of retirement. They are known as the “greying panthers” generation (Björkman et al., 2001) because they enjoy long-term employment, they have received more and better education than their parents, they are much better off in terms of financial resources and real estate ownership and on retirement, they will have far greater life expectancy than the generations that preceded them.
The paradox of ageing, with respect to the greying panthers, is that members of this generation are too young to retire, despite the length of their working lives – in excess of forty years – and high earnings, yet they are too old to continue working, since employers prefer to hire younger, more flexible and less expensive workers.
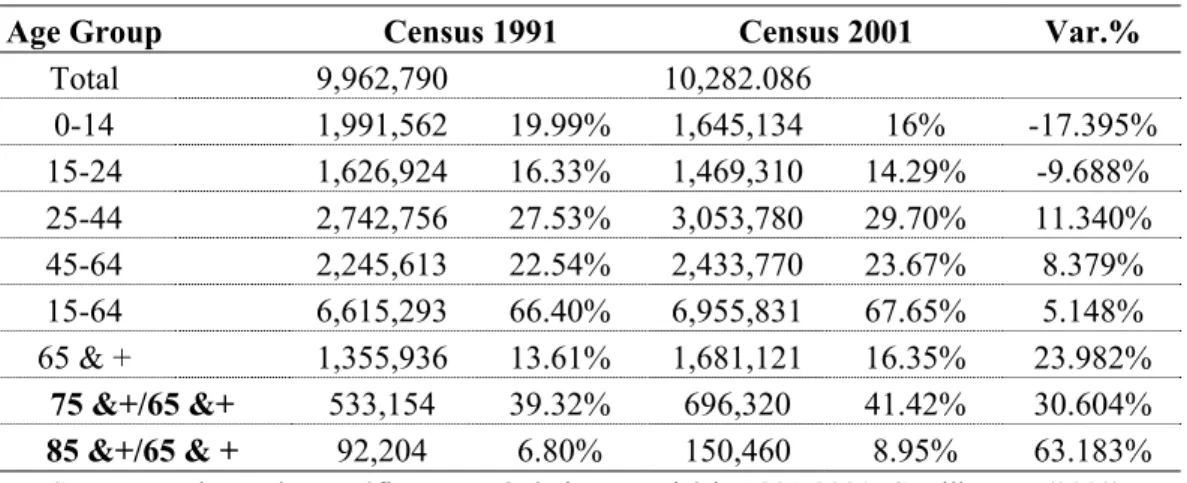
Table 1 - Population Distribution by Age Groups
Age Group Census 1991 Census 2001 Var.%
Total 9,962,790 10,282.086
0-14 1,991,562 19.99% 1,645,134 16% -17.395%
15-24 1,626,924 16.33% 1,469,310 14.29% -9.688%
25-44 2,742,756 27.53% 3,053,780 29.70% 11.340%
45-64 2,245,613 22.54% 2,433,770 23.67% 8.379%
15-64 6,615,293 66.40% 6,955,831 67.65% 5.148%
65 & + 1,355,936 13.61% 1,681,121 16.35% 23.982%
75 &+/65 &+ 533,154 39.32% 696,320 41.42% 30.604%
85 &+/65 & + 92,204 6.80% 150,460 8.95% 63.183%
Source: Evolução demográfica no período intercensitário 1991-2001. Carrilho, M. (2002)
The age group in question, which represents 23.67% of the population, will be substituted when it retires by the 25-44 years age group, which at present accounts for 29.70% of the working population. The increase of 6.03% would appear to be a positive development. However, a problem arises when the next age group, 15-24 years, moves up the age scale since this group shows a decrease of 9.688% in the 10-year period. At the same time, we observe the upward trend of the age group 75 years and over.
Portuguese Social Security system was set up in the 1980s (Law 28/84, 14th August) on a pay-as-you-go basis and has remained as such to the present time. Eurostat data for the period 1980-2001 reveals that Portuguese male life expectancy at the age of 60 increased from 16.3 years to 18.2 years (+11.7%), while for women it increased from 20.6 years to 22.2 years (+7.8%) during this period. The significance of this evolution is that on average, every pensioner who retires today will be entitled to the equivalent of almost two additional pension payments per year compared to previous generations.
This massive intake of new pensioners is bound to place great strains on the public social services, particularly in the areas of health care and social security. The scarcity of financial resources, social infrastructures and medical support raises two urgent issues: the necessity to find alternative means of covering social risks, including dependency; moreover, the obvious necessity to implement an investment strategy to build up the savings required in order to meet the future needs in the areas mentioned above.
The question of demographic dependency assumes particular relevance when we consider that the natural replacement of the generations is being undermined by the low levels of fertility.
Table 2 -Dependency Ratios – the Young (0-19 over 20-59)
1960 1970 1980 1990 2000 2001 2020 Growth Growth
60-2001 60-2020
EU-15 60.2 63.8 57.7 46.6 41.4 41.7 38.1 -30.73% -36.71%
Italy 59.9 60.9 58.2 44.5 35.2 35 34.03 -41.57% -43.19%
France 63.2 67.9 58.3 52.2 47.5 47.1 44.9 -25.47% -28.96%
Spain 67.7 70.9 68.4 54.8 37.7 36.4 36.1 -46.23% -46.68%
UK 57 61.8 58.1 48.5 46.5 46.1 40.4 -19.12% -29.12%
Portugal 73.7 76.6 70 56.1 41.5 40.8 41.9 -44.64% -43.15%
Source: Eurostat
Table 3 -Dependency Ratios - the Elderly (60 & + over 20-59)
1960 1970 1980 1990 2000 2001 2020 Growth Growth
60-2001 60-2020
EU-15 29.4 34.8 34.2 36.3 39.2 38.9 51.2 32.31% 74.15%
Italy 24.9 30.5 32 37.1 42.5 43.3 58.1 73.90% 133.33%
France 32.8 36.9 32.5 35.8 38.3 38.2 50.6 16.46% 54.27%
Spain 23.6 27.7 29.7 35.7 38.1 37.6 48.9 59.32% 107.20%
UK 32 37.5 39.1 38.9 37.6 37.5 46.7 17.19% 45.94%
It can be observed in the second of the tables above that the proportion of Portuguese aged 60 and over increased by almost 76.5% between 1960 and 2001. Furthermore, it is estimated that by 2020, this age group will represent almost 45% of the Portuguese population, which nevertheless is a less negative scenario that what is forecast for the average of the EU-15. Within this disequilibrium, two factors are determinant: the fertility rate and life expectancy. However, the question can be posed as to whether there are any prospects for a measure of relief from the fertility rate. Let us consider the following table:
Table 4 - Fertility Rate
1960 1970 1980 1990 2000 2001 2020 Growth
60-2020
EU-15 2.59 2.38 1.82 1.57 1.48 1.47 -1.12
Italy 2.41 2.42 1.64 1.33 1.24 1.24 1.41 -1.17
France 2.73 2.47 1.95 1.78 1.88 1.9 1.8 -0,83
Spain 2.86 2.9 2.2 1.36 1.23 1.25 1.7 -1.61
UK 2.72 2.43 1.9 1.83 1.64 1.63 1.74 -1.09
Portugal 3.1 2.83 2.18 1.57 1.52 1.42 1.69 -1.68
Source: Eurostat
As can be observed, the rate of 1.42 in 2001 is not sufficient to replace the population and neither will it suffice in 2020, in spite of the projected recovery.
To a certain extent, the decreasing numbers of workers can be compensated by the entry of newly-arriving immigrants into the labour force. This is already taking place in Portugal, as elsewhere across the European Union.
2.THE CONSEQUENCES OF AGEING FOR SOCIETY
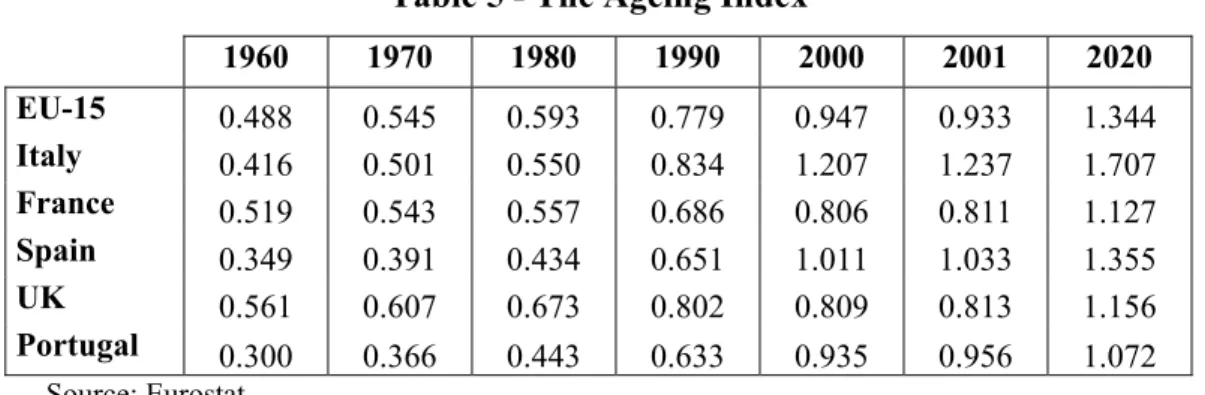
In addition, the ageing index, measured by the relation between the dependency ratio of the elderly and the same ratio in respect of the young, is going to rise substantially, although at a lower ate than the EU-15 average, as can be observed in the following table:
Table 5 - The Ageing Index
1960 1970 1980 1990 2000 2001 2020
EU-15 0.488 0.545 0.593 0.779 0.947 0.933 1.344 Italy 0.416 0.501 0.550 0.834 1.207 1.237 1.707 France 0.519 0.543 0.557 0.686 0.806 0.811 1.127 Spain 0.349 0.391 0.434 0.651 1.011 1.033 1.355
UK 0.561 0.607 0.673 0.802 0.809 0.813 1.156
Portugal 0.300 0.366 0.443 0.633 0.935 0.956 1.072
Source: Eurostat
The problem may be alleviated in the short and medium term by means of immigration, which is already taking place, evident in the fact that almost 8% of the current Portuguese work force is of overseas origin. However, this is not a viable solution for the long term, owing to several explanatory reasons:
Portuguese society lacks the conditions necessary to absorb and integrate the
number of immigrants that would be sufficient to make up for the indigenous short-fall;
It must be taken into account that the immigrant population equally grows older
and acquires social security entitlements;
Long-term unemployment of the middle-aged is substantially – although not
exclusively – linked to the evolution away from labour-intensive employment in favour of technology.
remaining years of life, so as to ensure optimal retirement consumption (and cover bequest motives, if any). Or, on the contrary, faced with the prospect of outliving their expected lifespans, will they plan their savings strategy in order to offset future reductions of their State retirement pensions resulting from the age-wave phenomenon, which can be compensated by private saving on an individual or collective basis?
In a scenario of unknown longevity, retirees can reduce the risk of exhausting assets before passing away by consuming less per year, but such a tactic then increases the chance that they might die with too much wealth left unconsumed. In other words, dying with too little wealth is undesirable, but having too much wealth is also undesirable, since it represents foregone consumption opportunities.
3.WHAT IS TO BE DONE?
In the light of the demographic scenario described above, together with its implications for the financial sustainability of the Social Security system, it is of vital importance to examine some alternative solutions which, while contributing to the objective of balancing the public finances, do not place at risk the income of the future pensioners. Among the various possible options, we shall only consider here the raising of the age of retirement, working beyond the age of retirement and the creation of a Reserve Fund dedicated to meeting the costs associated with life-expectancy increases and developing annuity markets.
3.1.RAISING THE AGE OF RETIREMENT
The argument put forward by its advocates, including under-informed government ministers, is that by keeping people at work for some more years, contributions received by the State Social Security system will increase, while pension expenditure will be delayed. Unfortunately, this idea is too simplistic and would only be superficially effective, since the central issue is unemployment, above all among the 45-64 years age group. Evidence of this can be observed in the tables below.
Table 6 - The Unemployed Population by Age Band - Annual Figures
Age Group 1999 % 2000 % 2001 % 2002 % 2003 % 2004 % 15 – 24 61.6 27.3 58.,1 28.3 63.6 29.8 77.6 28.7 89.4 26.1 89.2 24.4
25 – 34 64.5 28.6 55.5 27.0 56.6 26.5 79.9 29.5 109.4 32.0 106.6 29.2
35 – 44 46.8 20.7 40.8 19.9 42.0 19.7 53.3 19.7 69.2 20.2 75.9 20.8
45 – 54 35.9 15.9 32.0 15.6 31.3 14.7 36.6 13.5 42.3 12.4 57.2 15.7
55 – 64 17.0 7.5 19.0 9.3 20.0 9.4 23.0 8.5 32.0 9.3 36.0 9.9
Total 225.8 100 205.4 100 213.5 100 270.4 100 342.3 100 364.9 100
Source: Eurostat, INE; Unit: 103
The unemployment rate in relation to each respective age-group demonstrates that the oldest groups in the scale have experienced the greatest increase in unemployment. It thus follows that the unemployed in the oldest age-groups are the least likely to find new employment.
Table 7 - Unemployment Rate by Age Band
Age Group 1999 2000 2001 2002 2003 15 - 24 8.743% 8.527% 9.363% 11.617% 14.461%
25 - 34 4.828% 4.087% 4.099% 5.646% 7.550%
35 - 44 3.739% 3.187% 3.219% 4.036% 5.113%
45 - 54 3.572% 3.092% 2.936% 3.392% 3.840%
55 - 64 2.991% 3.278% 3.462% 3.838% 5.240%
The proportion of pensioners retiring directly from unemployment, as a percentage of the total of pensioners in early retirement, was higher than 40% in the period 2002-2004, although the trend in fact was downward.
Table 8 - Early-Retired Pensioners
2002 2003 2004
1. Total Pensioners in Early Retirement 62,457 71,121 84,608
2. Pensioners Requesting Early Retirement
With Unemployed Status 27,378 29,821 35,821
(2) / (1) 44% 42% 42%
Note: (2) / (1) - Percentage of pensioners in unemployment over the total of pensioners in early retirement. Source: Social Security statistics
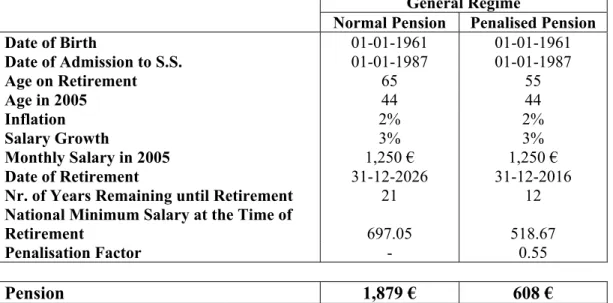
In the case of an individual taking retirement at 55 years of age after 30 years of contributing to the general Social Security system, the pension entitlement will correspond to no more than 35% of the last salary. However, should the same individual remain in the labour market until the age of 65, the pension entitlement will rise to 81%.
Table 9 - Illustration of the Loss Incurred on a Pension Claimed at Age 55 General Regime
Normal Pension Penalised Pension Date of Birth 01-01-1961 01-01-1961
Date of Admission to S.S. 01-01-1987 01-01-1987
Age on Retirement 65 55
Age in 2005 44 44
Inflation 2% 2%
Salary Growth 3% 3%
Monthly Salary in 2005 1,250 € 1,250 €
Date of Retirement 31-12-2026 31-12-2016
Nr. of Years Remaining until Retirement 21 12
National Minimum Salary at the Time of
Retirement 697.05 518.67
Penalisation Factor - 0.55
Pension 1,879 € 608 €
The amount of loss to the pension in the example above is 67.6%, which is, by any account, remarkable.
Table 10 - Illustration of the Loss Incurred by the State with Unemployment Benefit at Age 55
Unemployment Benefit
Salary at Age 55 1,730
Monthly Unemployment Benefit 1,038
Total 3 years Unemployment Benefit 37,374
Early Retirement
Last Salary at Age 55 1,730
Monthly Pension 608
Total 3 years Pension Payments 25,550
Differential to be Supported by the State 11,824
From the above illustrations, we can conclude that the elimination of the option of early retirement at age 55 after 30 years of employment is a badly conceived measure, since it will have effects contrary to those intended. While it brings no positive effects to the public finances, the consequences for the renewal of the labour force equally may well prove to be negative, since jobs may continue to be held by workers until they are well into their old age. This, in turn, will bring negative effects on the productivity of enterprises, in addition to the obvious increase of the cost of unemployment among the age groups closest to retirement.
If the problem was only perceived as concerning income, and if it was believed that enterprises were benefiting from a mechanism of corporate restructuring, resulting in savings for them and costs for the State, then it would have been preferable to maintain the payment of contributions destined for old-age pensions in the period between the age of early retirement and the legal retirement age.
3.2.WORKING BEYOND THE AGE OF RETIREMENT
respective social contribution into the Social Security system in Exchange for a revision of the value of the pension when the employee eventually retires.
Table 11 - Population in Work Beyond the Retirement Age
Age Group 1999 % 2000 % 2001 % 2002 % 2003 % 55 - 64 568.4 11.05 579.6 11.08 577.7 10.85 599.2 11.08 610.7 11.18
≥ 65 277.4 5.39 297.9 5.69 316.7 5.95 326.1 6.03 327.2 5.99
Total 845.8 16.45 877.5 16.77 894.4 16.80 925.3 17.11 937.9 17.18
Unit: thousands; Source: Eurostat
As can be observed above, the proportion of individuals who remain in the labour market between the ages of 55 and 64 as a percentage of the total working population increased from 16.45% in 1999 to 17.18% in 2003. According to the European Commission study: “The Social Situation in the European Union in 2003: A Summary”, in 2001 the employment rate in Portugal among individuals in the age band 55 to 64 years was 50.3%, a considerably higher figure than the EU-15 average, which was 38.6%.
It is worth pointing out that in addition, the above-mentioned study found that the average age at which retirement was taken in Portugal in 2001 was 62 years, whereas the EU-15 average age was 59.9 years. This data raises the suggestion that with regard to the issue of working beyond the age of retirement, Portugal is already an exemplary case.
3.3.AFINANCIAL RESERVE FUND TO SUPPORT THE LIFE EXPECTANCY INCREASES
individual life annuities that are available in the insurance market, the consequence of which is that the only way to provide them is by means of obligatory mutualisation in collective funds.
However, the question is: which life expectancy is to be taken into consideration – that expressed at the inception of the system, or that of the most recent generation to have retired? We believe that it would be fair to take into account the life expectancy of the first generation to have completed a full working lifetime, that is to say, the youngest generation at the time of the system’s creation, whom, in relation to a career of forty years’ duration, is currently halfway through its full cycle of occupational activity. One question arises from the above point: What is the cost of this increase and how is it to be amortised?
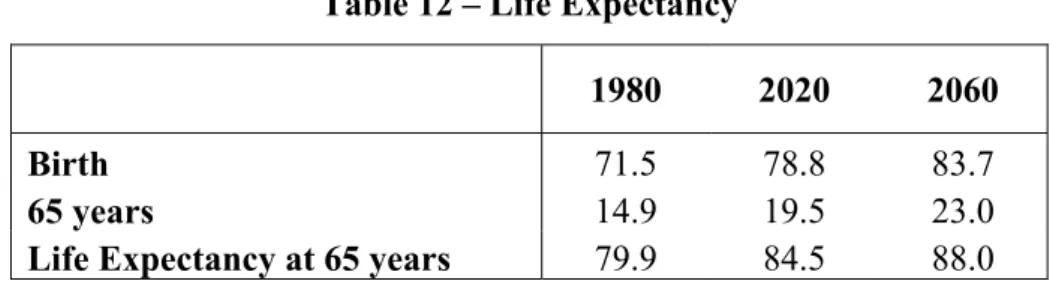
In order to be able to respond to the above question, we must accept that certain forecasts, namely, those that appear in the next table are likely to be accurate.
Table 12 – Life Expectancy
1980 2020 2060
Birth 71.5 78.8 83.7
65 years 14.9 19.5 23.0
Life Expectancy at 65 years 79.9 84.5 88.0
The figures given in the column for 1980 appeared in data published by the INE, the Portuguese National Statistics Institute. The projections in relation to 2020 and 2060 were obtained from data published in “World Population Prospects: The 2002 Revision” by the Population Division of the United Nations Economics and Social Affairs in February 2003. According to this U.N. body, the projected life expectancy at birth for Portugal during the period 2020-2025 (combined for both sexes) will be 78.8 years. Furthermore, it is projected to reach 81 years in the period 2045-2050 (the latter projections do not appear in the table).
Universidade Nova de Lisboa, based on data from the INE, which was extrapolated for 1994. The passage of time reveals that this table was a substantially accurate “snapshot” of the Portuguese population’s life trajectory. Thus, given the absence of any more up-to-date instrument at our disposal, and based on the consideration that the trajectory will not alter significantly over the next 50 years, we calibrated the above-mentioned table in order to corroborate the figures projected in the United Nations study for the periods indicated.
With regard to the most distant year projected, 2060, we took into account that the U.N. study proposes life expectancies in the interval [88.1; 83.7] for the 10 countries with the longest life expectancy at birth between 2045 and 2050. Therefore, let us suppose that Portugal would use the chronological distance of 10 years corresponding to the period 2050-2060, which would place the country below the threshold of the group with the longest life expectancy.
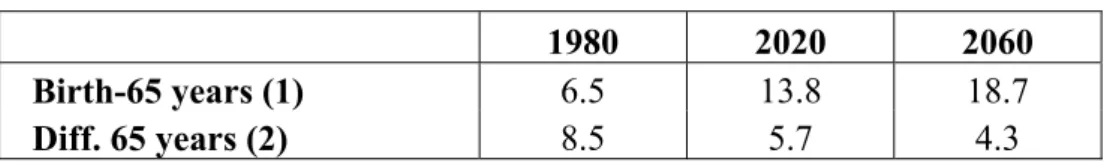
Thus, accepting these assumptions as reasonable, on observing the table above, it is quite possible to draw the following inferences for a person reaching the age of 65 years:
Table 13 – Life Expectancy
1980 2020 2060
Birth-65 years (1) 6.5 13.8 18.7
Diff. 65 years (2) 8.5 5.7 4.3
Note. (1) Life expectancy beyond 65 years, defined at birth; (2) Difference between life expectancy beyond 65 years defined at birth and life expectancy defined at 65.
These latter indicators merit some emphasis since, to a certain extent, they corroborate other studies; therefore, we can state, in simple terms, that “Diff. 65 years” decreases from 8.5 years in 1980 to 4.3 years in 2060, which is a reduction of approximately 50% in 80 years. This, combined with “Birth-65 years”, permits us to conclude that:
Not only will we live longer, but increasingly we will arrive at the NRA, a
phenomenon known in the literature as the “expansion” of the curve of deaths. In other words, fewer of us will “fall by the wayside” before reaching the NRA.
Our “time” of death is increasingly concentrated around the mode (at adult and
“rectangularisation” of the survival function. It is not inconceivable that advances in genetic science in the coming years will make possible the extension of human life until well beyond a century, to such an extent that the uncertainty of biological death becomes reduced to a couple of months at some time during this extended longevity.
We are starting to observe a diminishing of the random element in the determination of the costs associated with Social Security systems, in addition to the determination of the amounts of the benefits to be paid out. Hence, given the existence of a demographic equilibrium between generations, the question, “What is the cost of living ever longer?” loses its meaning.
If we consider as a benchmark a life expectancy at age 65 years of 19.5 years in 2020 and 23 years in 2060, the implication is that any worker entering the system in 2020 and going on to complete 40 years of occupational activity will have to finance, throughout that period, the additional cost of having a life-expectancy “excess” of 3.5 years.
Let us suppose that the annual pension at the NRA is given by , which could be the
current Social Security General Regime pension. Thus, on reaching the NRA, the gain due to the life-expectancy “excess” can be measured by the difference:
, where , are the actual amounts of an income for life
determined in 2060 and 2020 (life annuities), respectively.
r
B
(
2 1)
r NRA NRA
B a − a 2aNRA 1aNRA
The two most common methods to finance the above differential are: 1. Pay the differential throughout the whole occupational lifetime;
2. Accept a reduction in the income that will serve as the retirement pension.
Once again, for the purpose of simplification, let us suppose that an individual enters the labour market at age 25 and completes a working life of 40 years, taking his/her retirement pension at age 65 (NRA) and who has, on average, a salary growth rate and that the technical interest rate (which, also in order to simplify, we can assume to be the risk-free interest rate) is i.
A. Pay the differential throughout the whole occupational lifetime.
Let us consider a beneficiary who starts his/her active life in 2020 at age 25 and expose him/her to two different scenarios. In order to pay the “life excess”, let us determine an instalment that is equal to a constant percentage of his/her salary. Thus, for each 1,000 € of annual income, this individual will have as a first annual instalment (with general expressions, for the annuities):
(
)
(
)
2 1 40 2 : 1.000 1 NRA NRAx NRA x
a a
i a −
−
+ ×
(1)
Table 15 – Instalment Calculations Scenario 1: Constant Retirement Pension
First Payment
Technical Rate
Salary
Growth 2.0% 3.0% 4.0% 5.0% 6.0% 10.0%
3.0% 21.55 € 14.31 € 9.49 € 6.29 € 4.17 € 0.80 €
4.0% 17.57 € 11.81 € 7.93 € 5.32 € 3.56 € 0.72 €
5.0% 14.18 € 9.65 € 6.56 € 4.45 € 3.02 € 0.63 €
6.0% 11.34 € 7.81 € 5.37 € 3.69 € 2.53 € 0.56 €
7.0% 8.99 € 6.26 € 4.35 € 3.03 € 2.10 € 0.48 €
8.0% 7.08 € 4.98 € 3.50 € 2.46 € 1.73 € 0.41 €
9.0% 5.53 € 3.93 € 2.79 € 1.98 € 1.41 € 0.35 €
10.0% 4.30 € 3.08 € 2.21 € 1.58 € 1.14 € 0.30 €
Scenario 2: Pension with 3.5% Growth Per Annum First Payment
Technical Rate
Salary
Growth 2.0% 3.0% 4.0% 5.0% 6.0% 10.0% 3.0% 48.59 € 31.40 € 20.28 € 13.09 € 8.45 € 1.48 €
4.0% 39.61 € 25.92 € 16.95 € 11.07 € 7.23 € 1.32 €
5.0% 31.97 € 21.18 € 14.01 € 9.27 € 6.12 € 1.16 €
6.0% 25.57 € 17.13 € 11.47 € 7.68 € 5.13 € 1.02 €
7.0% 20.28 € 13.74 € 9.30 € 6.30 € 4.26 € 0.89 €
8.0% 15.96 € 10.92 € 7.48 € 5.12 € 3.50 € 0.76 €
9.0% 12.47 € 8.62 € 5.96 € 4.12 € 2.85 € 0.65 €
Figure 1 - Constant Retirement Pension
nto
0 € 5 € 10 € 15 € 20 € 25 €
3,0% 4,0% 5,0% 6,0% 7,0% 8,0% 9,0% 10,0%
C l
2,0%
3,0%
4,0%
5,0%
6,0%
10,0% Primeiro Pagame
First Payment
rescimento Salaria Salary Growth
Figure 2 - Pension with 3.5% growth per annum
Primeiro Pagamento
0 € 5 € 10 € 15 € 20 € 25 € 30 € 35 € 40 € 45 € 50 €
3,0% 4,0% 5,0% 6,0% 7,0% 8,0% 9,0% 10,0%
C
2,0%
3,0%
4,0%
5,0%
6,0%
10,0%
Hence, taking a technical rate of 3% and a salary growth rate of 5% as references, the graph of the annual payments due throughout the 40-year career lifetime is depicted as follows:
Figure 3 – Annual Payments
B. Accept a reduction in the income that will serve as the retirement pension.
Here, matters are simpler, since the calculations are independent of salary growth. Thus, for the two scenarios, we obtain the following:
Table 16 – Pension in 2060 relative to the Pension in 2020 Scenario 1: Constant retirement pension
Technical Rate
2.0% 3.0% 4.0% 5.0% 6.0% 10.0% 87.5% 88.7% 89.8% 90.8% 91.7% 94.2%
Scenario 2: Pension with 3.5% growth per annum Technical Rate
3.4.DEVELOP ANNUITY MARKETS
Life annuity products have been sold in the past primarily as retirement accumulation vehicles, rather than decumulation products (Brown et al., 2001). This may explain why annuity markets in Portugal and in most OECD countries have been relatively underdeveloped to date. Nonetheless, the conversion of traditional private defined-benefit (DB) pension plans into defined-contribution (DC) pension plans and the move in many European countries towards funded pension systems has attracted attention in annuity markets. Furthermore, the Portuguese state-financed public pensions system will inevitably be forced to moderate benefit promises in the future. These developments will imply a drop in the fraction of retirees’ pension income that is a mandatory annuity and in turn, they suggest that insurance-based and privately-purchased annuity products will emerge as “natural” substitutes.
The appeal of life annuities is that they offer retirees an opportunity to protect themselves against the risk of outliving their assets (or simply the risk of decreasing retirement income), by exchanging an initial (or periodical) premium for a lifelong stream of guaranteed income. Purchasing life annuities is thus a means by which retirees can allocate their private savings in order to enhance retirement security, since they provide a steady income stream until the insured party’s death. Fully-developed annuity markets offer investors a variety of products taking many different payout forms, structured with a wide range of premium payment paths, yielding benefits in nominal or real terms, either constant or variable and may include additional guarantees.
of mortality should, in this sense, be considered a matter of public interest and form part of a clear supervision policy.
Second, annuity markets are often affected by strong adverse-selection problems. This arises if buyers of annuities prove to be live longer than average, inducing insurance companies to devise separate mortality tables for annuitants as opposed to those for the general population. Whether adverse selection is quantitatively important may depend on whether annuitisation is considered optional or mandatory. In this sense, increasing compulsory annuitisation can significantly reduce adverse-selection problems.
Third, fiscal incentives should be created in order to stimulate insurance protection against longevity risk. In modern competitive markets, individual financial decisions are also driven by people’s perceptions about the appeal of alternative investments, both during their working lifetime and after retirement. For instance, some individuals may avoid annuitisation on the grounds that they can manage their assets better than institutional fund managers. In this scenario, fiscal incentives could undermine saving decisions in favour of buying annuity protection.
Fourth, for older people, the risk of having to pay large medical bills or cover special health care costs induces them to retain at least a fraction of their assets instead of annuitising them. This concern should be acknowledged by the insurance industry by its developing new financial products that merge life annuities with liquidity requirements.
Moreover, if real annuities are to be provided, real long-term bonds will have to be issued as well. This means that annuity markets would definitely benefit from the issuance of long-term government bonds. Moreover, recent events in Argentina and Russia have shown that the quality of assets considered is important, since the possibility of default is real.
On the other hand, longevity risk, i.e., the chance that entire cohorts live longer than anticipated in projected mortality tables, remains a real concern for insurance companies selling annuity products, since substantial changes in mortality patterns could seriously challenge their profitability. Insurance companies can, for example, hedge longevity risk with offsetting life insurance contracts, reducing (but not eliminating completely) the impact of negative mortality scenarios. Some advocate that governments (or private companies) should issue cohort “survivor bonds” (or longevity bonds), i.e., bonds whose future coupons payments depend on a survivorship index (for example, the percentage of the whole population of retirement age - say 65 - on the issue date still alive on the future coupon payment dates) (Blake et al., 2002).
Although survivor bonds are good candidates for hedging aggregate mortality risk, they do not provide a perfect hedge against the particular characteristics of a company’s pool of annuitants. In this sense, there is basis risk between the reference population mortality and the mortality experienced by any individual pool of annuitants. Other problems related to the issuance of survivor bonds include: i) the ability of dealing with a business involving huge amounts of capital, ii) pricing complications related to the adoption of a particular (stochastic) representation of mortality uncertainty and the estimation of the market price of longevity risk and iii) the importance of attractive contract design in order to boost market liquidity for traded securities and reduce credit risk.
4.CONCLUDING REMARKS.
Whilst Portugal is no different to many other countries, and not least to our European partners, in its people’s reaction to any proposal to amend legislation that might have an impact on the definition of our expected retirement benefits, it is equally true that we are all increasingly aware of the need to introduce such amendments to the system.
Furthermore, if in the not-too-distant past, we started to work at the age of 16 and ended at 65, followed by 5 or 6 years of retirement, we cannot demand today that the State – which is us – keeps us at school until the age of 22 and also pay us a retirement pension – if possible, with a guarantee of protection from inflation – equal to the last salary at age 55, in order to pay the doctor who keeps us alive until we are 85. We are speaking about life-cycles which are entirely different in terms of the demand on capital. However, we do not believe that it would be very difficult to convey the message that the future cannot be like the past in this respect.
Perhaps an approach that is based on the ideas presented in this paper should not automatically be discarded, because life expectancy, which appears to be the problem, in the sense that there are insufficient financial resources to pay for retirement, may in fact also be part of the solution. This could come about by:
Transforming the increased life expectancy into an economic good and opting to
pay for the “life excess” throughout the entirety of the occupational lifetime. This would call for a financial effort that the simple indicators presented here do not seem to suggest is beyond reason; or
Accepting the “natural reduction” of the pension benefits; or
Prolonging the occupational lifetime and using the “life excess”, or part of it.
The idea that the first of these three hypotheses could serve to advance the development of the third pillar is reinforced here.
REFERENCES
Adair, T. (2003). Demographics, economics and social choice. London School of Economics, Nov 2003.
Björkman, H., Dahlsten, F., Gustafsson, C., Johansson, T., Kling, R., Kohn, K., Linnarsson, H., Nordin, F., Sungren, M., Westberg, J. “The Spectre of the Grey Panters.” The Fenix ResearchProgram/IMT, Stockholm School of Economics, 2001.
Blake, D., Burrows, W., Orzag, M. “Survivor Bonds and Compulsory Annuitization: Helping Reduce the Cost of Pension Provision.” In Bodie, Z., Hammond, B., Mitchell, O., eds. Innovations in Financing Retirement. Pension Research Council. Philadelphia, PA: University of Pennsylvania Press, 2002.
Brown, J., Mitchell, J., Warshawsky, M. “The Role of Annuity Markets in Financing Retirement”, MIT Press, 2001.
Carrilho, M. “Evolução demográfica no período intercensitário 1991-2001.”, INE, 2002.
Fougère, M.; Mérette, M. (1999). “An econometric examination of the impact of population ageing on personal savings in Canada”. Department of Finance Working Paper N.º 1999-03, The Ministry of Finance of Canada.