Funding Contract Duration of Microcredit Loans
Nazaré Barrosoa , Carlos Pestana Barrosb and Maria Rosa Borgesc
a Instituto Superior de Economia e Gestão; Technical University of Lisbon Rua Miguel Lupi, 20; 1249-078 - Lisbon, Portugal and Advance. Email: mnebarroso@iseg.utl.pt
b Instituto Superior de Economia e Gestão; Technical University of Lisbon Rua Miguel Lupi, 20; 1249-078 - Lisbon,
Portugal and UECE (Research Unit on Complexity and Economics). Phone: +351 - 213 016115; fax: +351 - 213 925 912. Email: Cbarros@iseg.utl.pt
c Instituto Superior de Economia e Gestão; Technical University of Lisbon Rua Miguel Lupi, 20; 1249-078 - Lisbon, Portugal and UECE (Research Unit on Complexity and Economics). Email: mrborges@iseg.utl.pt
Abstract: This study analyses the funding contract duration of microcredit loans in Portugal from 1999 to 2008, using a data file from the Portuguese Microcredit Association that overseas all microcredit actions. A survival model is used to analyse which characteristics are associated with the duration of the contract, taking into account the uncontrolled heterogeneity of the data. Policy implications are derived for improving the understanding and management of the duration of microcredit funding contracts.
Keywords: Microcredit, survival models, funding, policy.
1. Introduction
countries, the microcredit loans are based in non-governmental organizations and cooperatives at a level below the formal banking system, (Armendariz de Aghion and Morduch, 2000) but in developed countries the microcredit loans are based in the formal banking system supported by non-governmental organizations, Jayo et al. (2009). Therefore, microcredit organizations exist both in underdeveloped countries (Jones, 2008; Gutierrez-Nieto, 2006) and in developing countries, Nader (2008). The present study analysis microcredit loans in Portugal from 1999 to 2008, using an administrative data file from the Microcredit Association to estimate survival models that explain the duration of the loans, based in covariates.
The motivation for the present research is the following. First, the duration of the microcredit loans delivered from formal banks tend to follow the norm applied to the upper level of the credit market, and this tendency harms low level loans. Therefore, the investigation of the duration is of paramount importance to identify the covariates of the loans which survive. Second, survival models have proven to be particular suited to the modeling and analysis of duration events. Although the usefulness and reliability of survival modeling for predicting duration events has been recognized, their application to microcredit is unknown. Third, it is important, for policy purposes, to investigate how microcredit borrowers react to the duration of their loans.
models and demonstrates that the Weibull specification enables the survival model to best represent the observed duration (Chesher 1984 and Chesher and Santos Silva, 2002).
Our model allows the identification of significant statistical variables that explain the duration of the loan. The value of such research is twofold. First, it facilitates comparison with alternative research on microcredit which has adopted regression models (Copestake et al., 2001). Second, it could contribute to improve policy formulation in the microcredit industry. As the duration is such a fundamental feature of microcredit loans, a more adequate policy can be more effectively developed and microcredit resources can be more appropriately deployed.
The general conclusions are: (i) the duration of microcredit loans are influenced by specific characteristics of each microcredit borrower and vary according to the amount of the loan; (ii) the duration changes according to certain market characteristics. Therefore, policies based in an assumption of homogenous microcredit borrowers may be ineffective or inappropriate.
The remainder of the article is organized as follows. Section two presents the literature review. In section three, we describe some relevant information about microcredit in Portugal. Section four and five explain, respectively, the methodology applied and the hypothesis tested. Section six explains the data and section seven presents the results. Section eight discusses the results and, finally, section nine concludes.
2.1. Microcredit: the concept and the mechanism
Microcredit was born in the second half of the 1970s when Muhammad Yunus created the Grameen Bank, which in 1978 started providing microcredit to poor households in rural areas in Bangladesh, previously excluded by the formal financial sector, without any collateral and charging market interest rates. With little money, people were able to manage a small business. In the lending model of the Grameen Bank, borrowers sort themselves into small groups of a handful of people. Few members of this small groups get loans. If they repay on time, a next subset of members gets loans, and so on. The process continues, with members of each group taking loans, as long as performance is satisfactory. When a member defaults, all members of the group are barred from borrowing in the future. This mechanism allows microfinance programs to generate high repayment rates, even from clients that had traditionally been thought to be too risky and too poor to offer collateral.
The number of microcredit and microfinance institutions also grew strongly in the developing world, providing benefits in terms of rural entrepreneurship, growth, income enhancement, poverty reduction and increased food security and livelihoods (Hartarska and Holtmann 2006; Meyer and Nagarajan 2006; Zeller 2006). Microcredit provides another approach: a non-collateral economy, different to the collateral based credit-rationing model of Stliglitz and Weiss (1981) (conventional economic models).
At the end of 2006, microfinance programs around the world reached 113 million borrowers and, among them, 82 million living in severe poverty conditions. Data collected from 200 microcredit finance institutions throughout the world, shows that the average loan loss was only 1% in 2005.
2.2. From the early experience to the present
There are several studies reporting the results of microcredit programs carried out by government and non-government agencies in developing countries. Panjaitan-Drioadisuryo and Cloud (1999), Amin, Ray and Topa (2003), Copestake, Bhalotra and Johnson (2001) and Nader (2008) conclude that microcredit programs greatly increases the repayment rates and substantially improves the well-being of poor families. There have been numerous attempts to assess the impact of these programs on a variety of outcomes (Pitt and Khandker, 1998, Morduch, 1998, and others ), but there has been little research on how well targeted modern microcredit programs actually are.
China, Albania, Russia, Poland, Romania, Bulgaria, Slovakia, and other Eastern European countries. The main objective of these programs is to raise incomes and broaden financial markets by providing financial services (mainly credit) to small-scale entrepreneurs who otherwise would lack access to capital markets. Some of the programs have primarily social missions, focusing on outreaching women and measuring success in terms of poverty alleviation. Other programs aim to promote private sector activity in terms of unemployment and under-employment. As transition economies undergo structuring, microfinance has been put forward as a flexible tool to help individuals exploit new opportunities (Armendáriz and Morduch, 2000).
It is important to note that, in the 1990s, microcredit programs contrast with the earlier credits, namely in being more demand-driven, charging higher interest rates, controlling costs, and emphasizing savings mobilizations as a prerequisite for sustainable credit provision (Otero and Rhyne 1994; Morduch 1999).
In Western Europe, the development of microcredit is relatively recent (with the exception of United Kingdom and France, which started at the end of the 1980s). Microcredit has developed in a variety of forms, including specialized banks, downscaled commercial banks, credit cooperatives and non-profit associations. The European Commission sees microcredit and microfinance as important to promote innovation, employment and social inclusion. Financing micro firms is important for economic growth, has impact on employment and contributes both to wellbeing and social cohesion.
3. Contextual setting: Microcredit in Portugal
In Portugal, the association that deals with microcredit, the “Associação Nacional de Direito ao Crédito” (ANDC) envisages to enhance the social insertion and the autonomy of people with financial difficulties or in a situation of exclusion, through economic initiative. ANDC was created in 1998, as a non-profit organization. It signed agreements with three banks, which provide the microloans to the potential micro entrepreneurs approved by ANDC.
ANDC defines microcredit as a small loan to people that don’t have access to banking loans, but do want to develop an activity on their own and present some personal conditions and abilities which may anticipate the success of their project. Microcredit
The process to obtain a micro loan follows the following steps. First, the candidate contacts ANDC. Second, ANDC fills in a form with some information, including name of the candidate, date of first contact, date of birth, nationality, proposed business, amount of the loan the candidate is applying for and previous experience in the planned business. Then, if eligible, the ANDC Credit Commission analyzes it and writes a proposal that is sent to one of the banks with which it has signed agreements. This proposal adds some relevant information about the candidate: education, marital status, number of children. It contains also a more detailed project and the agent’s opinion about the feasibility of the project.
The maximum amount for a microloan in Portugal is, presently, ten thousand Euros. The interest rate for these credit operations is based on the Euribor plus a spread (now, 2%).The companies created by micro entrepreneurs that received a microloan within this framework are spread among different areas of business. Most of them are related to food business: familiar shops, bars and restaurants which, put together, represent around 24% of the total number of micro businesses created in Portugal. Considering economic activities in more detail, cloth related business (small shops) is the most representative activity in terms of number of firms created.
Insert Table 1 –business
Portugal is divided in 18 districts; the most important of them are Lisbon and Oporto. The micro firms created are located mainly in these two districts.
Insert Table 2 –location
225 new jobs were created. In the ten years of its existence, the total amount of microloans represented more than four and a half million euros. The average amount of a microloan in Portugal, in these ten years, was around 4500 euros, which rose to almost 6000 euros in 2008.
Insert Table 3 - statistics
Concerning the origin of micro entrepreneurs in Portugal, it’s not surprising finding
that, after Portuguese micro entrepreneurs, that represent 85% of total, most of them come from Africa, mainly from Angola, Cape Verde and Saint Tome and Prince. All the three countries were Portuguese colonies till 1975 and, since the decolonization in the seventies, Portugal received a large number of people from these previous colonies that now live and work in Portugal.
Insert table 4 –Origin
The level of education of micro entrepreneurs is very different. In Table 5, we used the International Standard Classification of Education (I S C E D 1997), which provides an integrated and consistent statistical framework for the collection and reporting of internationally comparable education statistics. There is a small number without any level of education, mainly women. However, this difference almost disappears in the remaining levels of education. Education level 3 and 4 concentrate 50% of micro entrepreneurs. Finally, it is important to note that near 15% of the entrepreneurs have university levels of education.
Insert Table 5 - Education
For all micro entrepreneurs that have received a microloan, ANDC monitors the development of the project during three years, i.e., the usual duration of the loan. During this period, the agent monitoring the project writes periodic reports about the project status: first, if the project is ongoing or closed; second, if the payments have been made on time or otherwise, and some comments on his personal opinions about the micro entrepreneur. After the end of the loan, ANDC does not monitor the project any longer.
4. Methodology
In this study, duration of funding contracts of microcredit borrowers is analysed using survival models. Survival models, also known as duration models, measure the duration of an event, defined as the time elapsed until a certain event occurs. The use of survival models to model time is based on the fact that the distribution of the error in this context is traditionally skewed to the right (Hosmer and Lemeshow, 1999).
likely to be independent. Second, the time hazard Weibull model is estimated for comparative purposes. However, there may be some correlation among individuals and ignoring this dependence could yield erroneous variances estimates and possibly biased estimates (Box-Steffensmeier, Reiter and Zorn, 2003). Therefore, we finally estimate a heterogeneous Weibull non proportional hazard model.
For the Cox model, the hazard is specified as: ) exp( ) ( ) |
( ik 0k ik
ik t X h t X
h (1)
where k denotes the event number, and i is the individual, h0k(t) is the baseline hazard and varies by event number, X is a vector of covariates which can be time dependent, and is a vector of parameters. The parameters are estimated using partial likelihood given by:
n i K k n i K k ik ik ik i ik i X Y X L 1 1 1 1 exp exp ) ( (2)where is a censoring indicator equal to one if observed and zero if censored and Y is a risk indicator which is equal to one if the individual is at risk for the current event and zero otherwise and x are the covariates.
We also consider the Weibull model defined by:
) exp( ) exp( ) ( ) / ( 1 0 j o p t j j x pt x t h x t h (3)
Overdispersion is caused by misspecification or omitted covariates. Heterogenous (frailty) models attempt to measure this overdispersion by modelling it as resulting from a latent multiplicative effect on the hazard function, e.g.
) exp( ) ( )
( ) /
( t
j i
o i i i i
i h t h t x t
h
(4) where the dependent parameter,k corresponds to the omitted covariate.
5. Hypotheses
Following the theoretical models that exist in this field (Townsend 2003; Armendariz de Aghion and Morduch 2000) the aim of the research is to evaluate the duration of financial contracts of microcredit borrowers. It is assumed that the duration can be explained by several factors. First, the geographical origin of the individuals who apply for microcredit. Second, other socio-demographic characteristics beyond nationality such as age, gender and education. Third, the location of the microcredit in the country, as some locations have larger markets to support a small business. Fourth, the banks that lend, distinguished by the internal norms of each bank. Fifth, the investment value (or amount of the credit), as higher values are more difficult to repay than small values. Sixth, the interest rate paid. Finally, the economic activity financed by the microcredit. These combined variables enable the definition of the following research assumptions or hypotheses.
by considering the following geographical origins of the microcredit borrowers: Africa,
Latin America, East Europe and West Europe, which are alternative to the most common, which is Portugal.
The duration of microcredit funding projects may be influenced by socio-demographic characteristics such as education, age and gender of the borrower. Socio-economic characteristics have been used in microcredit research to identify individual characteristics (Nader 2008). Survival models equally use socio-economic characteristics as an identifier of the individual characteristics. The next three hypothesis are related to socio-economic characteristics of the borrowers.
Hypothesis 2 (education): the duration of microcredit funding projects is expected to be negatively determined by the education of the borrower, because knowledge related to education makes the borrower more aware of the importance of ending the funding contract.
Hypothesis 3 (age): the duration of microcredit funding projects is expected to be negatively determined by the age of the borrower, because older borrowers have less time available to settle the contract.
Hypothesis 4 (gender): the duration of microcredit funding projects is expected to be negatively determined by the gender of the borrower.
Lisbon, so we test if alternative locations have an impact on duration. This hypothesis is tested by the dummy variables: Lisbon, Oporto, Aveiro, Evora, Faro, Leiria and
Setubal. The country has 18 districts therefore we use a small amount of the most important districts in microcredit.
Hypothesis 6 (the bank): the duration of microcredit funding projects is influenced by the bank that lends the money. This hypothesis has not been previously tested in the literature, although it is consensual that the different banks may have different loan policies. Most of the credits are lent by BCP, so we test if alternative banks have an impact on duration, by considering the following dummy variables: BCP, CGD. The reference bank is BES not used in the analysis.
Hypothesis 7 (investment value): the duration of microcredit funding projects is positively determined by the investment value, as bigger values may take more time to reimburse than smaller values. This hypothesis is tested by the variable: investment value.
Hypothesis 8 (interest rate): the duration of microcredit funding projects is positively determined by the interest rate implicit in the funding.
Hypothesis 9 (activity): The duration of microcredit funding projects is influenced by the activity undertaken by the investor. The most common activity is “Commercial
In order to test the hypotheses outlined above, we use survival models (Cox and Oakes 1984; Allison 1984; Yamaguchi 1991; Hosmer and Lemeshow 1999; Kalbfleich and Prentice 2002; Cleeves, Gould and Gutierrez 2002).
6. Data
The data relates to the microcredit contracts celebrated in Portugal between 1998 and 2008, under the auspices of the Portuguese association for microcredit (ANDC). The database contains information on a total of 1,090 microcredit contracts. Specifically, the information includes the individual characteristics of the borrower, namely country of origin, the socio-economic characteristics of the borrower and the location of the financed investment. The database also includes the name of the bank that funded the project, the amount of the investment and the average reimbursement value. From these 1,090 contracts, 340 observations have been dropped because of missing observations leaving us with 750 observations.
Table 6 presents the characteristics of the variables.
INSERT TABLE 6
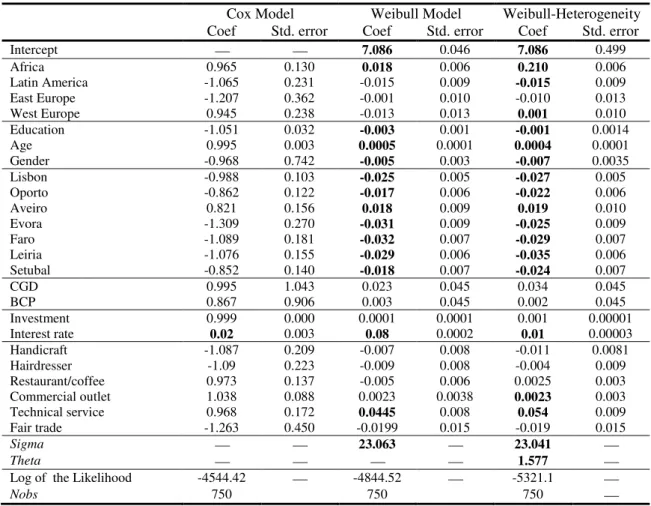
7. Results
semi-parametric survival model, while the Weibull model is the traditional survival model.
INSERT TABLE 3
parameters induces correlation across the alternatives in the choice and therefore, survival models with heterogeneity are required.
In this regard, the following variables affect positively the duration of Portuguese microcredit loans: Africa, West Europe, Age, Aveiro, CGD, BES, BCP, interest, Restaurant/coffee, Commercial outlet and technical service. These are intuitive covariates that explain the increase in loan duration with statistical significance, while Latin America, East Europe, Education, Gender, Lisbon, Oporto, Evora, Faro, Leiria, Setubal, investment, handcraft, hairdresser and fair seller influence negatively the duration. Some of these variables are not intuitive.
8. Discussion
The paper analyses the determinants of the microcredit loan duration in Portugal, using survival models. In relation to the hypotheses, taking into account the Weibull model with heterogeneity, the results allow us to accept the majority of the research assumptions.
activity has a mix relation with duration, with some activities increasing the duration (restaurant/coffee, commercial outlet and technical service) while others decrease the duration (handcraft, hairdresser and fair seller).
The general significance of these results, taking as reference the Weibull with heterogeneity, is that they indicate that the microcredit loan duration increases with some covariates but decrease with others. Some of these are intuitive, but others are not. The intuitive results are those related to investment and interest paid, since higher investment and higher interest are more difficult to reimburse and pay, those related to socio-economic characteristics such as age, since older investors have a higher duration, while education and gender decreases it. The non intuitive results are those related to geographical origin, location and activity of the microcredit investors signifying that investors from more developed regions are better prepared diminishing the duration of the fund contract, and investors located in Aveiro tend to increase the duration and some activities increase the duration of the microcredit funding probably due to their lower profitability.
9. Conclusion
This paper has analysed the influences on the duration of microcredit loans in Portugal.
Several duration models were presented for comparative purposes, a Cox proportional hazard model, the parametric Weibull model and a Weibull model with heterogeneity. The Weibull model with heterogeneity was chosen, based on the log likelihood statistics. It is concluded that the microcredit funding duration is positive related to some covariates but negative related to others. More investigation is needed to clarify the present research.
References
Amin, Sajeda, Rai, Ashok S. And Topa, Giorgio (2003), Does microcredit reach the poor and vulnerable?- Evidence from northern Bangladesh, Journal of Development Economics, 70, 59-82.
Armendáriz de Aghion, B. and Gollier, C. (2000). Peer group formation in an adverse selection model. The Economic Journal, 110, 632-644.
Armendáriz de Aghion, B. and Morduch, J. (2000) Microfinance beyond group lending. Economics of Transition, 8, 2, 401-420.
Armendáriz de Aghion, B. and Morduch, J. (2005), The economics of microfinance, Cambridge, Mass.: MIT Press
Allison, P. D. (1984) Event History Analysis. Beverly Hills, CA. Sage.
Barros, C.P.; Passos. J. and Gil Alana, L. (2005) The Timing of ETA Attacks. Journal of Police Modeling, 28, 335-346.
Latin American Tourism Destinations. Tourism Analysis (forthcoming).
Barros, C.P.; Frick, B. & Passos, J. (2008) Coaching for Survival: The Hazards of Head Coach Careers in the German "Bundesliga". Applied Economics (forthcoming).
Becchetti, L. and Pisani, F. (2008), Microfinance, subsidies and local externalities, Small Business Economics,XXXX
Besley, T., Coate, S. (1995), Group lending, repayment incentives and social collateral, Journal of Development Economics, 46, 1, 1-18.
Bester, H. (1994), The role of collateral in a model of debt renegociation, Journal of Money Credit and Banking, 26, 72-86.
Boehmke, F.; D.S. Morey & M. Shannon (2006) Selection bias and continuous-time duration models. American Journal of Political Science, 50: 192-207.
Box-Steffensmeier, J.; Reiter, D. & Zorn, C. (2003) Nonproportional hazard and event history in international relations. The Journal of Conflict Resolution, 47, 33-53.
Brehanu, A. and Fufa, B. (2008) Repayment rate of loans from semi-formal financial institutions among small-scale farmers in Ethiopia: Two-limit Tobit analysis. The Journal of Socio-Economics, 37, 2221-2230.
Cameron, A.C. & Triverdi, P.K. (2005) Microeconometrics: Methods and Applications. Cambridge University Press, Cambridge, N.Y.
Carrasco, R. (1999) Transitions to and from self Employment in Spain: An Empirical Analysis. Oxford Bulletin of Economics and Statistics, 61, 315-341.
Chesher, A. (1984) Testing for Neglected Heterogeneity. Econometrica, 52, 865-872.
Chesher, A. & Santos-Silva. J. (2002) Taste Variation in Discrete Choice Models. Review of Economic Studies, 69, 147-68.
Analysis using stata. College Station TX. Stata Press.
Copestake, James, Bhalotra, Sonia and Johnson, Susan (2001), Assessing the impact of microcredit: A Zambian case study, Journal of Development Studies, 37, 4, 81-100.
Cressy, R. (1995), Commitment lending under asymmetric information:Theory and tests on UK startup data, Small Business Economics,8, 5, 397-408.
Del Corral; Barros, C.P. & Prieto-Rodriguez, J. (2008) The Determinants of Soccer Player Substitution: A Survival Analysis of the Spanish Soccer League. Journal of Sport Economics, 9, 2, 160-172.
Gangopadhyay, S., Ghatak, M. and Lensink, R. (2005). On joint liability and the peer selection effect, Economic Journal, 115, 1005-1015.
Ghatak, M. (2000), Screening by the company you keep: joint liability lending and the peer selection effect, The Economic Journal, 110, 601-631.
Gutierrez-Nieto, B. (2006) Microcredit in the North: An institutional, impact and dependence analysis applied to the Spanish case. Annals of Public & Cooperative Economics, 77, 1, 21-52.
Hollis, A. and Sweetman, A. (1998) Microcredit in prefamine Ireland. Explorations in Economic History, 35, 347-380
Hosmer, D.W. & Lemeshow, S. (1999) Applied Survival Analysis: Regression modeling of time to event data. John Wiley, N.Y.
Jayo, B; Lacalle, M.; Rico, S.; Dayson, K. and Kickul, J. (2009) Handbook of Microcredit in Europe. Edward Elgar, Chaltenham, U.K.
Jones, P.A. (2008) From tackling poverty to achieving financial inclusion- the changing role of British credit unions in low income communities. Journal of Socio-Economics, 37, 2141-2154.
Kalbfleich, J. D. & Prentice, R.L. (2002) The Statistical Analysis of Failure Time Data. 2nd edition, New York, John Wiley and Sons.
Laffont, J. and N’Guessen, , (2000), Group lending with adverse selection, European
Morduck, J. (1998). Does microfinance really help the poor? New evidence from flagship programs in Bangladesh, mimeo, New York University.
Morduck, J. (1999). The microfinance promise, Journal of Economic Literature, 37, 1569-1614.
Nader, Y.F. (2008) Microcredit and socio-economic wellbeing of women and their families in Cairo.The Journal of Socio-Economics, 37, 644-656.
Panjaitan-Drioadisuryo, R. and Cloud, K. (1999), Gender, self-employment and microcredit programs – An Indonesian case study, Quarterely Review of Economics and Finance, 39, 769-779.
Pitt, M. and Khandker, S. 1998, The impact of group based credit programs on poor households in Bangladesh: does the gender of participants matter? Journal of Political economy, 106, 5.
Stiglitz, J. (1990), Peer monitoring in credit markets, World Bank Economic Review, 4, 351-366.
Stiglitz, J. and Weiss, A. (1981), Credit rationing in markets with imperfect information, American Economic Review, 71, 393-410.
Townsend, R.E. (2003) Microcredit and mechanism design. Journal of European Economic Associations, 1(2-3), 468-477.
Turvey, C. and Kong, R. (2008), Vulnerability, trust and microcredit – the case of
China’s rural poor, Research Paper nº 2008/52, United Nations University- World Institute for Development Economics Research.
Varian, H. (1990), Monitoring agents with others agents, Journal of Institutional and Theoretical Economics, 146, 153-74.
Wooldridge, J.F. (2002) Econometric Analysis of Cross Section and Panel Data. MIT Press, Cambridge, MA.
Table 1
Micro firms created in Portugal, 1998 – 2008
Business Percent
Clothes (small shop) 12,2 %
Food (small shop) 11,8 %
Restaurant /Bar /Café 11,8 %
Handcraft Building
8,1 % 4,7%
Hairdressers 3,7%
Sewing 2,9 %
Other 44,8 %
Total 100,0 %
Table 2
Micro firms per district, 1998 - 2008
Number Percent
Aveiro 51 4,7
Leiria 97 8,9
Lisboa 399 36,6
Porto 127 11,7
Setúbal 87 8,0
Evora 58 5,3
Faro 63 5,8
Other districts 208 19,0
Total 1090 100,0
Table 3
Microloan amount – some statistics
Year
of approval Mean Mode Median
Standard
Deviation Minimum Maximum
1999 3640 4988 4960 1563 1013 5042
2000 3577 1017 4549 1606 1011 4988
2001 4639 4985 4984 758 2034 5036
2002 4417 4997 4997 969 1012 5000
2003 4369 5058 4997 1055 1292 5181
2004 4632 5058 5058 870 2122 5227
2005 4563 5058 5058 918 1015 5266
2006 4238 5000 5000 1129 1000 5228
2007 5310 5000 5000 1385 1500 7500
Table 4
Origin of micro entrepreneurs
Gender
Total
Male Female Percent
Africa 41 58 99 9,1%
Latin America 17 9 26 2,4%
East Europe 8 4 12 1,1%
West Europe 7 15 22 2,0%
Portugal 438 489 927 85,0%
Asia 4 0 4 0,4%
Total 515 575 1090
Table 5
Processes approved by education and gender- 1998 - 2008
Male Female % of total number of
micro entrepreneurs
0 No education level 3 13 1,47
1 Primary level of education 89 91 16,51
2 Lower secondary level of education 94 97 17,52
3 Upper secondary level of education 113 139 23,12
4 Post-secondary, non-tertiary education 145 144 26,51
5 First stage of tertiary education 71 91 14,86
Table 2
Characterisation of the variables
Variable Description Minimum Maximum Mean Std. dev
Dur Duration of microcredit funding contract in
days 455 1581.7 1114.83 97.33
Origin
Africa The investor is an immigrant from Africa 0 1 0.093 0.291
Latin America The investor is an immigrant from Latin America 0 1 0.023 0.152
East Europe The investor is an immigrant from East Europe 0 1 0.020 0.140
West Europe The investor is an immigrant from West Europe 0 1 0.011 0.104
Socio-economic characteristics Education Academic qualifications
(1-Middle School; 2-High School; 3-Bachelors; 4-Masters; 5-Post graduate)
0 5 3.012 1.352
Age The age of the individual 17 72 38 10.22
Gender The gender of the individual (1- male, 0 –
female) 0 1 0.527 0.499
Location
Lisbon The district of location is Lisbon 0 1 0.366 0.481
Oporto The district of location is Oporto 0 1 0.116 0.320
Aveiro The district of location is Aveiro 0 1 0.046 0.211
Evora The district of location is Evora 0 1 0.030 0.171
Faro The district of location is Faro 0 1 0.057 0.233
Leiria The district of location is Leiria 0 1 0.088 0.284
Setubal The district of location is Setubal 0 1 0.079 0.271
Bank
CGD The bank is Caixa Geral de Depósitos 0 1 0.179 0.384
BCP The bank is Banco Comercial Português 0 1 0.748 0.434 Investment
Investment Investment value 2500 10000 4363 1912
Interest
Interest Average interest rate
0.024 0.058 0.032 0.027582
Activity
Handicraft Economic activity is handicraft 0 1 0.042 0.201
Hairdresser Economic activity is hairdresser shop 0 1 0.034 0.183
Restaurant/café Economic activity is restaurant or café 0 1 0.079 0.271
Commercial outlet Economic activity is a commercial activity
excluding the above listed 0 1 0.390 0.488
Technical service Economic activity is a technical service 0 1 0.055 0.228
Table 3 Results
Cox Model Weibull Model Weibull-Heterogeneity
Coef Std. error Coef Std. error Coef Std. error
Intercept 7.086 0.046 7.086 0.499
Africa 0.965 0.130 0.018 0.006 0.210 0.006
Latin America -1.065 0.231 -0.015 0.009 -0.015 0.009 East Europe -1.207 0.362 -0.001 0.010 -0.010 0.013 West Europe 0.945 0.238 -0.013 0.013 0.001 0.010 Education -1.051 0.032 -0.003 0.001 -0.001 0.0014
Age 0.995 0.003 0.0005 0.0001 0.0004 0.0001
Gender -0.968 0.742 -0.005 0.003 -0.007 0.0035 Lisbon -0.988 0.103 -0.025 0.005 -0.027 0.005 Oporto -0.862 0.122 -0.017 0.006 -0.022 0.006
Aveiro 0.821 0.156 0.018 0.009 0.019 0.010
Evora -1.309 0.270 -0.031 0.009 -0.025 0.009
Faro -1.089 0.181 -0.032 0.007 -0.029 0.007
Leiria -1.076 0.155 -0.029 0.006 -0.035 0.006 Setubal -0.852 0.140 -0.018 0.007 -0.024 0.007
CGD 0.995 1.043 0.023 0.045 0.034 0.045
BCP 0.867 0.906 0.003 0.045 0.002 0.045
Investment 0.999 0.000 0.0001 0.0001 0.001 0.00001 Interest rate 0.02 0.003 0.08 0.0002 0.01 0.00003 Handicraft -1.087 0.209 -0.007 0.008 -0.011 0.0081 Hairdresser -1.09 0.223 -0.009 0.008 -0.004 0.009 Restaurant/coffee 0.973 0.137 -0.005 0.006 0.0025 0.003 Commercial outlet 1.038 0.088 0.0023 0.0038 0.0023 0.003 Technical service 0.968 0.172 0.0445 0.008 0.054 0.009 Fair trade -1.263 0.450 -0.0199 0.015 -0.019 0.015
Sigma 23.063 23.041
Theta 1.577
Log of the Likelihood -4544.42 -4844.52 -5321.1
Nobs 750 750 750