Modeling travel mode choice under social influence
for the brazilian context
Diego Rosa Mota1, Pastor Willy Gonzales Taco2, Zuleide Oliveira Feitosa3
1Postgraduate Program of Transporta'on, CTNT, University of Brasilia, Brazil, drmota.enc@gmail.com 2Postgraduate Program of Transporta'on, CTNT, University of Brasilia, Brazil, pwgtaco@gmail.com 3Postgraduate Program of Transporta'on, CTNT, University of Brasilia, Brazil, zld.feitosa@gmail.com
Recebido:
26 de outubro de 2019
Aceito para publicação:
17 de abril de 2020
Publicado:
31 de agosto de 2020
Editor de área:
Bruno Vieira Bertoncini
ABSTRACT
This study aims to define a behavioral model to verify whether there is social influence on the travel mode choice made in the Brazilian context. To achieve this goal, a survey was carried out at the Darcy Ribeiro campus of the University of Brasilia, via which travel and social data were collected, and which were analyzed by a mul'nomial logit model. The results of the research reveal that there is social influence on the travel mode choice made by the students commu'ng to the University of Brasilia, especially when considering sustainable modes (biking and walking) and carpooling: the odds of an ego using a sustainable mode are 76% higher if there is an increase of 10% in the propor'on of alters who use sustainable modes. The odds of an ego carpooling are 27% higher when their alter’s carpooling increases by 10%. Knowledge of social influence allows a be<er percep'on of relevant factors for the decision-making process. Smart urban mobility policies must consider this perspec've, especially those policies that aim to promote sustainable and shared travel modes as alterna'ves to high levels of automobile use.
RESUMO
Busca-se neste trabalho a definição de um modelo comportamental para verificar a existência da influência social na escolha do modo de viagem no contexto brasileiro. Para isso, realizou-se uma pesquisa no campus Darcy Ribeiro da Universidade de Brasília (UnB) com coleta e modelagem logit mul'nomial de dados sociais e de viagem. Verificou-se, como resultado, a existência da influência social por conformidade na escolha do modo de viagem para a universidade quando se consideram os modos sustentáveis (bicicleta e caminhada) e a carona: a probabilidade de um indivíduo u'lizar modos sustentáveis em detrimento do automóvel é 76% maior quando a quan'dade de contatos sociais usuários destes modos aumenta em 10%. Para a carona este aumento é de 27%. A consideração da influência social permite a percepção mais abrangente dos fatores relevantes no processo decisório individual, sendo referência para a formulação de polí'cas públicas de mobilidade, com destaque para aquelas que buscam promover alterna'vas sustentáveis e compar'lhadas.
Keywords:
Travel mode choice. Social influence. Social network. Travel behavior.
Palavras-chaves:
Escolha do modo de viagem. Influência social.
Rede social.
Comportamento de viagem. DOI:10.14295/transportes.v28i3.2214
1. INTRODUCTION
Social aspects are a powerful issue as regards travel behavior research and, in the last decade, it has been a constant on the research agenda (Axhausen, 2008). When trying to understand how the characteristics of an individual’s social network in#luence their transportation choices, this approach is added to other approaches of the travel behavior research for a better understanding of urban trips. Therefore, we have more elements for planning urban mobility policies focused on the concepts of “smart cities”.
Traditionally, travel behavior research considers, in addition to an individual’s personal, psychosocial, sociodemographic and household characteristics, spatial and temporal constraints imposed by the urban environment on the individual’s daily schedule (Hackney and Marchal, 2011; Takano, 2018). When someone is considered to be in your social network, another dimension is included in the urban trip phenomena. There is a shift from understanding “where people are going”, “when people are going” and “what activities people are doing” towards “who they are interacting with” (Dubernet and Axhausen, 2015; Ronald et al., 2012; Hackney and Marchal, 2011; Carrasco and Miller, 2009; Axhausen, 2008).
One of the perspectives allowed in this #ield is social in#luence. Through their social network, it is possible to evaluate how (and whether) an individual’s decision-making process is in#luenced by the behavior of others with whom they maintain a relationship (their social contacts called alters). Social in#luence occurs by conformity when individuals attempt to match the behavior of others, and compliance, when individuals adjust their behavior to #it the commands, advice, and social norms, prevailing in the group (Maness et al., 2015).
Among the existing travel decision-making processes, there is the travel mode choice, which is the object of our research. Travel mode choices are important (Ortúzar and Willumsen, 2008) because current travel behavior research aims at elements that allow individuals to make sustainable trips, cycling or walking, by public transportation, or sharable modes, e.g. carpooling (rideshare). Thus, the aim is to reduce dependence on automobiles (Okushima, 2015; Long et al., 2015; Feitosa, 2018).
There are consolidated researches that discuss the social in#luence on an individual’s travel mode choice (Vinayak et al., 2018; Krueger et al., 2018; Feygin and Pozdnoukhov 2018; Lin et
al., 2018; Marek, 2018; Pike and Lubell, 2018). However, we do not see this topic being explored
in travel behavior research in developing countries such as Brazil (Mota, 2019) that has high automobile and public transportation (which is inef#icient in most cases) dependency rates (Mota et al., 2014). In addition to verifying the existence of social in#luence in the Brazilian context, we also understand that it is necessary to bring, to Brazilian research, the concept of considering Social Networks in Travel Behavior research. Therefore, the objective of this study is to develop a behavioral model to verify the existence of social in#luence on the travel mode choice within the Brazilian context.
In order to do this, we present a multinomial logit model created with travel and social data collected from a sample of users of the Darcy Ribeiro campus of the University of Brasilia (UnB), in the Federal District, Brazil. In the model, we included social in#luence, the individual’s and the urban environment’s characteristics as explanatory variables.
The following section presents a review of the literature on social networks and travel behavior. Section 3 describes the data sets and research methods used. Section 4 discusses the modeling results, and Section 5 presents an analysis and policy implications. In the last section, Section 6, there is a summary of the study results and guidelines for future research.
2. BACKGROUND
The theoretical framework of this study is mainly based on social networks and travel behavior. Despite the advances made in travel behavior research in the Brazilian context in recent years (Feitosa, 2018; Takano, 2018; Silva, 2013), the incorporation of social networks has not yet been seen (Mota, 2019).
A social network can be de#ined as a structure of relationships, in which individuals are represented by nodes (or vertices) and relationships between individuals by a link (or edges) (Carrasco and Miller, 2009; Carrasco et al., 2008). Nodes represent entities such as groups, organizations, nations, and people. Edges represent resource #lows, dependence, cooperation, friendships, information, support, and competition (Carrasco et al., 2008; Wasserman and Faust, 2009).
Social networks are primarily studied in sociology and have applications in other #ields. In general, social networking is used to understand how social structures facilitate or prevent behaviors and opportunities (Carrasco et al., 2008). Thus, social networks allow us to study how an individual’s decision-making process is modi#ied by other people’s actions, behaviors, attitudes, and beliefs, as well as the individual’s perception of other people’s actions, behaviors, attitudes, and beliefs (Kim et al., 2017; Maness et al., 2015; Aronson et al., 2002).
Including social networks in travel behavior research allows three perspectives (Kim et al., 2017; Pike, 2015; Van Den Berg et al., 2013). The #irst perspective is the study of social activities-travel (Moore et al., 2013; Carrasco and Miller, 2006), which starts from the understanding that “individuals travel to socialize and to meet other people”. In the second perspective, an individual’s social network is understood as a social capital resource. Consequently, the more extensive an individual’s social network is, the more transportation resources this individual will have access to (Shin, 2017). In the third one, social networks are a source of in#luence: people tend to behave the same way their social contacts do.
The third perspective allows the study of the transportation mode choice or other related travel choices, as, for example, choosing the place of residence (Li, 2018), departure time (Xiao and Lo, 2016), and shopping location (Han et al., 2011). We use the social in#luence perspective in this study, which was mainly based on the research carried out by Susan Pike (Pike, 2014; Pike, 2015; Pike and Lubell, 2016; Pike and Lubell, 2018) and Maness et al. (2015).
Pike (2015) extensively studied social in#luence on transportation mode choices for university trips in Davis (USA). The main conclusion was the con#irmation of social in#luence on the mode choice, mainly regarding the cycling mode. Wang et al. (2015), Sherwin et al. (2014), and Long et al. (2015) had similar results for cycling, and Morrison and Lawell (2016) for carpooling.
In the study by Maness et al. (2015), a broad review of the literature on social in#luence can be found, from which the “Generalized behavioral conceptual model of social in luence on
transportation choices” is proposed. This model assumes that an individual (n) makes choices
according to a decision rule that depends on evaluating payoffs ( ), in which i is the alternative evaluated. The payoff function is as follows:
= + , , ∗ + + (1)
where : personal characteristics of an individual n for alternative i.
… : social in#luence mechanisms for individual n for alternative i due to
endogenous and contextual factors;
: individual n’s social contacts and the strength of these relationships,
modeled through weighting function (w);
:
the population’s compliance social in#luence sources on individual n for∗ : the population’s conformity social in#luence sources on individual n for alternative i;
: group with all individuals;
: environmental factors on individual n;
: unobserved effects on the individual for alternative i;
, , : model parameters.
Personal characteristics ( ) and environmental factors are inherent to individuals. They are traditionally incorporated into behavioral transportation model choices (Takano, 2018; Silva, 2013). Social aspects are represented by the social mechanism function that relates
social network characteristics ( , compliance , and conformity ∗ social
in#luence. Compliance social in#luence includes advice, commands, and norms that trigger speci#ic behaviors from contextual social factors. Conformity social in#luence occurs via information obtained from social contacts and by observing other people’s behavior.
In the existing literature, several different terms have been used to de#ine compliance and conformity concepts, and they refer to the phenomenon in which individuals tend to mimic other people’s behavior, either to adjust to the social norms in force in the group, to be accepted, or to maintain a positive self-image (Kim et al., 2018; Aronson et al., 2009). Among the terms used are spill-over effect, peer effect, social multiplier, bandwagon effect, imitation, contagion and herd behavior (Kim et al, 2018). In this study, social in#luence is called “conformity” and “compliance”, following the classi#ication found in Maness et al. (2015).
3. METHOD AND DATA
The method we used has two steps: travel and social data collection procedures and analysis procedures. We chose the University of Brasilia to carry out the research due to its convenience and because of the dependence its community has on automobiles and public transportation. The travel mode share of the university is: public transportation 53.1%; automobiles (driving alone) 24.6%; carpooling 11.5%; cycling and walking 7.6%; other modes 3.2% (Mota, 2019). Furthermore, the university is mostly a place of youth (every six months about 4,000 new students enroll in the university), where people in training are acquiring new habits and behaviors, which will be replicated in the future in the students’ professional and family lives.
3.1. Data collec6on
Data were collected through an online survey that was applied to the community of UnB’s Darcy Ribeiro campus. The campus has a population of 53,657 (DPO, 2018), including undergraduate and graduate students, professors, researchers, and employees. The survey was based on Pike (2015), Aruwajoye (2016), Silveira (2013), and on the Campus Travel Survey of the University of California, in Davis (Wei, 2018). More information about the survey can be found in Mota (2019).
Data were collected via a link that directed volunteer respondents to the survey. We sought answers from people from different departments, groups, and pro#iles. Therefore, the link was shared through Facebook in several groups linked to the university. We also publicized the link by randomly handing out pamphlets at strategic places at the university, such as the Central Library, the University Restaurant, and in classroom buildings. For our convenience, the survey
was interrupted when the link reached a total of 955 accesses which resulted in 407 complete answers.
The social data were included in the survey through an egocentric approach (Pike, 2015; Van Den Berg et al., 2013; Haustein et al., 2009; Carrasco et al., 2008; Wasserman and Faust, 2009;). This approach allows the sample collection of an individual’s social network. The individual, called ego, shares information about their social contacts, called alters, and information on their relationships too (Kim et al., 2017).
Seeking to facilitate the respondent’s understanding, we chose to register information on the
alters with whom the ego had interacted in the previous six months, as done by Pike (2015).
Respondents could list #ive alters, at the most, to obtain their core reference group (Pike, 2015; Axhausen, 2008; Mota, 2019). The command was: “For this question, think about all the people who have been part of your social circle in the past six months; this includes people with whom you live, work, attend class, socialize, or participate in activities, etc. or people you speak with on the phone or the Internet. List the #irst names of the #ive contacts you have had the most frequent and regular interaction with over the past six months.” For each alter the ego listed the travel mode for work/study, home location, time, and closeness of the relationship.
3.2. Survey Variables
Following the objective of the analysis, the dependent variable of the model was de#ined as the respondent’s travel mode choice, a categorical variable. The options outlined were cars (driving alone); carpooling (rideshare); public transportation (buses and the subway); and a sustainable mode (walking and cycling).
The independent variables were divided into three groups, which are shown in Table 1. The #irst group consists of the variables that allow assessing social in#luence by conformity and compliance, respectively, the alters’ travel mode choice ( ∗ ), calculated as a percentage, and the agreement with statements that re#lect social norms (compliance) ( ). Other
variables characterize the individual’s social network .
Table 1 – Independent Variables SOCIAL
Alter’s Travel Mode Choice - conformity ( ∗ ) Social Norms - compliance ( )a
Social network Characteristics ( ) (Closeness and time of relationship, ego-alter home distance)
PERSONAL/HOUSEHOLD (xni)
Attitudesa
Preferencesa
Sociodemographic data (Gender, ethnicity, household income, location and type, age, number of adults, child, and cars in the household)
TRAVEL AND BUILT ENVIRONMENT (En)
Urban Density (inhabit./ha)
Mobility Resources available (Carona Phone use and bicycle sharing system use) Travel Time
Travel Distance
a Statements described in Table 2.
The second independent variable group is the personal/household characteristics (xni), and the third group is the travel and built environment characteristics (En). Personal/household characteristics are sociodemographic characteristics, individual attitudes, and preferences. Characteristics of the built environment are external features to the individuals and represent
the spatial and temporal constraints of the urban environment: urban form through urban density; the mobility resources available for the university community, the “Carona Phone” (Taco et al., 2016) ride app and the bicycle sharing system; travel distance and time.
The urban density, travel distance, and vehicle ownership variables were not obtained directly from the survey. The density, measured by the number of inhabitants per hectare (inhabit./ha), was obtained for the Administrative Regions (Jatobá, 2017) and for the cities (IBGE, 2017) that make up Brasilia’s Metropolitan Area (Mota et al., 2014). We also used urban population density in an aggregated way for each region and city. The travel distance between the person’s place of residence and the university was calculated in kilometers. To do this, we used Google Maps and considered the shortest route between the university and the region/city center where ego lives. Vehicle ownership was calculated considering the number of cars and people in each ego’s household (household motorization rate).
3.3. Analysis Procedures
After collecting the data, we started the data analysis. First, we did a sample characterization, an exploratory analysis of social in#luence on the travel mode choice and prepared the database for the modeling. For the exploratory analysis of social in#luence on the travel mode choice, we calculated the average percentage of the alters’ mode choice for each ego’s mode reported. The preparation of the database consisted of the removal of all answers that would not be relevant to the model, either because they did not #it the research’s delimitation or because they had incomplete answers. Answers from 350 respondents (egos) remained, and they shared information about 1,571 alters.
Then, we excluded some of the qualitative variables initially found in the survey answers. This procedure was necessary to avoid the estimation of in#inite parameters, failure in convergence, or complete separation of data during the modeling (Field, 2018; Ortúzar and Willumsen, 2008). This may be due to the concentration of answers in some of the variable categories. On the whole, during the modeling, we observed that these problems did not occur for the variables that presented categories with more than 10% of the respondents. Thus, it was not possible to insert the following variables into the models: “Time it takes to make the trip”, “Safety and Commuting at the time I prefer”, shown in Table 2. It is important to emphasize that all qualitative variables were included in the model as three-level variables (low, medium and high), converted from the Likert scale. Hence, we reduced the concentration of answers on certain categories.
The correlation between quantitative variables was veri#ied in order to detect possible collinearities between them. As expected, a strong correlation (ρ = 0.81, measured by Pearson’s coef#icient) was found between the variables “Distance between the campus and home” and “Travel Time”. For modeling purposes, the distance between the campus and home was chosen rather than the travel time because it presents models with better signi#icance values with regard to social in#luence. In Pike’s research (2015), data are modeled from travel distance because distance is an important variable to de#ine how social in#luence acts, as shown by Pike and Lubell (2018). Furthermore, choosing the distance variable can rule out possible errors that can be brought to the model, since, on average, cars, rides, bikes, and walking modes have similar travel times, but different distances.
Given the qualitative nature of the dependent variable in this research, the multiplicity of explanatory variables, the inferential interest, and the search for the dependency relationship
between the variables, the multinomial logistic regression was selected. As a result, there is an alignment between this study and the research developed by Ji et al. (2018), Heinen (2016), Pike (2015), Takano (2010), among others.
3.3.1. Model and hypotheses
We created three multinomial logit models, which were linked to three hypotheses:
• Model 1: we veri#ied the hypotheses “there is social in#luence on the travel mode choice for the Brazilian context”. We created a base model of travel mode choices under social in#luence using the entire database.
• Model 2: we veri#ied the hypotheses “social in#luence on the travel mode choice is not dependent on the social in#luence within the ego's home”. We created a travel mode choice model for egos-alters from different households, which only considered the social contacts that do not live in the same household as the respondent’s (Pike and Lubell, 2016). “Excluding household members minimizes the overlap of and similarities in the choice environments of each ego and their social contact” (Pike and Lubell, 2016).
• Model 3: we veri#ied the hypotheses “closeness of the ego-alter relationship affects the social in#luence dimension on the travel mode choice”. We created a travel mode choice and social in#luence model by weighing the ego’s network data by social link strength. We expect that the closest social contacts will have a greater in#luence on the travel mode choice.
4. RESULTS
4.1. Sample Characteriza6on and Exploratory Analysis
Among the 407 respondents (called egos), 334 (82%) were undergraduate students, 56 (14%) graduate students, 4 (1%) professors/researchers, 13 (3%) administrative and other technical staff. Their gender and ethnicity are detailed in (Mota, 2019) and were compatible with other studies done on campus (DPO, 2018; Aruwajoye, 2016; Silveira, 2013). A predominantly young sample was obtained (the mean was 23.6 years of age) and the average per capita monthly family income was R$ 2,298.77.
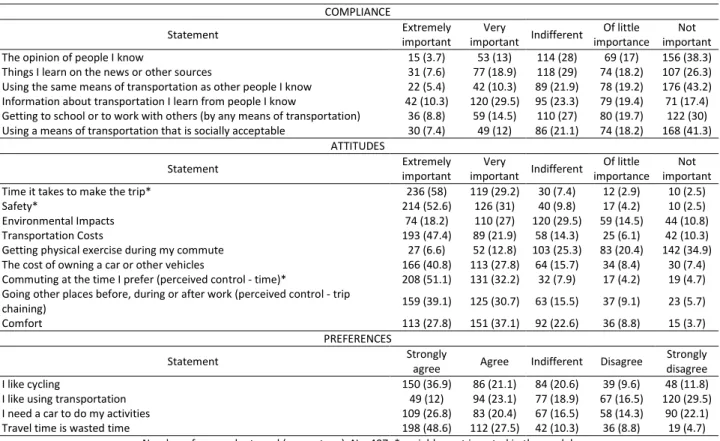
Regarding the mobility resources available on campus, we discovered that 31% of the sample had already used the shared bike system. The “Carona Phone”, a ride app, was used by 4% of those in the sample, but the app was unknown to 51% of the respondents. Concerning the attitude and preference indicators, shown in Table 2, it became clear that, in general, the respondents consider travel times, safety and perceived control (the independence to commute whenever they want to) to be extremely/very important. Perceived control is linked to individual transportation, bicycle users and pedestrians. As for preference, we found out that the sample agrees with the statement “travel time is wasted time”, with a high willingness to ride a bicycle and a low willingness to use public transportation.
For the exploratory analysis of social in#luence on the choice of the travel mode, we obtained Table 3. We discovered that ego users of sustainable modes are those with the highest proportion of social contacts (alters) who use sustainable modes.
Table 2 – Frequency of answers to Compliance, Attitudes, and Preferences COMPLIANCE Statement Extremely important Very important Indifferent Of little importance Not important The opinion of people I know 15 (3.7) 53 (13) 114 (28) 69 (17) 156 (38.3) Things I learn on the news or other sources 31 (7.6) 77 (18.9) 118 (29) 74 (18.2) 107 (26.3) Using the same means of transportation as other people I know 22 (5.4) 42 (10.3) 89 (21.9) 78 (19.2) 176 (43.2) Information about transportation I learn from people I know 42 (10.3) 120 (29.5) 95 (23.3) 79 (19.4) 71 (17.4) Getting to school or to work with others (by any means of transportation) 36 (8.8) 59 (14.5) 110 (27) 80 (19.7) 122 (30) Using a means of transportation that is socially acceptable 30 (7.4) 49 (12) 86 (21.1) 74 (18.2) 168 (41.3)
ATTITUDES Statement Extremely important Very important Indifferent Of little importance Not important Time it takes to make the trip* 236 (58) 119 (29.2) 30 (7.4) 12 (2.9) 10 (2.5)
Safety* 214 (52.6) 126 (31) 40 (9.8) 17 (4.2) 10 (2.5)
Environmental Impacts 74 (18.2) 110 (27) 120 (29.5) 59 (14.5) 44 (10.8) Transportation Costs 193 (47.4) 89 (21.9) 58 (14.3) 25 (6.1) 42 (10.3) Getting physical exercise during my commute 27 (6.6) 52 (12.8) 103 (25.3) 83 (20.4) 142 (34.9) The cost of owning a car or other vehicles 166 (40.8) 113 (27.8) 64 (15.7) 34 (8.4) 30 (7.4) Commuting at the time I prefer (perceived control - time)* 208 (51.1) 131 (32.2) 32 (7.9) 17 (4.2) 19 (4.7) Going other places before, during or after work (perceived control - trip
chaining) 159 (39.1) 125 (30.7) 63 (15.5) 37 (9.1) 23 (5.7)
Comfort 113 (27.8) 151 (37.1) 92 (22.6) 36 (8.8) 15 (3.7)
PREFERENCES
Statement Strongly
agree Agree Indifferent Disagree
Strongly disagree
I like cycling 150 (36.9) 86 (21.1) 84 (20.6) 39 (9.6) 48 (11.8)
I like using transportation 49 (12) 94 (23.1) 77 (18.9) 67 (16.5) 120 (29.5) I need a car to do my activities 109 (26.8) 83 (20.4) 67 (16.5) 58 (14.3) 90 (22.1) Travel time is wasted time 198 (48.6) 112 (27.5) 42 (10.3) 36 (8.8) 19 (4.7)
Number of respondents and (percentage); N = 407; * variables not inserted in the model
Table 3 – Exploratory analysis of conformity social influence Ego’s Mode Choice
Average Percentage of Alters’ Mode Choice Carpooling Driving alone Sustainable Public
transportation Carpooling (N=40) 30% 26% 3% 39% Driving alone (N=91) 16% 49% 4% 28% Sustainable (N=27) 4% 35% 27% 32% Public transportation (N=192) 10% 27% 2% 57%
4.2. Modeling
Model 1 consists of the base modeling and was designed to verify the existence or not of social in#luence on the transportation mode choice in the sample. To do this, after the database preparation procedures, all respondents’ answers were considered, with a sample of 350 egos (respondents) and 1,571 alters (respondents’ social contacts).
The dependent variable was the travel mode choice, with the alternatives: carpooling, sustainable mode (bikes and walking), public transportation and individual cars, which was used as a basis for comparison. It is worth mentioning that the stepwise-forward criterion for selecting variables was used in the modeling through the “Likelihood Ratio” statistic. Hence, it was possible to obtain the model presented in Table 4, which best suited (Field, 2018) the data collected.
Table 4 also shows Model 2. Model 3 was not signi#icant for social in#luence and, therefore, it is not presented here. Additional information about the models can be found in Mota (2019). Regarding social in#luence, in Model 1, we found out that at a signi#icance level of up to 0.05, social in#luence by conformity in the sustainable mode value = 0.041) and in carpooling
(p-value = 0.036) was signi#icant (Table 4). The variables of social in#luence measurement by compliance were not selected in the stepwise-forward procedure. The variable social in#luence by conformity for public transportation and individual automobile did not improve the likelihood ratio of the model, so it was not considered.
Table 4 – Frequency of answers to Compliance, Attitudes, and Preferences
Variables
Model Parameters (B)a
Model 1 (N=350) Model 2 (N=340) Carpooling Sustainable Public
transportation Carpooling Sustainable
Public transportation
Intercept 3.826** 0.428 3.484*** 3.252* 4.532* 3.642**
Proportion of alters users of sustainable modes (%) 0.008 0.056** -0.019 0.638 3.691 -3.063
Proportion of alters users of carpooling (%) 0.024** -0.056** -0.017 2.526** -5.977* -2.241*
Household motorization rate (car/person) -2.587*** -7.061*** -5.445*** -2.418*** -7.692*** -5.135***
Travel distance (km) -0.011 -0.181** 0.064** -0.012 -0.181** 0.065**
Urban pop. density (inhabit./ha) 0.013** 0.022* 0.013** 0.013** 0.021* 0.014**
Age (years) -0.194*** 0.003 -0.101*** -0.186*** -0.007 -0.1***
Shared bicycle system
already used never usedb 0.227 2.466** 0.483 - - - Comfort not important 2.717 ** 1.879 2.721** 2.925** 3.236* 3.131** moderately importante 0.084 -0.215 1.42** 0.333 0.342 1.726** very importantb
Needing the car for daily activities
not important 1.847
*** 3.86*** 2.874*** 1.755** 3.094*** 2.694***
moderately important 1.078 2.649* 1.368** 1.182 1.753 1.576**
very importantb
Public transportation costs
not important -1.461
** -3.445 -3.766*** -1.482** -3.945** -3.617***
moderately important 0.228 0.548 -0.572 0.225 0.169 -0.401
very importantb
Doing physical exercises during travel
not important - - - 0.236 -3.17
*** -1.011
moderately important - - - 0.217 -1.823* -0.454
very importantb
a. Base alternative is an automobile (driving alone) b. Base range
*, ** and *** respectively mean a significance level of 0.100; 0.050 and 0.010 Log likelihood*(-2): 354.037 Qui-squared: 433.576 p-value 0.000 McFadden: 0.550 Log likelihood *(-2): 337.311 Qui-squared: 424.674 p-value 0.000 McFadden: 0.557
5. ANALYSIS OF RESULTS
5.1. Model 1
From Model 1 (Table 4), it can be stated that an ego, who has a higher percentage of alters using a sustainable mode, is more likely to use a sustainable mode than an individual automobile (B > 0). Considering that the proportion of contacts that chose a certain mode was given as a percentage and keeping the other variables constant, it can be said, from Equation 2 obtained from Model 1, that: a variation of 10 percentage points in the number of alters that use a sustainable mode increases the chance of an ego using a sustainable mode and not using their own car by 76%.
= 0,0203e!,!"#$% (2)
where : odds ratio of sustainable mode choice (s) over individual
automobiles (a);
&': proportion of alters that use sustainable modes (%).
Evidence of the existence of conformity social in#luence on the travel mode choice at the University of Brasilia was like Pike’s (2015) #indings at the University of California highlighting the use of bicycles. Other studies have found congruous results: Wang et al. (2015) used a spatial probit model to assess the social in#luence on bicycle use in a university community in the United States, concluding that “the more cyclists there are, the more people will become cyclists”. Cyclists’ social in#luence was demonstrated by Sherwin et al. (2014) through qualitative research in England and by Long et al. (2015) in New Zealand.
As regards carpooling, we found an increase in the probability of carpooling (B > 0) in relation to the use of individual cars when the number of alters who carpool increases. Considering that the proportion of social contacts that choose a mode was given as a percentage and keeping the other variables constant, it can be said, from Equation 3 obtained from Model 1, that: a variation of 10 percentage points in the number of alters who carpool increases the probability of an ego carpooling by 27% over the use of individual cars.
( = 0,0293e!,!*$!%( (3)
where (: odds ratio of the carpooling mode choice (s) over individual
automobiles (a);
&+: proportion of alters that carpool (%).
Carpooling was not a research object for Pike (2015), but it was considered by other authors. Morrison and Lawell (2016) demonstrated social in#luence by conformity in the decision of carpooling for military work trips. The main conclusion reached by the authors was that a 10% increase in the number of colleagues who carpool increases by 5.14% the probability of an ego carpooling. We observed that the in#luence measured by the authors was lower than the proportion of 10% to 27% found in the community sample of the University of Brasilia. This may be evidence of a higher tendency of the researched student groups to carpool by social in#luence since they are younger than the ones in the Morrison and Lawell (2016) sample. Other variables included in the model that, along with social in#luence, were signi#icant are Household Motorization Rate, Urban Density, Age, Travel Distance, Shared Bike System Use and Behavioral Variables. We discovered that choosing to carpool was related to lower importance given to comfort, lower household motorization rates, and higher urban densities. These results can be related to research done by Kowal et al. (2013), which demonstrates that places where car use is lower and regions with higher density positively in#luence the number of social contacts that an individual has. Since the individual has a wider network of contacts, they will have more access to transportation resources such as rideshare (Shin, 2017). This phenomenon does not consist of social in#luence but can be explained by the social capital aspect. Higher urban population densities may also be related to the shorter distances and travel time individuals need to deviate from their route to give a passenger a ride, or for the passenger to get to a driver. These are key issues for the success of carpooling (Silveira, 2013; Silveira et al. 2014).
Regarding public transportation, we found out that families with lower motorization rates, households located in denser areas, younger people, who attribute low importance to comfort, who report having little need for a car to carry out their activities, and who give great importance to the cost of public transportation, were more likely to use public transportation than cars. These results are in line with the research done by Feitosa (2018), who researched the conscious and unconscious motivations for the use of individual transportation modes.
5.2. Model 2
Model 2 was designed to verify whether social in#luence on the travel mode choice is not dependent on the social in#luence within the ego's home. This analysis was performed by Pike and Lubell (2016). To this end, we excluded 10 respondents from the database, the ones who had reported all contacts living in the same household, leaving 340 egos. We also excluded alters living in the same household as the respondent’s, leaving us with information on 1,024 alters. By removing such social contacts, the proportion of alters who used each mode was recalculated for each ego.
As seen in Table 4, we observed that when contacts from the same household are excluded, the proportion of carpooling contacts remains a signi#icant variable in the model at a level of 0.05. We may conclude that by increasing the percentage of social contacts who carpool, the likelihood of the ego carpooling rather than using their own car increases. Based on this, it can be said that social in#luence is different from social household in#luence, and exists between individuals from different households, which is similar to Pike and Lubell’s (2016) #indings. The proportion of contacts who use sustainable modes was not signi#icant (p-value > 0.05). This may have been caused by the decrease in the number of individuals in the database since the number of users of sustainable means was already restricted. It is important to mention that for Model 2, to obtain the best #it for the data, the variable “importance of exercising” was selected during the stepwise-forward method and the variable “shared bicycle use” was not selected.
5.3. Model 3
Model 3 was built to verify whether the strength of the ego-alter link (or closeness of the relationship) impacts the social in#luence dimension on the travel mode choice by evaluating the weight (w) of the function created by Maness et al. (2015). We tried to observe if people who are closer have greater social in#luence by conformity. Closeness of the relationship, obtained by using the egocentric approach, was classi#ied into #ive levels ranging from very close to not close. Thus, social conformity, represented by the percentage of alters using each mode, was calculated using the weighting factor (w) given by the strength of the ego-alter link. We expect that the closest social contacts will have greater in#luence on the travel mode choice. In the model, it would be represented by the change in the model coef#icients.
We found out that there was no signi#icant change in the model. There was no variation in the model coef#icient B for carpooling. For sustainable modes, despite the change in coef#icient B, Model 3 had signi#icance greater than 0.05 (p-value = 0.068). Therefore, the statement that link strength interferes with the social in#luence was inconclusive, which is why the parameters were not presented in Table 4.
Since the sample for this research was restricted, we recommend that future work should focus on researching the interference of social link strength on social in#luence. We also suggest that model comparisons be made from sample strati#ication, in which alters and egos with a closer relationship are considered in comparison with alters and egos with a weaker relationship.
5.4. Policy Implica6ons
the so-called Reference Marketing, a term used in business to refer to the advertising of a product or service made by clients based on their own experiences with the product/service. Purchasing products can be analogous to the assimilation of behaviors, such as choosing a travel mode.
Thus, within the scope of mobility policies, one can think about the creation of tools that encourage an individual to share his “mobility experiences” in active and shared travel modes with his social contacts - such as cycling, walking and carpooling - precisely those that presented an inclination to social in#luence in this research. Sharing these experiences can be enhanced by using social media platforms such as Facebook, Twitter, and Instagram. An example is the event called “May is Bike Month”, mentioned by Pike (2015). The campaign used to increase bicycle commuting uses social tools such as “challenge a friend” and “share your accomplishments” to prompt friendly competition among participants as they log bike travel distances during the event.
Another mechanism may be giving discounts or prizes to individuals who purchase public transportation tickets jointly with others. Prizes and discounts can also be given to those who advertise to their social contacts the use of mobility resources such as ride apps, bike-sharing, and scooters.
As for the use of bicycles, considering that it was associated with shorter travel distances, government of#icials can invest in policies that promote their integration with other modes such as the subway and buses (Paiva, 2013). Such use can be further enhanced by seeking to invest in higher-density areas.
With regard to carpooling, one can think of promoting them to seek a more rational way of using vehicles (Silveira et al. 2014). Rideshare can be used for the whole trip, or also for accessing mass transportation points. However, to achieve this, it is necessary to think about the construction of parking lots at bus or subway access areas, thus reducing the number of vehicles circulating in the urban environment.
As for public transportation, the main result is the need to improve passenger comfort during their journeys. We also discovered that places with higher density increase the probability of people using it. Therefore, it is important to promote mobility policies jointly with urban planning ones.
Finally, it is important to create policies according to people’s ages and lifecycle stages. This idea is linked to the Target Marketing concept, which can be applied to travel behavior (He et
al., 2016). As it is generally shown, younger people, who have no children and live with their
parents, are more prone to carpooling, so it is necessary to create policies for young people, through universities and schools. On the other hand, older people already have the habit of using individual cars and have more restrictions, be them family- or work-related. So, speci#ic policies for this target audience should be sought, such as corporate carpooling programs, which can be incentive instruments in companies by the government.
6. CONCLUSIONS
The main conclusion of this research is that the proposed objective was achieved. The behavioral model that adjusted to the data collected at UnB’s Darcy Ribeiro campus was de#ined and the existence of social in#luence on the travel mode choice when considering sustainable modes and carpooling was veri#ied. There was no evidence of social in#luence on the use of cars and public transportation.
As for Models 2 and 3, we found out that social in#luence and social household in#luence are different. Due to the constraints of the research sample, it was not possible to verify if greater proximity in social relationships (close friends, people with strong emotional connections, among others) are associated with greater social in#luence.
Future papers will require a more extensive data collection, with greater participation of people using sustainable modes and carpooling. From a larger sample, the following research is recommended: to analyze social in#luence strati#ied by gender; to model social in#luence as a function of the travel distance, to limit the pro#iles of people who are more susceptible to social in#luence, according to their place of residence, as done by Pike and Lubell (2018); to verify the changes caused in the social in#luence due to the strength of the ego-alter link; to include other social norms (Krueger et al., 2018), attitude and preference indicators; to consider possible endogeneities associated with discrete choice models that include social in#luence (Pike and Lubell, 2018; Maness et al., 2015).
We recommend that other social data collection approaches be used rather than the egocentric one. By doing that, it will be possible to research social in#luence on travel mode choices by evaluating speci#ic groups of people similar to what was done by Morrison and Lawell (2016), Kormos et al. (2015), or Sunitiyoso et al. (2011). This is the starting point for assessing social in#luence through dense networks or small-world networks.
Despite the limitations, the results obtained are considered satisfactory, as they have the potential to subsidize the creation of public policies for urban mobility. By considering social perspectives, a new dimension is added to the classic research on travel mode choices, which allows a greater understanding of the phenomenon of how people travel in urban areas, to guide urban mobility policies for more sustainable mobility.
ACKNOWLEDGEMENTS
The authors are grateful to the Research Group of Travel Behavior and New Technologies (CTNT) of the Postgraduate Program of Transportation of the Department of Civil and Environmental Engineering - University of Brasilia.
REFERENCES
Aronson, E.; T. D. Wilson and R. M. Akert (2009) Social Psychology (7th Edition). USA: Prentice Hall, Inc.
Aruwajoye, A. O. (2016) Previsão de Demanda de Transportes no Campus Darcy Ribeiro da Universidade de Brasília. Monogra#ia de Projeto Final de Graduação. Brası́lia: Departamento de Engenharia Civil e Ambiental, Universidade de Brası́lia. Brası́lia-DF 95p, http://bdm.unb.br/handle/10483/18417
Axhausen, K. W. (2008) Social networks, mobility biographies, and travel: Survey challenges. Environment and Planning B:
Planning and Design, p. 981-996. DOI: 10.1068/b3316t.
Carrasco, J. A. and E. J. Miller (2006) Exploring the propensity to perform social activities: A social network approach.
Transportation. v. 33. p. 463-480. DOI: 10.1007/s11116-006-8074-z.
Carrasco, J. A. and E. J. Miller (2009) The social dimension in action: A multilevel, personal networks model of social activity frequency between individuals. Transportation Research Part A: Policy and Practice. v. 43. p. 90-104. DOI:
10.1016/j.tra.2008.06.006.
Carrasco, J. A.; B. Hogan; B. Wellman and E. J. Miller (2008) Collecting social network data to study social activity-travel behavior: An egocentric approach. Environment and Planning B: Planning and Design. v.: 35. p 961-980. DOI: 10.1068/b3317t.
DPO - Decanato de Planejamento e Orçamento. (2018) Anuário Estatístico da UnB 2018, período: 2013 a 2018. Brası́lia. Dubernet, T. and K. W. Axhausen (2015) Implementing a household joint activity-travel multi-agent simulation tool: #irst
results. Transportation. v. 42. p. 753-769. DOI: 10.1007/s11116-015-9645-7.
Feitosa, Z. O. (2018) Modelo conceitual das Motivações Conscientes e Não Conscientes do comportamento de uso do automóvel
com base na Teoria do Comportamento Planejado-TCP. Tese de Doutorado. Departamento de Engenharia Civil e Ambiental.
Universidade de Brası́lia. Brası́lia-DF. 192 p. HYPERLINK: repositorio.unb.br/handle/10482/32200
Feygin, S. and A. Pozdnoukhov (2018) Peer pressure enables actuation of mobility lifestyles. Transportation Research Part C:
Emerging Technologies. v. 87. p 26-45. DOI: 10.1016/j.trc.2017.12.008.
Hackney, J. and F. Marchal, (2011) A coupled multi-agent microsimulation of social interactions and transportation behavior.
Transportation Research Part A: Policy and Practice. v.45. p. 296-309. DOI: 10.1016/j.tra.2011.01.009.
Han, Q.; T. Arentze; H. Timmermans; D. Janssens and G. Wets (2011) The effects of social networks on choice set dynamics: Results of numerical simulations using an agent-based approach. Transportation Research Part A: Policy and Practice. v. 45 p. 310-322. DOI: 10.1016/j.tra.2011.01.008.
Haustein, S.; C. A. Klöckner and A. Blöbaum, (2009) Car use of young adults: The role of travel socialization. Transportation
Research Part F: Traf ic Psychology and Behaviour. v. 2. p 91-114. DOI: 10.1016/j.trf.2008.10.003.
Heinen, E. (2016) Identity and travel behavior: A cross-sectional study on commute mode choice and intention to change.
Transportation Research Part F: Traf ic Psychology and Behaviour. v. 43. p. 238-253. DOI: 10.1016/j.trf.2016.10.016.
IBGE. (2017) Portal do Instituto Brasileiro de Geogra ia e Estatística. Acesso em 17 de dezembro de 2018, disponı́vel em Cidades IBGE: https://cidades.ibge.gov.br/
Jatobá, S. U. (2017) Densidades Urbanas nas Regiões Administrativas do Distrito Federal. Fonte: Companhia de Planejamento do Distrito Federal (CODEPLAN):
http://www.codeplan.df.gov.br/wp-content/uploads/2018/02/TD_22_Densidades_Urbanas_nas_Regi%C3%B5es_Administrativas_DF.pdf
Ji, Y.; Y. Liu; Q. Liu; B. He and Y. Cao (2018) How Household Roles In#luence Individuals’ Travel Mode Choice under Intra-household Interactions? KSCE Journal of Civil Engineering, v. 22. p. 4635–4644. DOI: 10.1007/s12205-018-1821-9. Kim, J.; S. Rasouli and H. J. P. Timmermans (2018) Social networks, social in#luence and activity-travel behavior: a review of
models and empirical evidence. Transport Reviews. p. 499-525. DOI: 10.1080/01441647.2017.1351500.
Kim, J.; S. Rasouli and H. J. P. Timmermans (2017) Investigating heterogeneity in social in#luence by social distance in car-sharing decisions under uncertainty: A regret-minimizing hybrid choice model framework based on sequential stated adaptation experiments. Transportation Research Part C: Emerging Technologies. v. 85. p. 47-63. DOI:
10.1016/j.trc.2017.09.001.
Kormos, C.; R. Gifford and E. Brown (2015) The In#luence of Descriptive Social Norm Information on Sustainable Transportation Behavior: A Field Experiment. Environment and Behavior. v. 47. p. 479-501. DOI:
10.1177/0013916513520416.
Kowald, M.; P. Van Den Berg; A. Frei; J. A. Carrasco; T. Arentze; K. Axhausen; H. J. P. Timmermans and B. Wellman (2013) Distance patterns of personal networks in four countries: A comparative study. Journal of Transport Geography. v. 31. p. 236-248. DOI: 10.1016/j.jtrangeo.2013.06.006.
Krueger, R.; A. Vij and T. H. Rashidi (2018) Normative beliefs and modality styles: a latent class and latent variable model of travel behavior. Transportation. v. 45. p. 789-852. DOI: 10.1007/s11116-016-9751-1.
Li, J. (2018) Residential and transit decisions: Insights from focus groups of neighborhoods around transit stations. Transport
Policy. v. 63. p. 1-9. DOI: 10.1016/j.tranpol.2017.10.012.
Lin, T.; D. Wang and M. Zhou (2018) Residential relocation and changes in travel behavior: what is the role of social context change? Transportation Research Part A: Policy and Practice. v. 111. p. 360-374. DOI: 10.1016/j.tra.2018.03.015. Long, J.; N. Harré and Q. D. Atkinson (2015) Social clustering in high school transportation choices. Journal of Environmental
Psychology, v. 41. p. 155-165. DOI: 10.1016/j.jenvp.2015.01.001.
Maness, M.; C. Cirillo and E. R. Dugundji (2015) Generalized behavioral framework for choice models of social in#luence: Behavioral and data concerns in travel behavior. Journal of Transport Geography. v. 46. p. 137-150. DOI:
10.1016/j.jtrangeo.2015.06.005.
Marek, E. M. (2018) Social learning under the labelling effect: Exploring travellers’ behaviour in social dilemmas.
Transportation Research Part F: Traf ic Psychology and Behaviour. v. 58. p. 511-527. DOI: 10.1016/j.trf.2018.06.015.
Moore, J.; J. A. Carrasco and A. Tudela (2013) Exploring the links between personal networks, time use, and the spatial distribution of social contacts. Transportation. p. 773-788. DOI: 10.1007/s11116-013-9467-4.
Morrison, G. M. and C. L. Lawell (2016) Driving in force: The in#luence of workplace peers on commuting decisions on U.S. military bases. Journal of Economic Behavior and Organization. v. 125. p. 22-40. DOI: 10.1016/j.jebo.2016.01.010. Mota, D. R. (2019) Modelagem Comportamental da in luência social na escolha do modo de viagem. Dissertação de Mestrado.
Universidade de Brası́lia. 154p. http://repositorio.unb.br/handle/10482/35284
Mota, D. R.; M. S. M. Takano and P. W. G. Taco (2014) A Method Using GIS Integrated Voronoi Diagrams for Commuter Rail Station Identi#ication: A Case Study from Brasilia (Brazil). Procedia Social and Behavioral Sciences. v. 162. p. 477-486. DOI: 10.1016/j.sbspro.2014.12.229.
Okushima, M. (2015) Simulating social in#luences on sustainable mobility shifts for heterogeneous agents. Transportation. v. 42. p. 8827-855. DOI: 10.1007/s11116-015-9649-3.
Ortúzar, J. D. and L. Willumsen (2008) Modelos de Transporte. PUbliCan, Ediciones de la Universidad de Cantabria. Santander. Paiva, M. (2013) Fatores que in luenciam no uso da bicicleta de forma integrada com o metrô. Tese de Doutorado.
Departamento de Engenharia Civil e Ambiental, Universidade de Brası́lia. Brası́lia-DF. 206.
Pike, S. C. (2014) Travel Mode Choice and Social and Spatial Reference Groups. Transportation Research Record: Journal of the
Transportation Research Board. v. 2412. DOI: 10.3141/2412-09.
Pike, S. C. (2015) Social Networks and Travel Behavior: An Investigation into the Role of Social In luence in the Transportation
Mode Choices of Students. Research Report. Davis: Institute of Transportation Studies, University of California. Davis. 87p.
Pike, S. C. and M. Lubell (2016) Geography and social networks in transportation mode choice. Journal of Transport
Pike, S. C. and M. Lubell (2018) The conditional effects of social in#luence in transportation mode choice. Research in
Transportation Economics. v. 68. p 2-10. DOI: 10.1016/j.retrec.2018.05.010.
Ronald, N. A.; T. A. Arentze; and H. Timmermans (2012) Modeling social interactions between individuals for joint activity scheduling. Transportation Research Part B: Methodological. v. 46. p. 276-290. DOI: 10.1016/j.trb.2011.10.003. Sherwin, H.; K. Chatterjee and J. Jain (2014) An exploration of the importance of social in#luence on the decision to start
bicycling in England. Transportation Research Part A Policy and Practice. v. 68. p. 32-45. DOI: 10.1016/j.tra.2014.05.001. Shin, E. J. (2017) Ethnic neighborhoods, social networks, and inter-household carpooling: A comparison across ethnic
minority groups. Journal of Transport Geography. v. 59. p. 14-26. DOI: 10.1016/j.jtrangeo.2017.01.002.
Silva, A. H. (2013) In luência do estilo de vida nas escolhas de transporte: uma análise de classes latentes. Tese de Dourado. Departamento de Engenharia Civil e Ambiental. Universidade de Brası́lia. Brası́lia. 216p.
http://repositorio.unb.br/handle/10482/14489
Silveira, A. F. (2013) Rumo à Mobilidade Sustentável no Campus da UnB: Carona Solidária. Monogra#ia de Projeto Final de Graduação. Brası́lia: Departamento de Engenharia Civil e Ambiental, Universidade de Brası́lia. 77p.
Silveira, A. F.; P. W. G. Taco and Seabra, L. O. (2014) Uso compartilhado do automóvel: uma análise comportamental dos
frequentadores dos Campi da Universidade de Brasília - Brasil. In: Anais do 6º Congresso Luso-Brasileiro para Planeamento
Urbano, Regional, Integrado e Sustentável - PLURIS, Lisboa, p. 1198-1209.
Sunitiyoso, Y.; E. Avineri and K. Chatterjee (2011) The effect of social interactions on travel behavior: An exploratory study using a laboratory experiment. Transportation Research Part A: Policy and Practice v. 45. p. 332-344. DOI:
10.1016/j.tra.2011.01.005.
Taco, P. W. G.; M. B. Silva; H. M. Faria; P. V. Medeiros; B. A. Macêdo and L. M. Taco (2016) O empreendedorismo na Mobilidade Urbana Sustentável: o Carona Phone. Anais do XXX Congresso Nacional de Pesquisa em Transportes da ANPET. Rio de Janeiro.
Takano, M. S. M. (2018) Metodologia para análise dos efeitos dos Estágios no Ciclo de Vida no Comportamento de Viagem. Departamento de Engenharia Civil e Ambiental, Universidade de Brası́lia. Tese de Doutorado. Departamento de Engenharia Civil e Ambiental, Universidade de Brası́lia. Brası́lia. 128p. http://repositorio.unb.br/handle/10482/34217 Takano, M. S. M. (2010) Análise da In#luência da Forma Urbana do Comportamento de Viagens Encadeadas com base em
padrões de atividades. Dissertação de Mestrado. Departamento de Engenharia Civil e Ambiental. Universidade de Brası́lia. 2019p. http://repositorio.unb.br/handle/10482/6960
Van Den Berg, P.; T. Arentze and H. Timmermans (2013) A path analysis of social networks, telecommunication and social activity-travel patterns. Transportation Research Part C: Emerging Technologies. v. 26. p 256-268. DOI:
10.1016/j.trc.2012.10.002.
Vinayak, P.; F. F. Dias; S. Astroza; C. R. Bhat; R. M. Pendyala and V. M. Garikapati (2018) Accepted Manuscript Accounting for multi-dimensional dependencies among decision-makers within a generalized model framework: An application to understanding shared mobility service usage levels. Transport Policy. 8p. DOI: 10.1016/j.tranpol.2018.09.013. Wang, C.; G. Akar and J. M. Guldmann (2015) Do your neighbors affect your bicycling choice? A spatial probit model for
bicycling to The Ohio State University. Journal of Transport Geography. v. 42. 122-130. DOI: 10.1016/j.jtrangeo.2014.12.003.
Wasserman, S. and K. Faust (2009) Social Network Analysis: Methods and Applications (19 ed.). Cambridge University Press. Nova York.
Wei, A. (2018) Results of the 2017-18 Campus Travel Survey. Research Report. Institute of Transportation Studies. University of California. Davis:
Xiao, Y. and H. K. Lo (2016) Day-to-day departure time modeling under social network in#luence. Transportation Research Part