Department of Economics
The Effects of International Trade on Economic Growth: An empirical
comparison between Portugal and the Netherlands
António Jorge Soares Jesus Antunes
A Dissertation presented in partial fulfillment of the Requirements for the Degree of Master in Economics.
Supervisor:
Ph.D. Sofia de Sousa Vale; Assistant Professor, Department of Economics, ISCTE-IUL
The Effe cts o f In terna ti on al T rad e on E co no m ic Gr owt h : An e m piri cal co m pari so n b et w ee n P or tug al an d t he N et herlan ds An tó nio J org e So are s Jesus An tun es Sep te m b er,2 0 1 2
i
According to growth theory, trade flows are an important determinant of a country growth rate since they allow technological progress, which is a crucial factor in productivity and competiveness gains, fostering both economic performance and growth. The main goal of this Dissertation is to study the impact that international trade had on the economic growth of Portugal and the Netherlands in the period 1970-2010. Although both economies are small open economies the result registered is distinct. For Portugal both exports and imports play a significant role, as for the Netherlands only exports show a positive effect on GDP.
Keywords: Economic Growth, International Trade, Portugal, the Netherlands, Time Series.
JEL Classification: F43, C32, O49
Resumo
De acordo com a teoria do crescimento económico o comércio internacional desempenha um papel determinante na taxa de crescimento económico de cada país, porque permite a difusão de progresso tecnológico levando a ganhos de produtividade e competitividade, que por sua vez promovem tanto o desempenho económico como o crescimento económico. O propósito desta Dissertação é estudar o impacto do comércio internacional de Portugal e da Holanda sobre o seu crescimento económico entre 1970 e 2010. Apesar de ambas economias serem pequenas economias abertas o resultado obtido é diferente. Para Portugal tanto as exportações como as importações têm um papel crucial, já no caso da Holanda apenas as exportações mostram um impacto positivo sobre o PIB.
Palavras-Chave: Crescimento Económico, Comércio Internacional, Portugal, Holanda, Séries Temporais.
ii
Resumo alargado da Dissertação
Esta dissertação estuda o relacionamento entre o comércio internacional e o crescimento económico, fazendo uma comparação empírica entre Portugal e Holanda para o período 1970-2010.
O comércio internacional tem vindo a ter um papel mais preponderante na explicação do crescimento económico, isto porque possibilita uma maior e mais rápida acumulação e difusão de tecnologia entre economias. De salientar que, segundo as teorias do crescimento económico, o progresso tecnológico é um dos principais factores de crescimento. Devido a esta crescente importância alguns autores começaram a considerar a troca como factor explicativo do crescimento, caso de Grossman & Helpman (1991) e Dinopoulos & Segerstrom (2006).
Para pequenas economias abertas, como Portugal e Holanda, que não são pioneiras em avanços tecnológicos, o comércio internacional torna-se o principal canal de transmissão do progresso tecnológico, tal progresso leva a ganhos de produtividade e competitividade que por sua vez levam a um maior desempenho e crescimento económico.
No final dos anos 70 até meados dos anos 80 a economia portuguesa enfrentava um grande desafio, tinha acabado de vir de uma revolução que levou à troca de regime governativo, que trouxe profundas mudanças económico-sociais, e tinha estado sob tutela de dois pacotes de resgate por parte do Fundo Monetário Internacional (FMI) devido a diferentes factores, principalmente despoletados pelas duas crises petrolíferas. Porém com a entrada na Comunidade Económica Europeia (CEE), em 1986, Portugal passou por um período de expansão económica que durou até meados dos anos 90 e registou uma convergência para com os padrões europeus, tanto económicos como sociais, muito por força de um processo de terceirização da economia ocorrida nesse período. Contudo, após a entrada no Euro a economia portuguesa estagnou e assistiu a fortes quebras quer na produtividade quer na competitividade. Com a mais recente crise económica este fraco desempenho da economia portuguesa, aliado ao excessivo endividamento registado na última década,
iii Europeu e União Europeia tendo como objectivos primordiais a consolidação das finanças públicas e a implementação de reformas estruturais, de forma a promover a produtividade e a competitividade.
Em relação ao comércio internacional a estrutura das exportações de bens e serviços e das importações de bens e serviços portuguesas sofreu uma modificação significativa em relação àquela que se registava no início do período, por causa da (a) alteração da especialização produtiva dentro da indústria e terciarização acentuada da economia e (b) da crescente pressão competitiva imposta pelas economias emergentes, especializadas nos mesmo tipo de bens que a economia portuguesa mas com preços mais competitivos. Portugal começou, assim, a exportar e a importar bens com uma intensidade tecnológica superior. Os principais produtos exportados passaram de Produtos Alimentares e Vestuário e Calçado para produtos intermédios como Veículos e Materiais de Transporte. No caso das importações, Maquinaria e Aparelhos Mecânicos e Veículos e Materiais de Transporte tornaram-se dos bens mais importados. No caso dos serviços não houve grandes alterações, o Turismo continua a ser o bem mais procurado por estrangeiros, já Transportes e Comunicações são dos principais serviços importados. Em termos de mercado, com a integração económica Portugal focou-se muito para o mercado europeu tanto para exportação como para importação, por esta razão Espanha tornou-se o principal parceiro económico de Portugal.
Em relação à economia holandesa, no início do período analisado também não estava a ter um desempenho económico razoável devido a factores externos, principalmente as duas crises petrolíferas, e internos, devido ao aumento considerável dos custos unitários com o trabalho e aos níveis elevados de inflação registados. Porém, com a recessão que atingiu a economia no início dos anos 80 os governantes holandeses puseram em prática um conjunto de reformas estruturais que impulsionaram a competitividade internacional e trouxeram benefícios, quer para a economia interna quer para a economia externa, isto levou a que a economia holandesa registasse taxas de crescimento económico elevadas superando mesmo as taxas que se verificavam nos restantes países da União Europeia. O comércio internacional foi um dos pilares das várias expansões económicas registadas nos últimos anos na Holanda,
iv da economia holandesa, visto que a economia interna ainda estava enfraquecida. O comércio internacional holandês beneficia muito da sua posição geográfica e por causa disso tem-se assistido nas últimas décadas ao crescimento das reexportações, bens que são importados para um país que sofrem pouca ou nenhuma modificação e depois são novamente exportados para outros países. As exportações holandesas assentam muito nesta ideia e isso ajudou a impulsionar ainda mais esta rúbrica, neste caso os principais bens exportados são Maquinaria e equipamentos de transporte e Produtos Químicos e derivados. Por outro lado, as importações holandesas focam-se mais em bens de elevada intensidade tecnológica e de baixa intensidade tecnológica, devido ao aparecimento de novas tecnologias e ao papel crucial que a Holanda tem em comercializar e reexportar importantes mercadorias de baixa intensidade tecnológica, por esta razão as principais importações holandesas são de Maquinaria e equipamentos de transporte e Combustíveis fósseis, lubrificantes e derivados. O sector dos serviços, apesar de ser importante não tem tanto impacto nas exportações e importações holandesas como tem no caso português. No caso da economia holandesa o principal serviço, quer exportado quer importado, são Serviços prestados a empresas. Em termos de mercado, a crescente integração económica e a sua favorável posição geográfica faz com que os principais destinos das exportações holandesas sejam países europeus, com Alemanha e Bélgica a serem os principais destinos. Já o peso que Europa tem nas importações holandesas tem vindo a decrescer, porque com o aparecimento de novas economias emergentes, como a China, a Holanda começou a ser usada como um ponto de entrada prioritário dos seus produtos para a Europa, claro que esses produtos não são todos destinados à economia holandesa pois irão ser reexportados para os principais países de destino. Alemanha, Bélgica e China são neste momento os principais fornecedores da economia holandesa.
Nesta dissertação as exportações de bens e serviços e as importações de bens e serviços foram usadas como proxy do comércio internacional enquanto que o PIB medido pela óptica da despesa é a proxy do crescimento económico. Foram aplicados testes de raízes unitárias para inferir sobre a estacionaridade das séries, testes de cointegração para perceber se existe ou não uma relação de longo prazo entre as variáveis e foram aplicados os Modelos de Correção de Erros em cada país com o intuito de auferir não só o impacto de longo prazo mas também as dinâmicas de curto
v e os testes de cointegração aplicados confirmaram que existe uma relação de longo prazo entre as variáveis para ambas as economias. Ao aplicarmos os Modelos de Correção de Erros obtemos resultados distintos para Portugal e Holanda, no caso português tanto as exportações como as importações têm um impacto positivo sobre o crescimento económico no longo prazo, já no caso holandês as exportações têm um impacto positivo mas as importações têm um impacto negativo.
Estes resultados podem significar que, por um lado como Portugal passou por um período de especialização produtiva da sua indústria teve de importar bens tecnologicamente mais avançados incutindo esse progresso tecnológico na sua economia interna, que levou a um aumento na sua produtividade e competitividade internacional, ao mesmo tempo que, com a integração económica, passou a ter acesso a mercados mais amplos conseguindo alcançar economias de escala mais elevadas. Por outro lado no caso holandês, o impacto positivo das exportações explica-se pela forte política de abertura comercial implementada e pela crescente importância que as reexportações têm vindo a ter nesta economia. O impacto negativo das importações pode ser explicado pela grande quantidade de bens que são importados tendo como destino outros países europeus, isso pode não permitir que a economia interna tire benefícios desses bens, contudo os mesmos são registados como um défice na balança comercial. Esse impacto negativo também pode ser explicado pelo facto de a economia holandesa ter registado em expansões anteriores um elevado rendimento, que pode ter levado à preferência por bens estrangeiros mais competitivos, que poderá ter tido um efeito negativo sobre o crescimento económico.
Por fim, foram feitos testes de quebras de estrutura para testar a estabilidade e robustez das variáveis ao longo dos vários períodos de tempo, caso existam quebras de estrutura é preciso incluir uma variável dummy de modo a melhorar o modelo e perceber qual o seu impacto. Para Portugal o ano selecionado foi 1986, porque foi o ano da entrada de Portugal na CEE. O teste aceitou a existência de quebra de estrutura, de seguida introduziu-se uma variável dummy mas tal variável não é estatisticamente significativa, o que nos leva a concluir que os problemas enfrentados pela economia portuguesa nesta última década sobrepuseram os efeitos positivos que a entrada na CEE teve nesta economia. Ou seja, as dificuldades de ajustamento ao Euro, as quebras de produtividade e competitividade, a fraca qualidade e quantidade dos factores
vi suplantaram os efeitos positivos da entrada na CEE. Para a Holanda, o ano selecionado foi 1993, por ter sido o ano da última ronda do GATT, que levou à redução de algumas tarifas alfandegárias e promoveu uma abertura comercial entre países desenvolvidos e em desenvolvimento, e também foi no início dos anos 90 que as reexportações holandesas entraram em expansão. O teste confirma quebra de estrutura em 1993 mas a variável dummy introduzida não é estatisticamente significativa neste ano, contudo ao estudar outros anos em redor de 1993 percebemos que, em 1997, a variável dummy já é estatisticamente significativa, o que significa que os efeito das medidas adoptadas em 1993 podem ter resultado, anos mais tarde, num aumento do comércio entre a Holanda e as economias em desenvolvimento.
vii
Acknowledgements
I would like to thank to my parents and my sister for all the support and incentives throughout.
I would like to thank Prof. Sofia de Sousa Vale for all orientation, guidance and patience in the development of my Dissertation. Her comments and suggestions were always welcomed.
To all of those, family and friends, that have supported me and always believed in me.
viii
List of Contents
Abstract ... i
Resumo alargado da Dissertação ... ii
Acknowledgements ... vii
I-Introduction ... 1
II-Literature review ... 3
II.1-Economic growth theory... 3
II.2-Trade and Growth ... 5
III- Economic and trade evolution of Portugal and the Netherlands for the period 1970-2010 ... 10
III.1-Economic Growth... 11
III.2-International Trade ... 17
III.2.1-Exports of goods and services ... 17
III.2.2-Imports of goods and services ... 25
IV-Comparison between Portugal and the Netherlands: Empirical Models and Results... 34
IV.1-Trend and Business Cycles analysis ... 34
IV.2-Empirical Model... 40
IV.2.1-Unit root tests ... 40
IV.2.2-Cointegration tests ... 43
IV.2.3-Vector Error Correction Models Representation ... 44
IV.3-Structural breaks... 49
V-Conclusion ... 55
VI-References ... 57
1
I- Introduction
The relationship between international trade and economic growth has been under scrutiny since the classics, Adam Smith and David Ricardo believed that trade positively influenced economic growth because the higher accumulation of technical progress and capital would improve productivity and would lead to higher welfare gains as well as to higher growth. Actually, economic growth has always been present throughout history, although its growth rate has shifted from slow and irregular to a more dynamic, rapid and continued rate, especially after the Industrial Revolution (Baines, 2003). Trade flows also suffered a serious boost after the Industrial Revolution, which would eventually lead some authors to introduce it as an explanatory phenomenon of economic growth. Nowadays this phenomenon plays an important part over the endogenous growth models. According to Grossman & Helpman (1991) and Afonso (2001) international trade became one of the main sources of growth, because it enabled technological transfers from the developed countries to the less developed.
For small open economies, like Portugal and the Netherlands, who are not leaders in world technological advancements, trade becomes the main facilitator of technological progress and is a key factor in productivity and competiveness gains that foster economic performance and growth (Grossman & Helpman, 1991). It is important to mention that according to the economic growth models technological progress is the main driver of growth, meaning that countries must pursue technological breakthroughs in order to generate persistent gains.
The economies studied in this dissertation were Portugal and the Netherlands. For Portugal the adhesion to the European Economic Community (EEC) brought significant changes, both economical and structural, but structural fragilities arise with the entrance to the Euro and with the severe stagnation that occurred in the last decade. As for the Netherlands, it solved the main structural imbalances that it had in the beginning of 80’s and started to experience buoyant economic growth rates with a
2 strong performance of foreign trade, especially exports, due to its strategically geographical position.
The main purpose of this dissertation is to study the effects that international trade had on economic growth of Portugal and the Netherlands in the period 1970-2010. Some studies only concentrate on the exports side but it is also important to account the imports effect as well. With this in mind, this dissertation uses both exports of goods and services and imports of goods and services to fully understand the impact of international trade on economic growth.
Unit root tests are used to study for stationarity on the data, and Cointegration tests plus Vector Error Correction Models (VECM) are used to examine the short-run and long-run effects of exports and imports on economic growth. Structural break tests are also employed to examine if the variables are stable across the various subsamples of the data.
Our findings show that in the Portuguese economy both exports and imports positively affect economic growth. Our intuition for this is, during this period Portugal passed through a phase of specialization within the industry and had to import more technological advanced goods, mainly intermediate capital goods that promoted growth. In the meantime, Portugal started to have access to big and broader markets that led to higher economies of scale and growth.
As for the Netherlands our empirical estimation suggests that only exports have a positive influence on growth. We interpret these results as, on one hand exports promote growth because the increased openness led to a substantial rise of re-exports1 and the liberalized trade policy led to a better allocation of resources, which promoted productivity and growth. On the other hand imports do not have a positive effect on growth, because a large portion of the goods imported are intended to other European countries, so the domestic economy does not take advantage of the possible benefits. Also, the high level of income registered on previous expansions might have shifted internal demand towards foreign goods.
1 Re-exports are goods imported into a country that suffer little or no modification at all and then are exported
3 The remaining of this Dissertation is structured as following; Chapter II makes a literature review focusing on the evolution of economic growth theory and the influence of international trade; Chapter III makes an economic description of growth and trade of Portugal and the Netherlands for the period analyzed; Chapter IV includes the empirical estimations and results and; Chapter V concludes.
II- Literature Review
In this chapter a literature review is presented with the focus on how economic growth theory evolved, while considering international trade as an explanatory variable of it.
II.1) Economic growth theory
Economic growth, as was already mentioned, began with the industrialization process and is much faster and persistent than the one registered before that period. Such growth started in the Western European countries and spread to the periphery mostly through trade (Baines, 2003).
Economic growth theory as we currently know evolved from the exogenous growth models to the endogenous ones. Solow (1956) introduced an exogenous growth model that was based on a production function, with constant population growth and constant returns to scale, relating output with three main production factors, capital, labor and knowledge. Solow’s theory implies that the economy converges to a balanced growth path where the output per capita growth rate is determined by the rate of technological progress. Once the balanced growth path is reached technological progress enables capital to grow without decreasing its marginal productivity, allowing for sustained positive output growth. Despite Solow’s breakthrough the theory provides a considerable fragility, the explanatory variable of the output growth rate is
4 not determined by the model2 representing everything that is not explained by capital and labor, which can include potential payoffs arising from international trade.
With this line of thought new models appeared including technological progress as an explanatory variable of economic growth and tried to explain what Solow’s model could not, such models are the endogenous growth models pioneered by Romer (1990), Grossman & Helpman (1991) and Aghion & Howitt (1992), among others3. Romer (1990) introduced in his model profit-seeking R&D efforts and imperfect competition in the capital goods sector4. In this case output is also a function of capital, labor and technology, but; there are two sectors, one that produces goods and other that focus on R&D; capital and labor are used by the two sectors; and both sectors use the full stock of technology available. The conclusions on Romer’s model5 are identical to those on Solow’s, for this reason the marginal productivity of capital is held constant allowing technological progress to overcome the diminishing returns of capital fostering output growth. The difference between the two stands on how the growth rate of technological progress is determined, in Romer’s case it is endogenously determined and depends on how many people decide to work on the R&D sector.
Grossman & Helpman (1991) developed a model where growth is obtained by combining two conditions, production of differentiated goods and deliberate accumulation of knowledge. The authors presented a North-South trade model where the developed North engages in innovative R&D activities and then exports the goods produced to the less developed South, later on innovation from the North transforms into imitation from the South, enabling the northern manufacturers to move onto new production standards and new innovative goods. Hence, international trade is a fundamental factor for knowledge accumulation and economic growth. Because, as demonstrated in the model, when a country engages in world trade it gains access to a more advanced source of knowledge, and then uses that knowledge to accumulate new inputs and make productivity gains, which in turn leads to an increasing production of goods and services, thus becoming a stronger competitor. Dinopoulos & Segerstrom
2
The technological progress is treated as a Residual in Solow’s Growth Accounting function (Solow, 1957).
3 The works of Romer (1986), Lucas (1988) and Barro & Sala-i-Martin (1995) are also highly cited. 4
Firms intentionally engage in R&D activities with the intent of being compensated for successful innovations.
5 He assumes labor constant, population growth of zero and constant returns to scale in the production of
5 (2006) also developed a North-South trade model, their conclusions are similar to the ones found on the former, but these authors go a step further by analyzing the welfare implications of three aspects of globalization; increases in the size of the South, stronger intellectual property protection and lower trade costs.
In the work of Aghion & Howitt (1992) there is no capital accumulation, labor is constant and allocated between R&D and the production of capital goods, and innovation consists of inventing a new intermediate good that renders a previous one. They conclude that growth is generated by a random sequence of quality improving innovations that can arise from research activities, yielding positive externalities, such as the continued innovative progress that can occur, and a negative externality, which is the replacement of an old obsolete innovation by a new one.
Finally, for technical progress to fully have influence on economic growth it has first to be absorbed by the economy, so the technological absorption capacity also plays a role on the economic growth process and, according to several authors, it depends on the country´s human capital resources. This factor can be seen as a complementary effect of the endogenous growth models previously presented. Nelson & Phelps (1966) related economic growth to the stock of human capital based on the hypothesis that education speeds the process of technology diffusion and the catch-up with more advanced economies. The authors state that the gap between the theoretical level of technology and the level of technology in practice can be shortened by increasing the educational attainment, which might indicate that countries would be able to reach a higher level of technology in practice and would be able to absorb technical progress more rapidly if they increase their educational attainment. However, for Benhabib & Spiegel (1994) the stock of human capital enters insignificantly on the per capita growth rates, unless it has influence on the total factor productivity’s growth rate.
II.2) Trade and Growth
International trade plays a crucial role in the growth process as was first stressed by the classics, Adam Smith and David Ricardo. Adam Smith (1776) defended that broader markets would lead to higher accumulation of capital and higher
6 technological progress, thereby improving the division of labor and productivity, thus fostering economic growth. As for David Ricardo (1817), foreign markets could not only delay the eventual falls in the profit rates brought by higher wages and land limitations, but also countries would specialize on goods that had lowest opportunity costs and a stronger comparative advantage that would lead to larger welfare gains.
More presently international trade became one of the main subjects of study to explain economic growth, whether through trade liberalization and openness or through the export-led growth hypothesis. It is a fact that with the crescent globalization that occurred in recent decades both developed and developing countries increased their openness and lowered their barriers to trade, but they may have not benefited equally. Gries & Redlin (2012) study the short-run and long-run dynamics for 158 developed and developing economies, and find evidence of a positive relation between trade openness and economic growth in the long-run, meaning that in a longer term openness is a favorable strategy to promote growth. In the short-run, such relation is negative on low income countries and positive on high income countries, which could mean that low income countries may not reap benefits from international integration while in a short-run adjustment process. Other study that follows the same line of thought is Yanikkaya’s (2003) paper, who studies the growth effects of several measures of trade openness for 100 developed and developing countries and comes to the conclusion that not only trade volumes affect growth positively but trade restrictions also have a significant and positive effect on growth. This is more likely to be true in developing countries that use trade restrictions to cause a reallocation of productive resources to sectors where the country has a comparative advantage. Attention is needed though to the measures of openness used, because as Rodriguez & Rodrik (2001) stressed, in their critique to several papers, there is a tendency to overstate the effects that trade openness has on economic growth, especially when the measures used are poor measures of trade barriers that lack robustness, which in Yanikkaya’s case the use of a range array of openness measures may prove that his findings are sound. On a more theoretical approach Thirlwall (2000) realizes that generalized trade liberalization thus indeed improve growth performance and exports serve as a catalyst to that growth6, he also points out that the highest the technological intensity of the goods produced and traded in a country the more powerful is this
7 catalyzer, in other words countries that produce and export primary goods grow at smaller rates than others that produce and trade manufactured products. Nonetheless Thirlwall also acknowledges that some forms of trade liberalization, like Customs Unions, may be welfare-reducing, if trade diversion supplants trade creation, so he leaves room for the implementation of some protection barriers, especially by African economies, that may help countries being more liberalized but at a more moderate pace.
It is an established fact that exports promote economic through several channels; exports enhance productivity due to greater economies of scale; exports allow the importation of key intermediate inputs that can lead to better productivity; exports can bring incentives to pursue technological advancements that can lead to spillover effects and improve overall economic performance and; exports promote a better allocation of resources through specialization on goods that have a better comparative advantage (Baharumshah & Rashid, 1999; Shirazi & Manap, 2005; Abu-Quarn & Abu-Bader, 2001; Afonso, 2001). These effects led to the so called export-led growth (ELG) hypothesis (McKinnon, 1964), where the dominant cause of economic growth is an increase in export activities, and was first proved to be true by Michaely (1977), Balassa (1978), Krueger (1978) and Feder (1983), among others.
The study of the ELG hypothesis was followed by several authors and applied to different economies. Ramos (2001) studies the ELG hypothesis for Portugal, Baharumshah & Rashid (1999) study it for Malaysia, Shirazi & Manap (2005) study the case of Pakistan, Abu-Quarn & Abu-Bader (2001) focus on the MENA region, Hatemi-J & Irandoust (2000) focus on the European Nordic economies, Awokuse (2007) studies the case of three Central and Eastern European countries and Tik (2009) also inquires for Malaysia. The first six studies follow a more empirical approach. Ramos detected bidirectional causality for output and exports as well for output and imports, therefore proving that ELG hypothesis stands; Baharumshah & Rashid and Shirazi & Manap came across similar results for the cases of Malaysia and Pakistan, respectively, and also found proof of the ELG hypothesis; Abu-Quarn & Abu-Bader did not find evidence of the ELG hypothesis when using total exports but they did find a positive causality running from manufactured exports to economic growth, except in the cases of Algeria, Egypt and Jordan; Hatemi-J & Irandoust found bidirectional causality for all Nordic economies except Denmark, which could mean that exports’
8 expansion is crucial for economic growth and; Awokuse found bidirectional causality between exports and economic growth for Bulgaria and one direction causality stemming from exports to growth in Czech Republic, thus proving the ELG hypothesis. The author also found causality running from imports to economic growth in Poland, but here no causality running from exports to economic growth was found. In Tik’s case his study is more theoretical and he accepts that in the Malaysian case the ELG hypothesis still is the more viable growth strategy, because it increases the welfare of both consumers and producers through economies of scale and has spillover effects that benefit the overall economic performance, even being more vulnerable to business cycles’ fluctuations.
Despite these results the ELG hypothesis may not always stand (see Jung & Marshall, 1985 and Dodaro, 1993). Yang (2008) explains that if the ELG hypothesis was the only cause of economic growth it should have been followed by real exchange rate appreciation as a result of the foreign exchange inflow, which did not occur, so he developed a model that studies the relationship between productivity improvements in the tradable and non-tradable sectors, economic growth and exports, and assessed that out of 71 high growth-high exports episodes only half of them are consistent with the ELG hypothesis, the other half is explained by a productivity rise in the non-tradable sector. Therefore, it is not just increased openness that can promote output growth, productivity improvements arising from structural reforms can also generate equally great payoffs (Rodriguez & Rodrik, 2001).
Cui et al (2009) and Lin & Li (2002) go a step further than the previous papers by studying the export effects on economic growth for China while considering for spillover effects on other indicators7, so they can assess the direct and indirect impact that exports have on the overall economy. The first paper finds that exports are very important to China’s economic growth since not only exports have a strong direct relation with economic growth but also the spillover effects that exports have on other important indicators boost growth as well, they also acknowledge that due to this fact China’s economic performance is very exposed to foreign demand fluctuations. As for the second paper, Lin & Li (2002) create a new model that includes both direct and indirect effects of exports on GDP, as opposed to the traditional one that only accounts
7 Cui et al (2009) analyze the exports effects on investment, employment, income and consumption. Lin & Li
9 for the direct impact. The authors found evidence that the indirect impact of exports on growth is almost as important as the direct impact, which means that both domestic demand and international trade are important to stimulate economic growth. However there is a significant problem with this study as pointed out by the authors, the model lacks robustness because both the specification of the model and the selection of the estimation method can lead to different results and conclusions.
One aspect of international trade with impact over economic growth that is not often considered is imports. Among the previous empirical studies Ramos (2001), Baharumshah & Rashid (1999), Shirazi & Manap (2005), Abu-Quarn & Abu-Bader (2001), Awokuse (2007) and Lin & Li (2002) include imports in their analysis. It is important not to disregard imports, even though they have an adverse impact over the trade balance they actually can be as important as exports promoting growth, Riezman et al (1996) and Awokuse (2007) point out that if imports are overlooked that can lead to misleading results. Lee (1995), Humpage (2000) and Afonso (2001) stressed that importation, especially of capital goods, helps the transfer of technology from more developed countries to the least developed and encourages the pursue for new products and production processes, which would foster productivity, competiveness and promote a faster catch-up from the least developed economies to the leaders. Imports also promote employment, directly and indirectly, and domestic competitiveness as well, that can lead to the reduction of essential production inputs (Shirazi & Manap, 2005).
This chapter made a literature review about the evolution of economic growth theory and the part that international trade has played. Economic growth theory evolved from the exogenous growth models to endogenous growth models. The first brought a considerable breakthrough on growth theory, but treated the growth rate of technological progress as exogenous representing everything that was not explained by capital and labor. Within this framework Romer (1990), Grossman & Helpman (1991) and Aghion & Howitt (1992) developed models where the growth rate of technological progress was determined within the model, thus giving the possibility to fully understand what impact does the growth rate of technological progress has on economic growth.
10 The effects of international trade on economic growth did not go unnoticed, with several authors focusing on the relationship between trade and growth. On one hand, some authors focused more on how trade liberalization can boost growth, they found that generalized trade openness can propel economic growth but, they also recognize that in some less developed countries a progressive economic liberalization with the implementation of trade barriers in key sectors, where the country has comparative advantage, might be welfare-improving. On the other hand, several authors pursued the export-led growth hypothesis and studied it for different economies, in some cases the hypothesis was verified (Ramos, 2001; Baharumshah & Rashid (1999); Shirazi & Manap (2005); Hatemi-J & Irandoust (2000), among others) and in others it was not (Jung & Marshall (1985); Dodaro (1993); Yang (2008)). Yang (2008) states that ELG hypothesis might not always stand because more than often what really happens is a productivity rise on the non-tradable sector instead of a substantial increase in exports activities. Last but not least, imports can also promote growth and should not be overlooked, because they facilitate access to more technological advanced intermediate goods that can increase productivity and competitiveness that will lead to a faster economic growth.
III-Economic and trade evolution of Portugal and the Netherlands for the
period 1970-2010
The economies under study are Portugal and the Netherlands. These economies were selected because both are small open economies that had different trade patterns and different growth performances over the course of the period analyzed.
This chapter provides a description of Portuguese and Dutch economic performance for the period 1970-2010, with a focus on the economic growth and the international trade performance throughout. We begin by characterizing the economic growth of both economies and then analyze the behavior of exports and imports.
11 III.1) Economic growth:
From the early 70’s to the early 80’s:
Throughout the 70’s and early 80’s both economies were not performing at their best due to a set of internal and external factors. In the Netherlands, according to the OECD (1998), internal factors such as high wages, an acceleration of inflation and a high pressure on the social security system led to a rise on unit labor costs larger than the rise in productivity contributing to a deterioration of the profit margins, international competitiveness and investment. On the external side, the most noticeable events were the two oil shocks that led to a deterioration of the trade balance, although it was smoothed by the natural gas exports.
In Portugal because of the external high energy dependence, the oil shocks registered led to a strong deterioration of both the terms of trade and the trade balance forcing the country to apply for two bailout packages with the IMF that accentuated the recessions already under way (Afonso & Aguiar, 2004). On the domestic front the political pressures on the dictatorial regime and the overseas war against the colonies came to a halt with the Revolution in 1974. After the Revolution the major industries were nationalized and there was a rise on wages that triggered a rise on unit labor costs much larger than the productivity registered. This allied to an economic standstill and to a political and financial instability caused an adverse impact on economic growth (Pereira & Lains, 2010).
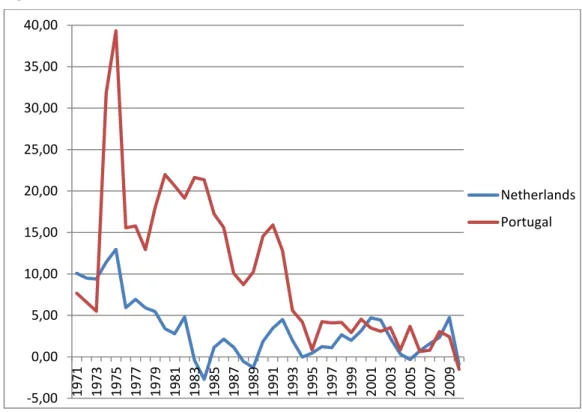
In Figure III.1 we have represented the growth rate of the unit labor costs between 1970 and 2010 for both countries, being very noticeable the spike that occurred in the mid 70’s, especially in the Portuguese case, however we need to take into account the compensations per employee in each economy, given by Figure III.2. We can see that there were significant differences between the compensations received by the Portuguese employees and the Dutch employees, so at that time Portuguese authorities tried to shorten the gap between the wages practiced in Portugal and the ones practiced in the European core, where the Dutch economy was included. The problem with such measure was the fall short of the productivity performance.
12
Figure III.1: Growth rate of Unit labor costs between 1970 and 2010
Source: OECD
Figure III.2: Nominal compensation per employee between 1970 and 2010.
Source: AMECO -5,00 0,00 5,00 10,00 15,00 20,00 25,00 30,00 35,00 40,00 1971 1973 1975 1977 1979 1981 1983 1985 1987 1989 1991 1993 1995 1997 1999 2001 2003 2005 2007 2009 Netherlands Portugal 0 10 20 30 40 50 60 70 80 1970 1972 1974 1976 1978 1980 1982 1984 1986 1988 1990 1992 1994 1996 1998 2000 2002 2004 2006 2008 2010 Netherlands Portugal
13
From 1980 to the turn of the century:
From this point on the economic performance of both countries was very distinct. With the recession that hit the economy in 1981/1982 the Dutch policymakers decided that a major change was needed to bring back the economy to a sustainable path. It was implemented a fiscal consolidation package and several structural and regulatory reforms, with the most significant one being the agreement between employers and trade unions on wage moderation, through a decrease of the minimum wage and of taxes, combined with reduced working time8. These reforms set in motion a period of strong international competitiveness, high profitability and investment and a rapid job creation. This generated an increase in private consumption, which boosted GDP growth enabling it to register a larger rate than the European Union average and enhance the terms of trade relative to its partners (OECD, 1998).
In fact structural reforms can explain how the performance of the two countries differs. According to Banco de Portugal (2009) the disappointing performance of the Portuguese economy can be explained by competitiveness problems resulting from structural imbalances, such as the low quantity and quality of the production factors which determines the economy’s flexibility to adapt to new markets and new production standards. This prevented Portugal from reaping all benefits from the international technological progress and making productivity gains.
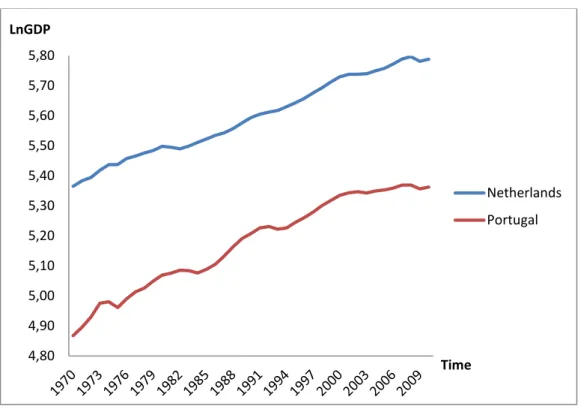
Figure III.3 and III.4 show the evolution of the GDP in logarithms and growth rates, respectively, for Portugal and the Netherlands between 1970 and 2010.
14
Figure III.3: Evolution of the GDP for the period 1970-2010.
Source: OECD
Figure III.4: Evolution of the GDP growth rate in the period 1970-2010.
Source: OECD 4,80 4,90 5,00 5,10 5,20 5,30 5,40 5,50 5,60 5,70 5,80 LnGDP Time Netherlands Portugal -5,00 -3,00 -1,00 1,00 3,00 5,00 7,00 9,00 11,00 1971 1973 1975 1977 1979 1981 1983 1985 1987 1989 1991 1993 1995 1997 1999 2001 2003 2005 2007 2009 gGDP Time Netherlands Portugal
15 As we can see from the figures since the mid 80’s to the end of the 90’s there is a clear expansion period for both economies. In 1986 Portugal became member of the European Economic Community and experienced a buoyant period of economic growth.
After the adhesion there was a strong liberalization of markets and elimination of barriers that existed to both Foreign Direct Investment (FDI) and international trade (Banco de Portugal, 2009). As a result there were implemented several FDI projects in some key sectors. With a more open economy there was a positive impact of international trade on economic growth (Afonso & Aguiar, 2004) through both economies of scale, because of the access to big and broader markets, and a change in the production structure that enhanced productivity (Marques, 2002) and international competitiveness. These factors combined with a favorable domestic environment led to a period of economic convergence to European levels, despite of the less strong performance since the mid 90’s, period where these factors were not as strong.
As for the Dutch economy, it started to reap the benefits from economic measures and reforms adopted in the early 80’s and started to experience strong growth rates with a good performance from the international trade but a more impressive one either from the private consumption, that benefited from the increase in employment and the asset prices, either from the investment, through an increase in the utilization capacity, in the demand and a higher profitability (OECD, 1998).
In 1992 the Portuguese and Dutch authorities decided to use the Deutschmark as a Monetary Policy reference, in order to give more stability and credibility to their own monetary policies, however there was an exchange rate crisis at that time that affected the German economy penalizing both currencies and dragging them into a recession in 1993. Nevertheless, this was a still a period of economic expansion.
The last decade of the period analyzed:
The previous expansion period came to a halt with the turn of the century primarily because of external factors, such as the abrupt brake in the United States economy and a crash in the stock markets worldwide. OECD (2002) explains that these factors affected the Dutch economy particularly hard for two reasons, first the U.S. economy has a relative importance in Dutch exports and imports; and second private consumption and investment, that were the main drivers in the previous
16 expansion, suffered a major setback. On one hand the crash in the stock markets diminished the asset prices considerably decreasing household’s wealth and consequently private consumption, on the other hand the rise in unit labor costs, in energy prices and the fall of the profit margins contributed to decrease investment substantially.
As we can see from Figure III.4 the Portuguese economy was also severely hit during this period and has not yet recovered. According to Banco de Portugal (2009) several factors have contributed to this outcome. First, the decrease in both domestic and foreign demand was combined with the recession occurred in the European Union (E.U.); second, an increase in international competition with the appearance of new entrants in world markets, such as the Central and East European countries and the Asian economies, and; third, structural rigidities, like the low quality of the production factors and the low flexibility of the labor and the products/services markets. These factors triggered a deceleration in productivity growth that not only led to a decrease in the economic performance at that time, but also took its toll throughout the decade.
The last period of economic expansion started in 2003/2004 and lasted until the global economic meltdown in 2008. The Netherlands had a more buoyant economic growth, the expansion was mainly due to a pickup in international trade that promoted exports, the Netherlands almost did not lose market share in this period and benefited from the stabilization of its competitiveness, as well as a raise up in investment, especially with a boost in the capacity utilization and lower interest rates (OECD, 2004). Despite the high productivity registered by the Netherlands its growth has been slow, mostly because of the lack of investment on ICT capital goods and the disappointing performance from the non-tradable services sector and the deceleration in the manufacturing services’ productivity (OECD, 2004; OECD, 2008). In 2008 with the collapse of the stock markets and the international trade the Dutch economy stopped growing and entered into a recession, but with an expansionist fiscal policy, an ease monetary policy and a pickup in trade in 2009 the economy started to recover supported once again by foreign demand, since the domestic one was still depressed (OECD, 2010).
At last, the Portuguese economy almost stagnated in the last expansion, mainly because the reasons that affected the economy on the previous downturn were not fully resolved and the continued loss of productivity, of competitiveness and the adoption of
17 inadequate policies9 (Pereira & Lains, 2010) led to a divergence from the European Union average growth. When the 2008 crisis emerged Portugal like many other European countries adopted an expansionist fiscal policy but because of its levels of high indebtness and the chronic problem of growth this led to a sovereign debt crisis which forced Portugal to apply for a new bailout package with the IMF, E.U. and European Central Bank (ECB), with the consolidation of public finances and the implementation of the so long needed structural reforms being the primary goal. Portugal registered some minor growth, though, in 2010 through the expansion of exports but still insufficient to put back the economy on a sustainable path (Banco de Portugal, 2011).
III.2) International trade
International trade was always one of the main factors behind economic growth in both economies, especially because since both Portugal and the Netherlands are small open economies that are not leaders in world technological advancements foreign trade becomes the main source of technological progress transmission leading to a better allocation of resources (Grossman & Helpman, 1991, Afonso & Aguiar, 2004, Afonso, 2001).
III.2.1) Exports of goods and services
Exports overall performance:
From Figure III.5 we can see that the evolution of exports throughout the four decades is very different between the two countries. After the 80’s Dutch exports suffered a boom while Portuguese exports experienced some significant changes over the course of the period. The Netherlands participated in all stages of the European integration process allowing for a high level of openness even in the beginning of the period, a process that contributed to an earlier access to bigger and broader markets
9 Aguiar- Conraria et al (2010) give the example of the excessive wage growth in the first years of the Economic
18 that translated into economies of scale and a market share gain, boosting export and economic growth. Portugal did not take part in the first stages of European integration and did not have the same opportunities as the Dutch in the first decade or so of the period analyzed. However even after Portugal became a member of the EEC the performance of this indicator still did not match up, Portugal started to see some positive evolution and some market share gain until the beginning of 90’s when the entrance of new emerging economies and the continuously loss of competitiveness caused by structural fragilities led to a considerable loss of market share in recent decades, that negatively affected export performance and economic growth (Banco de Portugal, 2009). At the same time the Dutch economy put in place several reforms that improved competiveness allowing for a gain in market share and in the terms of trade serving as leverage for a sound export performance and growth (OECD, 1998; OECD, 2008).
Figure III.5: Evolution of Exports between 1970 and 2010.
Source: OECD 3,8 4 4,2 4,4 4,6 4,8 5 5,2 5,4 5,6 5,8 1970 1972 1974 1976 1978 1980 1982 1984 1986 1988 1990 1992 1994 1996 1998 2000 2002 2004 2006 2008 2010 LnExports Time Netherlands Portugal
19
Evolution of the exports growth:
Figure III.6 illustrate the export growth performance, from there we can assess that evolution is very similar to the economic growth presented in Figure III.4. We can see the plunge on Portuguese exports occurred with the oil shocks and with the most recent economic crisis that implicated a severe decline in the terms of trade, especially because of the downturn in exports and the less severe downturn in imports, which drove the country to severe recessions obligating it to apply for bailout packages. We can also see that in 1993 export performance was not as strong because of the currency crisis that affected Germany and had spillover effects over the Portuguese economy.
Such troughs are also visible in the Dutch economy; the first mainly because the disappointing performance in the first decade of the period and; the other two, one in the beginning of the last decade and the other with the recent economic crisis, because of the crash in world trade that collapsed Dutch exports.
There are also some booming periods, though, which are easily indentified. In the Portuguese case we can see that after the oil shocks and mainly until the mid 90’s exports grew at very reasonable rates, the reason behind this is because after the oil shocks the stabilization policies conducted by the policymakers and the entrance to the EEC in 1986 contributed to a gain in market share, in competitiveness and in the terms of trade that led to a growth higher than the growth of world exports, first through low-tech goods where Portugal had a comparative advantage and then through the medium-high-tech sector after the implementation of important FDI projects10. As for the Dutch economy the more noticeable peeks occurred after the mid 80’s throughout the 90’s and into the early 00’s mainly because after the implementation of the structural reforms and the strong economic performance registered there was a rise in both productivity and international competiveness, that together with a sound domestic demand, especially investment, boosted export growth11.
10 According to Banco de Portugal (2009) and Afonso & Aguiar (2004). 11 According to OECD (1998) and OECD (2000).
20
Figure III.6: Export growth performance.
Source: OECD
There are three key factors that can explain the fluctuations across the period, first the market share of the country; second the types of goods and services exported; and third the main destinations of its exports.
Market share and its influence over the countries performance:
In the 90’s with the entrance of new competitors with lower production costs and specialized in the same products as the Portuguese exporters there was a demand shift from Portuguese products to them that led to a considerable loss of market share. Even after Portugal started to change its productive structure towards products with a relatively higher technological intensity, countries from Central and Eastern Europe revealed a higher comparative advantage because of its abundant and more qualified work force and favorable geographical location. Consequently we started to assist to a reduction of FDI in Portugal from that point on and a delocalization of industries to those countries, in both the low-tech and the medium-high-tech sectors.
The Dutch case is different. Because of the limited size of the internal market the industrial sector has always been more focused towards the external markets and the agricultural sector is one of the leaders in the world market, so there was not a
-20,00 -10,00 0,00 10,00 20,00 30,00 40,00 1971 1973 1975 1977 1979 1981 1983 1985 1987 1989 1991 1993 1995 1997 1999 2001 2003 2005 2007 2009 gExports Time Netherlands Portugal
21 considerable loss of market share since the new entrants where not specialized in these type of products. Also the re-exports share in total exports is considerably large in this country than in other European countries, thus helping stabilize the level of market share (Westerink, 2003; OECD, 2008). Furthermore, re-exports grew at a fast pace in the most recent decades, due to its strategic geographical position the Netherlands serves as a key entry point to Europe for goods coming from all parts of the world, thus being a major player in worldwide transactions (CBS, 2011).
Main goods and services exported by each country:
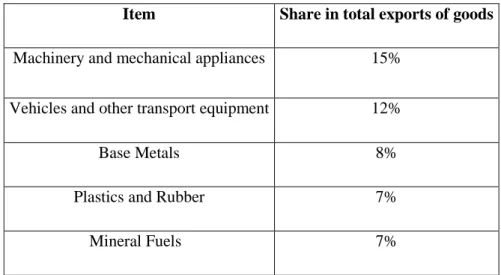
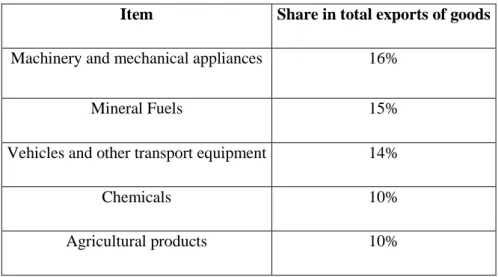
In Tables III.1 and III.2 we can see the share of total exports of goods of the major exports of goods for Portugal and the Netherlands in 2010, respectively. In the first decade and a half or so of the period in analysis the main exports of goods in Portugal were Textiles, clothing and footwear and Food Products, however with the entrance of the emerging markets specialized in low-tech goods, especially in Textiles, clothing and footwear, with an abundant work force and lower costs of production and with the liberalization of the textiles sector in the European Union there was an increasing pressure over the Portuguese market. It was clear at this point that a change was needed, so Portugal shifted its productive tissue towards a more technological intensive sectors taking advantage of the FDI projects that occurred in the 80’s and 90’s. The medium-high-tech sector started to have a larger importance in total exports, with emphasis on Vehicles and other transport equipment, which led to a convergence of the Portuguese manufacturing sector exports to the world exports. However Portugal was not able to specialize further in high-tech products and still has a considerable important share of low-tech goods in total exports which can also explain the depressed growth experienced in the last decade (Banco de Portugal, 2009).
The Dutch economy benefited from the export oriented manufacturing sector and the strong agricultural sector to specialize in those products, in fact when compared with other western economies the agricultural sector has a higher importance which explains the large share of food related products in total exports (Westerink, 2003). Also according to the CBS (2011), Dutch exports started to shift their product specialization towards high-tech goods, especially after 1997,
22 representing 31% of the export value12 in 2010, mainly at the expenses of the medium-high-tech and medium-low-tech goods. Of course, here re-exports also had an important role not only in the development but also in the performance over the course of the years.
Table III.1: Portuguese main exports of goods in 2010
Item Share in total exports of goods
Machinery and mechanical appliances 15% Vehicles and other transport equipment 12%
Base Metals 8%
Plastics and Rubber 7%
Mineral Fuels 7%
Source: INE (2011)
Table III.2: Dutch main exports of goods in 2010
Item Share in total exports of goods
Machinery and transport equipment 29% Chemicals and related products 19% Mineral fuels, lubricants and related products 14%
Food and live animals 12%
Miscellaneous manufactured articles 9%
Source: CBS (2011)
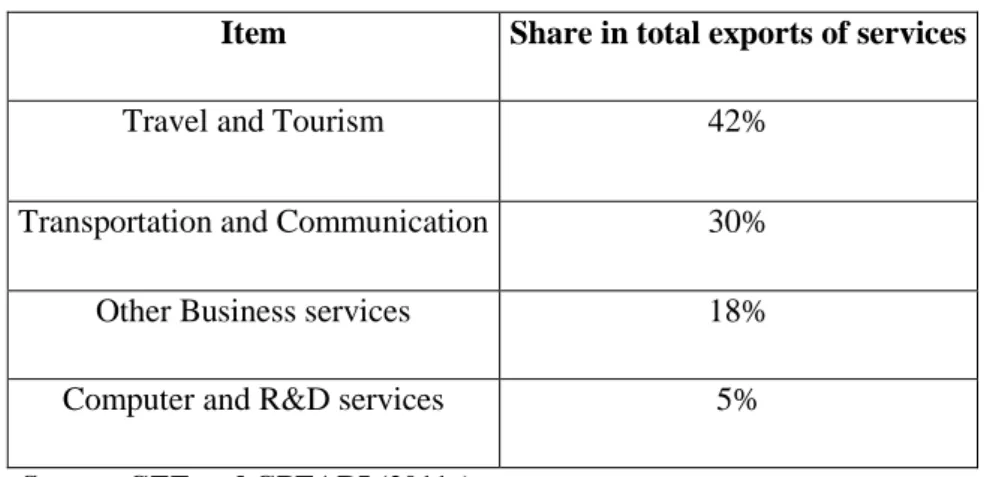
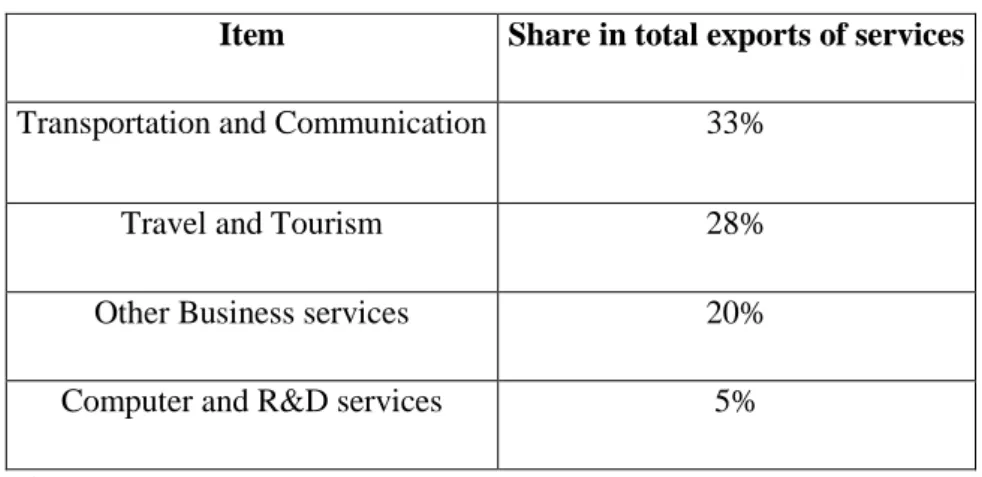
In the case of services this sector has a larger importance in Portugal’s exports than in many other European countries, an importance that was accentuated in 2009
23 because of the fall of the exports of goods. For geographical and climate reasons Tourism is still the dominant service, but we have been assisting to a substantial rise in Other business services and Computer and R&D services (GEE and GPEARI, 2011a). In the Dutch case, services have not such a high importance in total exports, mainly because since the service needs to be consumed at the point of production very few can cross boarders and the Dutch economy plays a more distributor role to Continental Europe and can more easily trade goods than services (CBS, 2011), notwithstanding the service sector represents almost 75% of GDP. Table III.3 and III.4 show the main services exports in 2010.
Table III.3: Portuguese main exports of services in 2010
Item Share in total exports of services
Travel and Tourism 42%
Transportation and Communication 30%
Other Business services 18%
Computer and R&D services 5%
Source: GEE and GPEARI (2011a)
Table III.4: Dutch main exports of services 2010
Item Share in total exports of
services
Other Business services 31%
Transportation 21%
Royalties and license fees 20%
Travel 11%
24
Main exports destinations of Portugal and the Netherlands:
The third factor considered is the destination of exports. In both cases we can see that the European market represents the core market to where both Portugal and the Netherlands ship their products, a circumstance that has to do with the European integration process that allowed for a liberalization of markets and a fall in transportation costs and trade barriers that highly promoted intra-E.U. trade (Banco de Portugal, 2009)13.
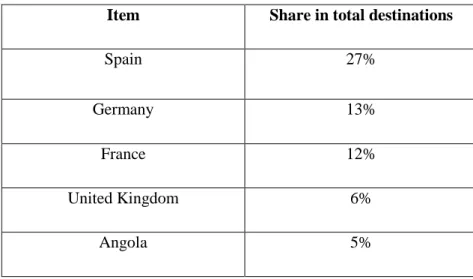
Portugal had a larger trade share with the ex-colonies in the 1970s, however with the Revolution and the disappearance of the political dependency this trade relationship came to halt and Portugal started to focus on Europe. After joining EEC Portugal assisted to an increase in the share of its exports with the European partners and especially with Spain. It was after this period that the Spanish market became the most important destination of Portuguese exports (Banco de Portugal, 2009; Afonso & Aguiar, 2004). This can also explain the shy performance of exports in two ways, first Portugal has become too exposed to fluctuations that can occur in the European Union economy and especially in the Spanish economy and; second the share that the U.S. economy has on Portuguese exports is still insignificant and Portugal has not taken advantage of the booming Chinese market over the last decades. It is also important to refer the substantial export growth to Angola in the most recent years making it the major extra-E.U. market, according to GEE & GPEARI (2011b) this market grew from 11% of extra-E.U. exports in 1993 to 21% in 2010.
Geographical and historical factors plus an increased European integration explain the fact that Dutch exports are also focused towards Europe. In the case of the Netherlands, being able to participate in all stages of European integration allowed it to have more strong and durable relations with the other European countries. CBS (2011) mentions that this economy has already a relatively large trade flow with the U.S. economy, since it represents the largest extra-E.U. destination. It is also important to notice that the share of re-exports on total exports is considerably large, representing up to 45% of total exports in 2010. Most of these re-exports come from emerging markets to European countries using the Netherlands as a gateway.
25
Table III.5: Portuguese main exports destinations in 2010
Item Share in total destinations
Spain 27% Germany 13% France 12% United Kingdom 6% Angola 5% Source: INE (2011)
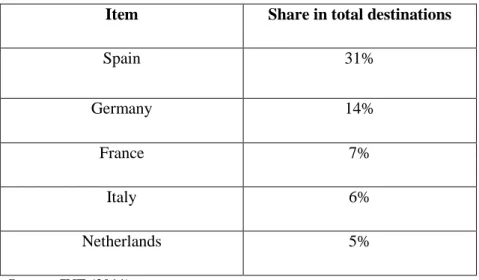
Table III.6: Dutch main exports destinations in 2010
Item Share in total destinations
Germany 24% Belgium 11% France 9% United Kingdom 8% Italy 5% Source: CBS (2011)
III.2.2) Imports of goods and services
The imports boom:
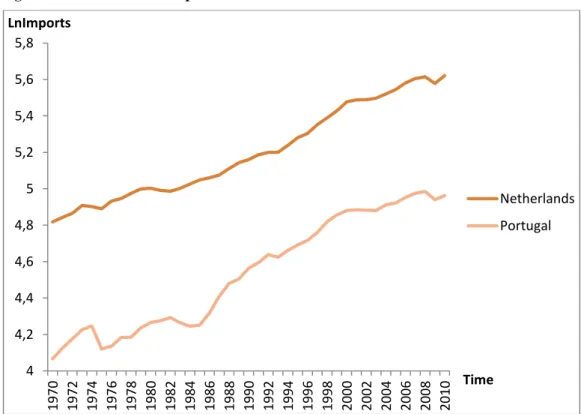
Figure III.7 illustrates the evolution of imports for both economies in the last four decades. In this case we can also notice the boom suffered by the Netherlands from the early 80’s onwards and from Portuguese imports since the late 80’s.
26 The main reasons for the boom on Dutch imports was the continued rise on the re-exports share in total exports and the relevance of the Chinese economy over time. As mentioned before the Netherlands is perfectly positioned to act as a gateway to Europe, so there was a crescent surge of products coming into the Netherlands destined to other European countries, in the meantime the Chinese economy was appearing into the world markets with more competitive products and saw the Netherlands as a strategic port of access to Continental Europe (CBS, 2011) using it to deliver its products more efficiently and rapidly.
As for the Portuguese economy the adhesion to the EEC led to an increased openness and to an implementation of important FDI projects, this implied a focus on trade with more technological advanced economies and a large importation of goods that were not produced domestically, such as capital goods. Also being Portugal an importer of energetic goods the constant rise on prices increased imports as well.
Figure III.7: Evolution of Imports between 1970 and 2010.
Source: OECD 4 4,2 4,4 4,6 4,8 5 5,2 5,4 5,6 5,8 1970 1972 1974 1976 1978 1980 1982 1984 1986 1988 1990 1992 1994 1996 1998 2000 2002 2004 2006 2008 2010 LnImports Time Netherlands Portugal
27
Evolution of the imports growth:
Figure III.8 portraits the imports growth performance across the period analyzed. Through this figure we can point out the peaks and troughs that both economies suffered. Portuguese imports suffered a rise especially in the mid 80’s and mid 90’s, the first one mainly due to the importation of capital goods from more industrialized economies, in order to incorporate the technological advancements and begin the specialization process within the industry (Afonso & Aguiar, 2004), and the second one because of the crescent demand for durable goods, especially in the years that preceded the adhesion to the Euro area. Moreover exports were booming in these periods, and since exports are used to finance the purchase of new goods/services this led to a rise in imports as well. As for the Dutch economy such peaks were caused not only by the sound domestic demand registered after the reforms implemented in the beginning of 80’s but also with the strong export performance occurred in those periods as well (OECD, 1998).
The troughs are also coincident with those of exports. For the Portuguese economy the causes of the troughs were the oil shocks and the recent economic crisis, as a consequence there was a severe downturn in both exports and domestic demand that affected import performance. In 1993, though, the cause was the already referred currency crisis in Germany.
The Dutch economy also experienced a crash on imports with the oil shocks, but the sluggish performance occurred during that period also contributed to it. The sharp decline in the domestic demand and in exports performance caused both troughs during the 00’s (OECD, 2002; OECD, 2010).
28
Figure III.8: Imports growth performance
Source: OECD
On imports we can also identified three factors that can explain the performance throughout the period, first the weaknesses of the economies; second, the type of goods and services imported; and third, the main suppliers.
Main weaknesses of each economy:
Regarding the first factor, and apart from the already mentioned structural fragilities and low productivity, Portugal registers a low level of capital accumulation when compared to its partners, in fact Portugal had been one the most FDI attractive European countries during the 80’s but such capacity to continue to attract FDI has been much smaller (Marques, 2002) and nowadays the level of investment only represents 25% of that registered in the beginning of the 00’s (Banco de Portugal, 2011). Moreover Portugal registers a high energetic dependence (GEE & GPEARI, 2011) since it imports the totality of the fossil fuels that it consumes, also even though the Portuguese economy passed through a process of crescent specialization within the industry after the adhesion to the EEC, its industry, though, is not yet very
-28,00 -18,00 -8,00 2,00 12,00 22,00 1971 1974 1977 1980 1983 1986 1989 1992 1995 1998 2001 2004 2007 2010 gImports Time Netherlands Portugal