Academic Journal of Economic Studies Vol. 1, No.2, June 2015, pp. 69–78 ISSN 2393-4913, ISSN On-line 2457-5836
Effects of Oil and Non-Oil Exports on the Economic
Growth of Syria
Adel Shakeeb Mohsen
Universiti Sains Malaysia, Penang, Malaysia, E-mail: adelmhsen@hotmail.com
Abstract This study investigated the role of oil and non-oil exports in the Syrian economic over the period 1975-2010. The ADF unit root test, Johansen cointegration test, Granger causality test, impulse response functions (IRF), and variance decomposition (VD) analysis were used in this study. The cointegration test indicates that GDP is positively and significantly related to oil and non-oil exports. The Granger causality test indicates bidirectional short-run causality relationships between GDP, oil exports and non-oil exports. There are also bidirectional long-run causality relationship between non-oil exports and GDP, and unidirectional long-run causality relationship running from oil exports to GDP. The study result indicates that oil exports have the biggest effect on the GDP, thus we suggest encouraging non-oil export and increase its diversity.
Key words Syria, economic growth, oil exports, non-oil exports, VAR
JEL Codes: O11, E20
1. Introduction
Exports can play an important role in promoting economic growth through supplying the state budget with earnings and foreign currency that can be used for improving infrastructure and creating an attractive investment climate. Moreover, Export growth leads firms to increase their output and reduce their cost of production, which increases the productivity of these firms and achieve economies of scale. Besides, it plays an important role in expanding the size of the local market and increasing the degree of competition that leads the country to improve its production and use new technology in its production process.
70
exports and increase non-oil exports (SIA, 2009).
However, the war which started in 2011 has caused a huge damage to the Syrian economy. Investment has declined, the deficit in the trade balance has increased, and many oil wells were controlled by the terrorists (SCPR, 2014). Given this backdrop, the main objective of this study is to test the effect of oil and non-oil exports on the Syrian economy from 1975 to 2010, which may assist Syrian policy maker, after the war, to develop an economic plan that takes into account the effect of oil and non-oil exports on the Syrian economy.
2.Literature review
Many studies have tested the effect of oil and non-oil exports on economic growth of different countries. The findings from these studies tend to vary from one country to another. Aljarrah (2008) found that non-oil export has a positive effect on economic development in Saudi Arabia. Olurankinse and Bayo (2012), Ude and Agodi (2014) and Ifeacho et al. (2014) found that non-oil export has a significant positive relationship with the economic growth of Nigeria, which indicates that the rise in the non-oil export leads to a significant improvement in the Nigerian level of economic development. Adenugba (2013) also found that non-oil exports have a positive effect on the economic growth of Nigeria, but it has performed below expectations. However, Akeem (2011) and Abogan (2014) concluded that the relationship between non-oil exports and economic growth in Nigeria is positive and insignificant. Besides, Mehrara (2014) found that non-oil trade does not have any significant effects on economic growth of 11 oil exporting countries. Merza (2007) found that there is a bidirectional causality relationship between oil exports and economic growth, and there is a unidirectional causality relationship running from non-oil exports to economic growth in Kuwait. Hosseini and Tang (2014) concluded unidirectional causality relationship moving from oil and non-oil exports to economic growth, but oil export has a negative effect on the economic growth of Iran. However, Mehrabadi et al. (2012) found that both oil and non-oil exports have positive effect on the economic growth of Iran. Esfahani et al. (2013) also found a positive effect of oil revenues on the Iranian economy. Similar results are reported by Esfahani et al. (2014) for major oil exporting countries. However, Delacroix (1977) supposed that the exports of raw materials do not help in economic growth. If the country does not use the raw materials in the industrial process it will stay underdeveloped. So using raw materials in the industry will help in economic growth and will lead to developing the country.
Academic Journal of Economic Studies Vol. 1 (2), pp. 69–78, © 5 AJES
71 (1987), Krueger (1990), Sengupta and Espana (1994), Al-Yousif (1997), Shirazi and Abdul-Manap (2004), Alhajhoj (2007), Hye and Bel Haj Boubaker (2011), and Saad (2012). Some other researchers such as Husein (2009) and Hamuda et al. (2010), and Hye (2012) concluded that there is a bidirectional causality relationship between exports and economic growth. However, Al-Suwaidi and Al-Shamsi (1997), Temiz and Gokmen (2010), Safdari et al. (2011), and Abbas (2012) found that there is a positive and unidirectional causality relationship running from economic growth to export. Other researchers including Holman and Graves (1995), Xu (2000), Bouoiyour (2003), Bahmani-Oskooee et al. (2005), Cetintas and Barisik (2009), and Mehrara and Firouzjaee (2011) found that exports lead growth.
3. Methodology of research
The vector autoregression (VAR) model will be used in this study. Our model consists of three variables: the gross domestic product (GDP), oil exports (OX), and non-oil exports (NOX) of Syria. GDP is the dependent variable. The model is presented as follows:
lnGDP = α + β1lnOX + β2lnNOX + εt (1)
where α is the intercept, β1and β2 are the slope coefficients of the model, lnGDP is
the natural log of the real gross domestic product (in millions of SYP), lnOX is the natural log of real oil exports (in millions of SYP), lnNOX is the natural log of real non-oil exports (in millions of SYP), and εt is the error term.
72
of GDP at short and long forecasting horizons. This study uses annual time series data of Syria during the period from 1975 to 2010. This data collected from the Central Bureau of Statistics in Syria. All variables in this study are in real value. Besides, all data will be expressed in the logarithmic form.
4. Empirical Results and Discussion
In the first step of the analysis, we will use the ADF unit root test to identify which variables in the models have a unit root. In other words, we would like to determine whether variables in the models are stationary or non-stationary. If the time series are not stationary at the level, the ADF test is performed on the first differenced series. It is clear from Table 1 that all the variables are not stationary at the level, but become stationary after the first differencing at either the 5% or 1% level of significance. This means that all variables are I(1).
Table 1. ADF unit root test results
Level First difference
Intercept Trend & intercept None Intercept Trend & intercept None lnGDP 0.726 -2.111 3.695 -6.998** -7.367** -1.468 lnOX -0.616 -2.726 1.285 -6.471** -6.390** -6.172** lnNOX -0.249 -2.389 2.297 -5.478** -5.406** -4.817**
Note: ** Denotes significance at the 1 per cent level, and * at the 5 per cent level.
4.1. Johansen Cointegration Test Results
After determining that all the variables in the model are stationary in the first difference, we run the VAR model to determine the optimal lag length, then the Johansen cointegration test will be used to determine if there is any cointegration or long-run relationship among the variables. The optimal lag length selection is 3 lags based on the AIC.The result of theJohansen cointegration test shows that there is only one cointegration equation based on the trace and maximum eigenvalue tests (see Table 2). In other words, the results indicate that there is a long-run relationship between lnGDP, lnOX and lnNOX.
Table 2. Johansen cointegration test results
No. of CE(s) Trace Statistic Probability Max-Eigen Statistic Probability
r = 0 42.03724*** 0.0078 26.32089** 0.0130
r ≤ 1 15.71635 0.1881 8.671721 0.4698
r ≤ 3 7.044627 0.1241 7.044627 0.1241
Academic Journal of Economic Studies Vol. 1 (2), pp. 69–78, © 5 AJES
73 After having found a cointegration relationship among the variables lnGDP, lnOX and lnNOX, the cointegrating equation was normalized using the real GDP variable.
Table 3. Cointegration equation normalized with respect to GDP
lnGDP lnOX lnNOX C
1.000000 -0.203767 -0.154849 -10.71999
(0.07196) (0.05946) (0.25711)
From the Table 3, the long-run lnGDP equation can be written as:
lnGDP = 10.71999 + 0.203767 lnOX + 0.154849 lnNOX (2)
The cointegration equation above shows that GDP is positively related to the oil and non-oil exports. For every one percent increases in oil and non-oil exports, the GDP will increase by 0.20 and 0.15 percent, respectively. This suggests that oil and non-oil exports support the economic growth in Syria. An increase in exports (non-oil and non-oil exports) provides the government with earnings and foreign currency to import the requirements for development, in addition to providing funds that can be used to improve infrastructure, and for creating an attractive investments climate, which help in supporting the Syrian economy. This finding agrees with the results obtained by Mehrabadi et al. (2012), Olurankinse and Bayo (2012), Ude and Agodi (2014), and Esfahani et al. (2014).
4.2. Granger Causality Tests Results
After having identified the existence of a long-run relationship among the variables, in this section, the results of the short and long run causality relationships among the variables based on the vector error correction model (VECM) were shown. The F-test results show the significance of the short-run causal effects, while the [ect(-1)] shows the long-run causal effect. It is clear from Table 4 that there are bidirectional causality relationships between lnOX, lnNOX and lnGDP in the short run. But in the long run, there are bidirectional causality relationship between lnNOX and lnGDP, and unidirectional causality relationship running from lnOX to lnGDP.
Table 4. Granger causality test results
Independent variables
∑∆ lnGDP ∑∆ lnOX ∑∆ lnED ect(-1)
∆ lnGDP - 3.938478(4)** 2.657295(3)** -1.931411*
∆ lnOX 3.600792(5)** - 1.327643(3) -0.063373
74
brackets show the optimal lag based on the AIC. D represents the first difference. Only F-statistics for the explanatory lagged variables in first differences are reported here. For the ect(-1) the t-statistic is reported instead. ** denotes significance at the 5 per cent level and * indicates significance at the 10 per cent level.
4.3. Statistical Diagnostic Tests Results
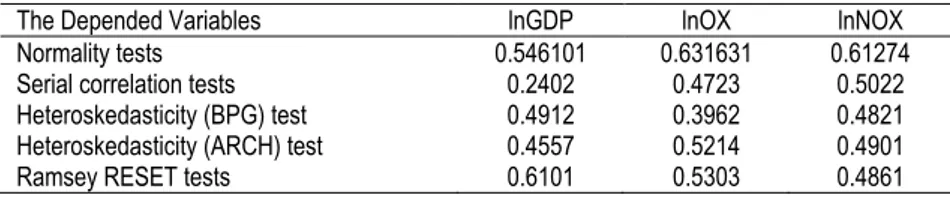
The VECMs will be subjected to a number of diagnostic tests, namely, the normality, serial correlation, heteroskedasticity (BPG and ARCH) and Ramsey RESET tests. A 5% level of significance will be used in all these tests. Table 5 show that the VECM with lnGDP, lnOX, and lnNOX as the dependent variables pass the normality, serial correlation, heteroskedasticity (BPG and ARCH) and Ramsey RESET tests.
Table 5. Results of the statistical diagnostic tests on the VECM
The Depended Variables lnGDP lnOX lnNOX
Normality tests 0.546101 0.631631 0.61274
Serial correlation tests 0.2402 0.4723 0.5022
Heteroskedasticity (BPG) test 0.4912 0.3962 0.4821 Heteroskedasticity (ARCH) test 0.4557 0.5214 0.4901
Ramsey RESET tests 0.6101 0.5303 0.4861
Note: ** Denotes significance at the 1 percent level, and * at the 5 per cent level
4.4. Impulse Response Functions (IRF) Test Results
Impulse response functions (IRF) allow us to study the dynamic effects of a particular variable’s shock on the other variables that are included in the same model. Besides, we can examine the dynamic behaviour of the times series over ten-year forecast horizon. Figure 1 shows that when there is a shock to lnOX or lnNOX, lnGDP responds positively, but the impact of the shock to lnOX dies down gradually, which fit with the government’s strategy to reduce oil exports and increase non-oil exports.
Academic Journal of Economic Studies Vol. 1 (2), pp. 69–78, © 5 AJES
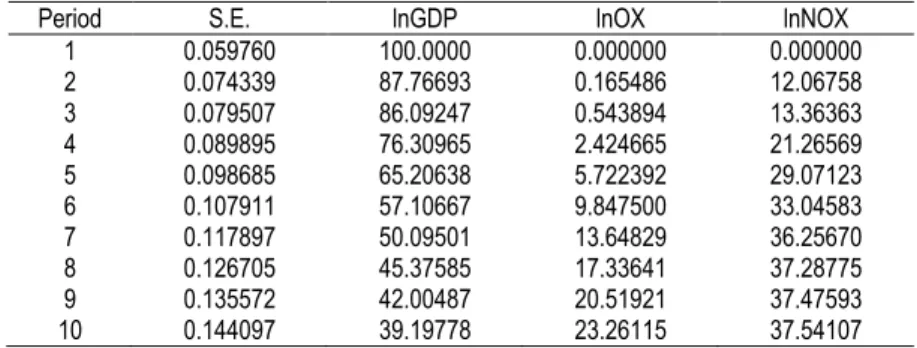
75 4.5. Variance Decomposition (VD) Analysis Results
The variance decomposition (VD) for 1-year to 10-year forecast horizons will be applied in this study. The VD concerns to the extent to which variables are dependent on each other, and it provides information about the relative importance of each random innovation in affecting the variables in the model during the forecast horizon. In other words, The VD indicates the amount of information each variable contributes to the other variables in the autoregression. It determines how much of the forecast error variance of each of the variables can be explained by exogenous shocks to the other variables. The forecast error variance decompositions of the variables in our model are given in Table 6. In the first year, the error variance of GDP is exclusively generated by its own innovations and has been decreasing since then for the various forecast horizons. However, at the 10-year forecast horizon, its own shocks contribute about 39% of the forecast error variance. On the other hand, lnOX and lnNOX shocks explain 23% and 38% respectively of the forecast error variance of GDP. Furthermore, the contributions of lnOX and lnNOX in explaining lnGDP forecast error variance have increased during the 10-year forecast horizon.
Table 6. Variance decomposition (VD) analysis results
Period S.E. lnGDP lnOX lnNOX
1 0.059760 100.0000 0.000000 0.000000
2 0.074339 87.76693 0.165486 12.06758
3 0.079507 86.09247 0.543894 13.36363
4 0.089895 76.30965 2.424665 21.26569
5 0.098685 65.20638 5.722392 29.07123
6 0.107911 57.10667 9.847500 33.04583
7 0.117897 50.09501 13.64829 36.25670
8 0.126705 45.37585 17.33641 37.28775
9 0.135572 42.00487 20.51921 37.47593
10 0.144097 39.19778 23.26115 37.54107
5. Conclusions
76
unidirectional causality relationship running from oil exports to GDP. The impulse response functions (IRFs) indicated that when there is a shock to oil or non-oil exports, GDP will respond positively in the following years. The variance decomposition (VD) analysis showed that at a ten-year forecasting horizon, oil and non-oil exports shocks explain 23% and 38% respectively of the forecast error variance of GDP, which agrees with the government’s strategy to reduce its dependence on the oil sector and making the industrial sector the locomotive of economic growth in the country.
Based on the results of this study, the Syrian government should diversify exports, simplify the export procedures, improve Syrian industry, and increase the percentage share of non-oil exports in total Syrian exports in order to reduce the effect of oil prices fluctuations on the Syrian economy, as well as boosting the quality, productivity, and competitiveness of the Syrian products in global markets.
References
Abbas, S. (2012). Causality between Exports and Economic Growth: Investigating Suitable Trade Policy for Pakistan. Eurasian Journal of Business and Economics, 5 (10), pp. 91-98.
Abogan, O.P., Akinola, E. B., & Baruwa, O.I. (2014). Non-oil export and Economic growth in Nigeria (1980-2011). Journal of Research in Economics and International Finance, 3 (1), pp. 1-11.
Adenugba, A.A., & Dipo, S.O. (2013). Non-Oil Exports in the Economic Growth of Nigeria: A Study of Agricultural and Mineral Resources. Journal of Educational and Social Research, 3 (2), pp. 403-418.
Akeem, U.O. (2011). Non-Oil Export Determinant and Economic Growth Nigeria (1988-2008). European Journal of Business and Management, 3 (3), pp. 236-257. Alhajhoj, H. (2007). Exports and Economic Growth in Saudi Arabia: A VAR Model Analysis. Journal of Applied Sciences, 7 (23), pp. 3649-3658.
Aljarrah, M.A. (2008). Non-Oil Export Growth and Economic Development in Saudi Arabia: A Simultaneous Equations Approach. Journal of the Gulf and Arabian Peninsula Studies, 34 (129), pp. 25-44.
Al-Suwaidi, A., & Al-Shamsi, S. (1997). Exports and Economic Growth in Egypt: Evidence from Cointegration Analysis. Journal of King Saud University, 10 (2), pp. 99-106.
Al-yousif, Y.K. (1997). Exports and Economic Growth: Some Empirical Evidence from the Arab Gulf Countries. Applied Economics, 29 (6), pp. 693- 697.
Academic Journal of Economic Studies Vol. 1 (2), pp. 69–78, © 5 AJES
77 Balassa, B. (1985). Exports, Policy Choices, and Economic Growth in Developing Countries after the 1973 Oil Shock. Journal of Development Economics, 18, pp. 23-35.
Bouoiyour, J. (2003). Trade and GDP Growth in Morocco: Short-Run or Long-Run Causality? Brazilian Journal of Business and Economics, 3 (2), pp. 14-21.
Central Bureau of Statistics (CBS). (2003-2010), Syria, Damascus. Available at:
http://www.cbssyr.org
Cetintas, H., & Barisik, S. (2009). Export, Import and Economic Growth: The Case of Transition Economies. Transition Studies Review, 15 (4), pp. 636-649.
Delacroix, J. (1977). The Export of Raw Materials and Economic Growth: A Cross-National Study. American Sociological Review, 42, pp. 795-808.
El-Quqa, O.M., Hasan, F., Gupta, S., & Joubaili, A. (2007). Syria Economic & Strategic Outlook. Kuwait: Global Investment House KSCC.
Esfahani, H.S., Mohaddes, K., & Pesaran, M.H. (2013). Oil Exports and the Iranian Economy. Quarterly Review of Economics and Finance, 53 (3), pp. 221-237. Esfahani, H.S., Mohaddes, K., & Pesaran, M.H. (2014). An Empirical Growth Model for Major Oil Exporters. Journal of Applied Econometrics, 29 (1), pp. 1-14.
Hamuda, A.M., Elbeidi, R.M., & Gazda, V. (2010). The Relationship between Export and Economic Growth in Libya Arab Jamahiriya. Theoretical and Applied Economics, XVII (1 (542)), pp. 69-76.
Holman, J.A., & Graves, P.E. (1995). Korean Exports and Economic Growth. Journal of Economic Development, 20 (2), pp. 45-56.
Hosseini, S.M., & Tang, C.F. (2014). The effects of oil and non-oil exports on economic growth: a case study of the Iranian economy. Economic Research-Ekonomska Istraživanja, 27 (1), pp. 427-441.
Husein, J. (2009). Export Led Growth Hypothesis: A Multivariate Cointegration and Causality Evidence for Jordan. The Journal of Developing Areas, 42 (2), pp. 253-266.
Hye, Q.M. (2012). Exports, Imports and Economic Growth in China: An ARDL Analysis. Journal of Chinese Economic and Foreign Trade Studies, 4 (1), pp. 42-55. Hye, Q.M., & Bel Haj Boubaker, H. (2011). Exports, Imports and Economic Growth: An Empirical Analysis of Tunisia. The IUP Journal of Monetary Economics, IX (1), pp. 6-21.
Ifeacho, C., Omoniyi, B.O., & Olufemi, O. B. (2014). Effects of Non-Oil Export on the Economic Development of Nigeria. International Journal of Business and Management Invention, 3 (3), pp. 27-32.
78
Export Effects on Economic Growth in Iran. Greener Journal of Economics and Accountancy, 1 (1), pp. 8-18.
Mehrara, M. (2014). The Relationship between non-oil Trade and GDP in Petroleum Exporting Countries. International Letters of Social and Humanistic Sciences, 1, pp. 63-70.
Mehrara, M., & Firouzjaee, B.A. (2011). Granger Causality Relationship between Export Growth and GDP Growth in Developing Countries: Panel Cointegration Approach. International Journal of Humanities and Social Science, 1 (16), pp. 223-231.
Merza, E. (2007). Oil Exports, Non-Oil Exports and Economic Growth: Time Series Analysis for Kuwait (1970-2004). PhD thesis, Kansas State University.
Olurankinse, F., & Bayo, F. (2012). Analysis of the Impact of Non-Oil Sector on Economic Growth. Canadian Social Science, 8 (4), pp. 244-248.
Ram, R. (1987). Exports and Economic Growth in Developing Countries: Evidence from Time-Series and Cross-Section Data. Economic Development and Cultural Change, 36, pp. 51-72.
Saad, W. (2012). Causality between Economic Growth, Export, and External Debt Servicing: The Case of Lebanon. International Journal of Economics and Finance, 4 (11), pp. 134-143.
Safdari, M., Mahmoodi, M., & Mahmoodi, E. (2011). The Causality Relationship between Export and Economic Growth in Asian Developing Countries. American Journal of Scientific Research, 25, pp. 40-45.
Sengupta, J., & Espana, J. (1994). Exports and Economic Growth in Asian Nics: An Econometric Analysis for Korea. Applied Economics, 26, pp. 41-51.
Shirazi, N.S., & Abdul-Manap, T.A. (2004). Exports and Economic Growth Nexus: The Case of Pakistan. The Pakistan Development Review, 43 (4), pp. 563-581. Syrian Investment Agency (SIA). (2009). The Fourth Annual Investment Report in Syria. Damascus: Syrian Investment Agency.
Temiz, D., & Gokmen, A. (2010). An Analysis of the Export and Economic Growth in Turkey over the Period of 1950-2009. International Journal of Economic and Administrative Studies, 3 (5), pp. 123-142.
Tyler, W. (1981). Growth and Export Expansion in Developing Countries. Journal of Development Economics, 9, pp. 121-130.
Ude, D K., & Agodi, J.E. (2014). Investigation of the Impact of Non-Oil Revenue on Economic Growth in Nigeria. International Journal of Science and Research, 3 (11), pp. 2571- 2577.