Vol.45, N. 2 : pp. 151 - 160, June 2002 ISSN 1516-8913 Printed in Brazil
BRAZILIAN ARCHIVES OF
BIOLOGY AND TECHNOLOGY
A N I N T E R N A T I O N A L J O U R N A L
Randomly Amplified Polymorphic DNA of
Trichoderma
Isolates and Antagonism Against
Rhizoctonia solani
Larissa Brandão Góes; Ana Bolena Lima da Costa; Laurineide Lopes de Carvalho Freire
and Neiva Tinti de Oliveira
∗Universidade Federal de Pernambuco-UFPE; CCB; Depto. Micologia; CEP 50.670-420; Recife - PE, Brasil
ABSTRACT
Random Amplified Polymorphic DNA (RAPD) procedure was used to examine the genetic variability among fourteen isolates of Trichoderma and their ability to antagonize Rhizoctonia solani using a dual-culture assay for correlation among RAPD products and their hardness to R. solani. Seven oligodeoxynucleotide primers were selected for the RAPD assays which resulted in 197 bands for 14 isolates of Trichoderma. The data were entered into a binary matrix and a similarity matrix was constructed using DICE similarity (SD) index. A UPGMA cluster based on SD values was generated using NTSYS (Numerical Taxonomy System, Applied Biostatistics) computer program. A mean coefficient of similarity obtained for pairwise comparisons among the most antagonics isolates was around 40%. The results presented here showed that the variability among the isolates of Trichoderma was very high. No relationship was found between the polymorphism showed by the isolates and their hardness, origin and substrata.
Key words: RAPD; Trichoderma; Rhizoctonia solani
∗ Author for correspondence
INTRODUCTION
R. solani Kühn [anamorph of Thanatephorus cucumeris (Frank) Donk], is a common pathogen for several commercial plant crops in Brazil (Bolkan & Ribeiro, 1985; Brancão & Martins, 1983). The measures preconized for its control, such as rotation of cultures, use of resistant varieties and treatment of seeds and/or soil with fungicides, a lot of times become unsuitable or not effective, mainly due to the genetic variability presented by the pathogen to the hosts range, capacity to survive in the soil and in the seeds, and physiologic flexibility to infect different hosts (Leach & Garber, 1970).
The use of antagonistic microrganisms to R. solani
has been investigated as an alternative control method, species of Trichoderma, applied as treatment of seeds or soil, have been demonstrated to control the pathogen in a variety of cultures in the greenhouse and field studies (Melo, 1991; Nelson, 1991; Papavizas, 1985; Papavizas, 1992). The ability of Trichoderma to control R. solani
varies considerably, and it is possible to improve its biological control efficiency by the selection of isolates with high antagonistic potential and adapted to certain ecological or geographical areas (Noronha et al. 1996).
(1990) and Welsh & Mc Clelland (1990) that involves simultaneous amplification of several anonymous loci in the genome using primers of arbitrary sequence has been used for genetic, taxonomic and ecological studies of several fungi (Crowhurst et al., 1995; Fungaro et al. ,1996; Manulis et al., 1993; Zinno et al., 1998; Abbasi, et al., 1999; Paavanem-Huhtala et al., 2000). Fourteen strains of Trichoderma were studied by Santos (1992), using molecular markers of RAPD among other techniques, and it was possible to verify the natural genetic variability and to divide the strains in similarity groups, as well as differentiating the original strains of different regions. Muthumeenakshi et al. (1998) characterized genetically 15 strains of T. harzianum aggressive for edible mushrooms in the United States and England using RAPD, wich were designated "T. harzianum group 4", that presented a high homogeneity degree. Comparison of molecular data of group 4 with group 2 (the causal agent of the epidemic green mold in industrial mushrooms in England) indicated that the isolates of T. harzianum group 4 were different from that of group 2. Gomez et al. (1997) analyzed the RAPD profiles of strains of T. harzianum and classified them in different groups according to their capacity for control of plant pathogenic fungi. Arisan-Atac et al. (1995) studied 11 strains of T. viride, 2 strains of Hypocrea rufa and 9 other species of Trichoderma with relation to the RAPD profile and their ability for controlling
Cryphonectriaparasitica through pairing in vitro. The results allowed the construction of a dendrogram where the strains characterized with potential for antagonize C. parasitica were gathered in very different groups. The isolate of
H. rufa was among T. viride strains with negative biocontrol capacity, what was in agreement with their non ability for antagonizing C. parasitica. Zimand et al. (1994) used RAPD markers obtained from 9 arbitrary primers to distinguish strains of
Trichoderma. Ten of the strains identified as T. harzianum exhibited similarities, and it was possible to distinguish the isolate T-39, used commercially as biocontrol agent of Botrytis cinerea. For efficient selection of strains of
Trichoderma with taxonomic finalities, Fujimori & Okuda (1993) examined 74 strains of
Trichoderma by RAPD profiles and the results were consistent with the morphological,
physiological and ecological data of these strains, what suggests that the technique can aid to eliminate strains duplicated in a program for microbial selection. Using RAPD Schlick et al.
(1994) analyzed strains of T. harzianum and mutants induced by gamma radiation originated from one wild isolate, verifying that with RAPD it was possible to differentiate all the mutants strains for at least one primer and concluding that the method was valuable for identification and fast differentiation of strains.
The genetic variability of Trichoderma isolates using the RAPD technique and their antagonistic potential against R. solani, as well as the relationship between their antagonistic capacity and RAPD profiles were analysed.
MATERIAL AND METHODS
Isolates used
Fourteen isolates of Trichoderma (six of T. viride, six of T. harzianum, one T. polysporum, one of T. pseudokoningii) and one of R. solani (isolate registered under nº 4014 from Micoteca URM,UFPE, Recife,PE,Brazil) were obtained from the Culture Collection (URM) of the Federal University of Pernambuco (UFPE), Recife, PE, Brazil and from Culture Collection of the Federal Rural University of Pernambuco (UFRPE).
Extraction and amplification of the DNA of the isolates of Trichoderma
The extraction of total genomic DNA of each isolate of Trichoderma was made as described by Raeder & Broda (1985). The primers OPA, OPR, OPX and OPW, as well as Taq DNA polimerase and the dNTPs were supplied by Operon Technologies, CA, USA. Amplification reactions were carried out in a total volume of 25 µl containing approximately 20-25 ng of template DNA, primer 0,4 µmol l-1 and MgCl2 3,0 mmol l
-1
(denaturing), 1 minute and 30 seconds at 39 °C (annealing), 2 minutes at 72 °C (extension) and finally 5 minutes to 72 °C for a final extension, during 40 cycles. After the process, samples of 22
µl of the amplification products were assayed by electrophoresis in 1,4% agarose gels, at 3 V/cm-1 of distance among the electrodes, running with TBE buffer. Gels were stained with ethidium bromide, and photographed under U.V. light. The
λDNA cut by HindIII was used as molecular weight size markers.
The NTSYS.PC (Numerical Taxonomy System Applied Biostatistics, Setauket, New York) computer program was used for data analysis. The data (band presence or absence) were introduced in the form of a binary matrix and a pairwise similarity matrix,was constructed using the DICE coefficient (SD) (Sneath & Sokal, 1973). SD values were obtained by the double number of shared bands between two patterns divided by the sum of all the bands in the same pattern (value 1 indicates identical patterns for two individuals and value 0 indicates completely different patterns). The UPGMA (Unweighted pair-group method with arithmetical averages) grouping of the SD values was generated using the NTSYS program.
Antagonistic capacity of Trichoderma isolates
The antagonism experiments were accomplished by the method described by Dennis & Webster (1971). The isolates were cultivated in Petri dishes with PDA media for seven days. Disks of 5mm of diameter were cut and removed from the growing borders of the colonies and transferred to another Petri dish with PDA. Each plate received two disks, one with Trichoderma mycelium and another with Rhizoctonia mycelium, placed at a distance of 7 cm from each other, in time intervals according the growth speed test organisms. The plates were incubated at 26°C. The experiment was entirely at random with three replicates. Classification of the isolates was based on the Bell et al. (1982) scale of antagonism classes.
RESULTS AND DISCUSSION
Primers selection
Eighty primers from the kits OPA, OPR, OPW and OPX were tested. Forty primers from OPR and OPW did not provide amplification products.
Some primers of the kits A and X amplified the tested DNA, but only seven were chosen, because they presented strong and defined bands, and consistent fragments patterns: OPA5 (5'-AGGGGTCTTG), OPA13 (5'-AGCACCCAC), OPX1 CTGGGCACGA), OPX2 (5'-TTCCGCCACC), OPX3 (5'-GGCGCAGTG), OPX7 GAGCGAGGCT) and OPX12 (5'-TCGCCAGCCA).
DNA Polimorphism analysis of the
Trichoderma isolates
A total of 197 bands were produced with the 7 primers used (Figs. 1-7). The dendrogram constructed through the method UPGMA is presented in Fig 8. For elaboration of the dendrogram, it was necessary to use lost portion for the isolate 2745, amplified by the primer OPA-5, in the attempt of avoiding a false positive result. No monomorphic bands were found, while polimorphic bands were evident.
Classification of Trichoderma isolates antagonistic to R. solani, in vitro
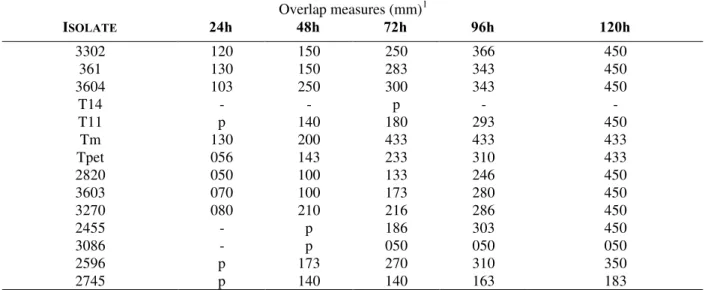
Trichoderma isolates demonstrated high antagonistic action over R. solani; the isolates of
T. harzianum were the most aggressive. The isolates of Trichoderma overlaped the colony of
R. solani with 120 hours except for the isolates 2596, 3086 and 2745. The isolates 3302, 3601and Tm, started overlaping the colony of R. solani
earlier than the other isolates. The isolate T14 (Trichoderma pseudokoningii) was not able of overlaping the colony of R. solani, but inhibited its growth (Table 1). The classification of the isolates with relation to the antagonism, and based on the overlaping of the colony, according to Bell et al. (1982) is shown in Table 2.
RAPD Profiles and the antagonism of isolates of Trichoderma against R. solani
antagonistic action than the isolate T14, in agreement with the classification of antagonism (Table 2). The isolate T14 and 3603 were in the same group in the dendrogram, although they were of different species. Arisan-Atac et al. (1995) working with RAPD of species of Trichoderma
and two strains of Hypocrea rufa antagonistic against C. parasitica, also obtained this type of contradictory result, verifying that H. rufa and T. viride were in the same group in the dendrogram. This suggested that doubts in the classic classification of species of Trichoderma existed and should be investigated with complementary information being achieved by other methods.
The technique of RAPD was efficient in demonstrating the DNA polymorphism of these isolates of Trichoderma, showing hight intraspecific genetic variability.
The similarity degree of among the samples that presented better antagonistic acting was around 40%. The dendrogram did not show grouping of the isolates by the level of antagonism. Relationships among the polymorphism existent, the aggressiveness and the origin of the isolates were not found.
Table 1 - Measures of overlap of colonies of Trichoderma isolates on colonies of R. solani
Overlap measures (mm)1
ISOLATE 24h 48h 72h 96h 120h
3302 120 150 250 366 450
361 130 150 283 343 450
3604 103 250 300 343 450
T14 - - p - -
T11 p 140 180 293 450
Tm 130 200 433 433 433
Tpet 056 143 233 310 433
2820 050 100 133 246 450
3603 070 100 173 280 450
3270 080 210 216 286 450
2455 - p 186 303 450
3086 - p 050 050 050
2596 p 173 270 310 350
2745 p 140 140 163 183
1
Media of three repetitions p = Moment of the encounter of the colonies
Table 2 - Classification of Trichoderma isolates antagonism against R. solani isolate
ANTAGONISM CLASS 1 ISOLATE Nº OF ISOLATES
1 3302, 3601, 3604, T11, Tm, Tpet, 2820, 3603, 3270, 2455
10
2 2596, 2745 2
3 T14, 3086 2
4 0
5 0
1
Classes of antagonism (based on Bell et al., 1982): 1-Trichoderma grew and overlap the colony of R. solani and the whole surface of the media; 2-Trichoderma grew and it covered 2/3 of the surface of the media; 3-Trichoderma and R. solani
colonized each one half of the surface of the media and didn’t have dominance; 4-R. solani grew and it covered 2/ 3 of the
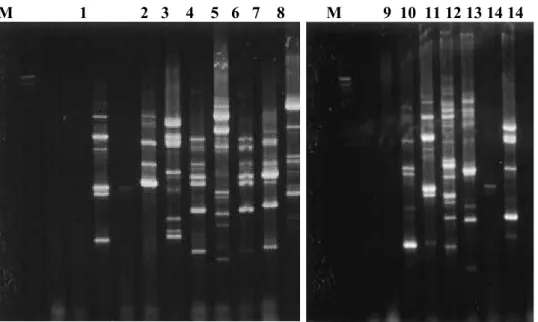
Figure 1 - Trichoderma isolates RAPD profiles obtained with OPA 5. primer. Positions 1-8 corresponding to isolates 3086, 3270, 3302, 3601, 3603, 3604, T11 e T14, respectively and positions 9-14 corresponding to isolates Tm, Tpet, 2455, 2596, 2745, 2820, respectively. Molecular weight size markers (λ DNAcutby Hind III) in base pairs are indicated by M.
Figure 2 - Trichoderma isolates RAPD profiles obtained with OPA 13. primer. Positions 1-11 correspondig to isolates 3086, 3270, 3302, 3601, 3603, 3604, T11 e T14, respectively and positions 9-14 corresponding to isolates Tm, Tpet, 2455, 2596, 2745, 2820, respectively. Molecular weight size markers (λ DNAcutby Hind III) in base pairs are indicated by M.
M 1 2 3 4 5 6 7 8 M 9 10 11 12 13 14 14
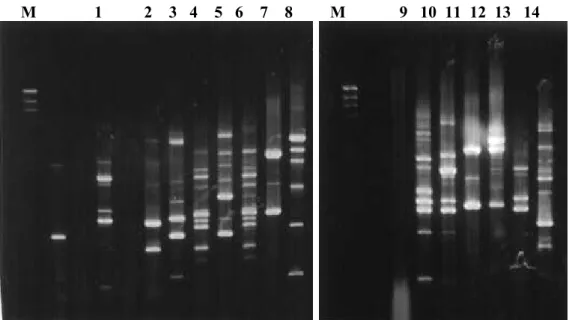
Figure 3 - Trichoderma isolates RAPD profiles obtained with OPX1 primer. Positions 1-8 corresponding to isolates 301-86, 3270, 3302, 3601, 3603, 3604, T11 e T14, respectively and positions 9-14 corresponding to isolates Tm, Tpet, 2455, 2596, 2745, 2820, respectively. Molecular weight size markers ((λ DNAcutby Hind III)) in base pairs are indicated by M.
Figure 4 - Trichoderma isolates RAPD profiles obtained with OPX2 primer. Positions 1-8, corresponding to isolates 3086, 3270, 3302, 3601, 3603, 3604, T11 e T14, respectively and positions 9-14, corresponding to isolates Tm, Tpet, 2455, 2596, 2745, 2820, respectively. Molecular weight size markers ((λ DNAcutby Hind III)) in base pairs are indicated by M.
M 1 2 3 4 5 6 7 8 M 9 10 11 12 13 14
Figure 5 - Trichoderma isolates RAPD profiles obtained with OPX3 primer. Positions 1-8, corresponding to isolates 3086, 3270, 3302, 3601, 3603, 3604, T11 e T14, respectively and positions 9-14, corresponding to isolates Tm, Tpet, 2455, 2596, 2745, 2820, respectively. Molecular weight size markers ((λ DNAcutby Hind III)) in base pairs are indicated by M.
Figure 6 - Trichoderma isolates RAPD profiles obtained with OPX7 primer. Positions 1-8, corresponding to isolates 3086, 3270, 3302, 3601, 3603, 3604, T11 e T14, respectively and positions 9-14, corresponding to isolates Tm, Tpet, 2455, 2596, 2745, 2820, respectively. Molecular weight size markers ((λ DNAcutby Hind III)) in base pairs are indicated by M. M 1 2 3 4 5 6 7 8 M 9 10 11 12 13 14
Figure 7 - Trichoderma isolates RAPD profiles obtained with OPX12 primer. Positions 1-8, corresponding to isolates 3086, 3270, 3302, 3601, 3603, 3604, T11 e T14, respectively and positions 9-14 corresponding to isolates Tm, Tpet, 2455, 2596, 2745, 2820, respectively. Molecular weight size markers ((λ DNA cut by Hind III)) in base pairs are indicated by M.
0,00 0,25 0,50 0,75 1,00
3086 3270 3601 3604
T11 3302 Tm 2820 3603 T14 Tpet 2745 2455
2596
Figure 8 - UPGMA dendrogram based on the DICE similarity index (SD) illustrating the genetic relationships among 14 Trichoderma isolates .
RESUMO
A técnica de RAPD (Random Amplified Polymorphic DNA) foi utilizada para examinar a variabilidade genética em quatorze isolados de
Trichoderma além de sua capacidade de antagonizar o fungo fitopatogênico Rhizoctonia solani usando pareamento in vitro, e a possível relação entre perfís de RAPD e agressividade dos isolados de Trichoderma a R. solani. Foram selecionados sete primers para os ensaios de RAPD, os quais produziram 197 bandas. Os dados foram introduzidos no programa de computador NTSYS (Numerical Taxonomy System, Applied Biostatistics)na forma de uma matrix binária, sendo construída uma matriz de similaridade utilizando-se o coeficiente de similaridade de DICE (SD) e baseado nos valores SD, pelo método de agrupamento UPGMA um dendrograma. Observou-se que o grau de similaridade das amostras que apresentaram melhor desempenho antagônico foi bastante baixo, em torno de 40%. Os resultados demonstraram que a variabilidade entre os isolados de Trichoderma é muito alta. Aparentemente não foi demonstrada nenhuma relação entre o perfil de RAPD obtido e o nível de antagonismo dos isolados de Trichoderma
nem agrupamento em função da origem dos isolados ou substrato.
REFERENCES
Abbasi, P. A.; Miller, S. A.; Meulia, T.; Hoitink, H. A. J. and Kim, J. M. (1999) Precise detection and tracing of Trichoderma hamatum 382 in compost-amended potting mixes by using molecular markers. Applied and Environmental Microbiology,
65 : (12), 5421-5426.
Arisan-Atac, I.; Heidenreich, E. and Kubicek, C. P. (1995), Randomly amplified polymorphic DNA fingerprinting identifies subgroups of Trichoderma viride and other Trichoderma sp. capable of chestnut blight biocontrol. FEMS Microbiology Letters, 126, 249-256.
Bell, D. K.; Well, H. D. Markhabell, D. K. and Wells, C. R. (1982), In vitro antagonism of
Trichoderma species against six fungal plant pathogens. Phythopatology, 72 : (4), 379-382.
Bolkan, H. A. and Ribeiro, W. R. C. (1985), Anastomosis groups and pathogenicity of
Rhizoctonia isolates from Brasil. Plant Disease, 69 : (7), 599-601.
Brancão, N. and Martins, R. M. (1983), Levantamento de doenças de beterraba açucareira (Beta vulgaris L.). Fitopatologia Brasileira, 8, 592.(Resumos).
Chet, I. (1990), Biological control of soil-borne plant pathogens with fungal antagonists in combination with soil treatments. In:. Biological control of
soil-borne plant pathogens. Hornby, D.
(Ed.)Wallingford: CAB International, pp. 15-25. Crowhurst, R. N.; King, F. Y.; Hawthorne, B. T.;
Sanderson, F.R. and Choi-Pheng, Y. (1995), Rapd characterization of Fusarium oxysporum associated with wilt of angsana (Pterocarpus indicus) in Singapore. Mycological Research, 99 : (1), 14-18. Dennis, C. J. and Webster, J. (1971), Antagonism
properties of species groups of Trichoderma, III. Hyphal interaction. Transactions British Mycological Society, 57, 363-369.
Fungaro, M. H. P.; Vieira, M. L. C.; Pizzarani-Kleiner, A. A. and Azevedo, J. L. (1996), Diversity among soil and insect isolates of Metarhizium anisopliae var. anisopliae detected by RAPD.
Letters in Applied Microbiology, 22, 389-392. Fugimori, F. and Okuda, T. (1993), Aplication of the
random amplified polymorphic DNA using the polymerase chain reaction for efficient elimination of duplicate strains in microbial screening. The Journal of antibiotics, 47 : (2), 173-182.
Gomez, I.; Chet, I. and Herreraestrela, A., (1997), Genetic diversity and vegetative compatibility among Trichoderma harzianum isolates. Molecular & General Genetics, 256, 127-135.
Leach, L. D. and Garber, R. H. (1970), Control of
Rhizoctonia solani In -Rhizoctonia solani: Biology and pathology. Parmeter, J. R., (ed.), Berkeley: The University of California Press, pp. 189-199. Manulis, S.; Kogan, N.; Reuven, M. and Ben-Yephet,
Y. (1993), Use of the RAPD technique for identification of Fusarium oxysporum f. sp. dianthi
from carnation. Phytopathology, 84 : (1), 98-101. Melo, I. S. (1991), Potencialidade da utilização de
Trichoderma spp., no controle biológico de
doenças de plantas. In - Controle biológico de doenças de plantas. Bettiol, W., (Org.) Jaguariúna: EMBRAPA-CNPDA, pp. 135-156. (EMBRAPA-CNPDA. Documentos; 15).
Nelson, E. B. (1991), Current limits to biological control of fungal phytopathogens. In: Handbook of applied mycology-Soil and plants. Arora, D. K.; Rai, B.; Mukerji, K. G.; Knudsen, G., (Eds.) New York: Marcell Dekker, 1, 327-355.
Noronha, M. A.; Sobrinho, S. A.; Silveira, N. S. S; Michereff, S. J.; Mariano, R. L. R. and Maranhão, E. (1996), Seleção de isolados de Trichoderma spp. para o controle de Rhizoctonia solani em feijoeiro.
Summa Phytopathologica, 22, 156-162.
Paavanem-Huhtala, S.; Avikainem, H. and Yli-Mattila, T. (2000), Development of strain-specific primers for a strain of Gliocladium catenulatum
used in biological control, 106 : (2), 187-198. Papavizas, G. C. (1985), Trichoderma and
Gliocladium: Biology and potential for biocontrol.
Annual Review of Phytopathology, 23, 23-54. Papavizas, G. C. (1992), Biological control of
selected soilborne plant pathogens with
Gliocladium and Trichoderma. In - Biological control of plant diseases Tjamos, E. C., Papavizas, G. C., Cook, R. J., (Eds.). New York: Plenum Press, pp 223-230,
Raeder, U. and Broda, P. (1985), .Rapid preparation of DNA from filamentous fungi. Letters in Applied Microbiology, 1, 17-20.
Santos, I. C. (1992), Avaliação da variabilidade genética de Trichoderma por isoenzimas, RFLP e RAPD. Piracicaba-SP,. thesis- São Paulo University ,Escola Superior de Agricultura "Luiz de Queiroz" (ESALQ), Brazil.
Schlick, A.; Kuhls, K.;Meyer, W.; Lieckfeldt, E.; Börner, T. and Messner, K. (1994), Fingerprinting reveals gamma-ray induced mutations in fungal DNA: implications for identification of patent strains of Trichoderma harzianum. Current Genetic, 26, 74-78.
Sneath, P. H. A. and Sokal, R. R. (1973), Numerical Taxonomy: The Principles and Pratice of Numerical Classification. San Francisco: Freeman, 573 pp.
Welsh, J. and McClelland, M. (1990), Fingerprinting genomes using PCR with arbitrary primers. Nucleic Acids Research, 18, 7213-7218.
Zimand, G.; Valinsky, L.; Elad, Y.; Chet, I. and Manulis, S. (1994), Use of the RAPD procedure for the identification of Trichoderma strains.
Mycological Research, 98 : (5), 531-534.
Zinno, T. D.; Longrée, H. and Maraite, H. (1998), Diversity of Pyrenophora tritici-repentis isolates from warm wheat growin atreas: pathogenicity, toxin production and RAPD analysis. In
-Helminthosporium blights of wheat: spot blotch and tan spot. Duveiller et al. (eds.), Mexico, D.F.: CIMMYT, pp. 302-311.