EXTREME HOMOGENEITY AMONG BRAZILIAN WHEAT GENOTYPES
DETERMINED BY RAPD MARKERS
1LORETA BRANDÃO DE FREITAS2, LEANDRO JERUSALINSKY3, SANDRO LUIS BONATTO4 and FRANCISCO MAURO SALZANO5
ABSTRACT - Random amplified polymorphic DNA markers (RAPD) were used to estimate the variability of 14 genotypes of Brazilian wheat (Triticum aestivum L.), using a set of 50 random 10-mer primers. A total of 256 reproducibly scorable DNA amplification products were obtained from 48 of the primers, 83% of which were polymorphic. Genetic distances among genotypes were calculated and a dendrogram and a principal coordinates analysis showing the genetic relationships among them were obtained. Despite the low variability found (average genetic distance of 27%), two groups of genotypes could be identified, which probably reflect how they were formed. Studies such as this one may be important in the planning and development of future improvement programs for this plant species.
Index terms: Triticum aestivum, genetic variation, polymorphism, breeding methods.
EXTREMA HOMOGENEIDADE ENTRE GENÓTIPOS BRASILEIROS DE TRIGO DETERMINADA POR MARCADORES DE “RAPD”
RESUMO - Marcadores de RAPD (Random amplified polymorphic DNA) foram utilizados para estimar o grau de variabilidade genética entre 14 genótipos de trigo (Triticum aestivum L.) cultivados no Brasil, usando um conjunto de 50 “primers” aleatórios de 10 pares de bases (pb). Um total de 256 fragmentos de amplificação foram obtidos de 48 dos “primers” analisados. Destes, 83% eram polimórficos. Foram estimadas as distâncias genéticas entre os genótipos e a análise de um dendrograma e das coordenadas principais mostraram as relações genéticas entre eles. A despeito do baixo índice de varia-bilidade genética observado entre os genótipos (distância genética média de 27%), estes puderam ser reunidos em dois grupos, provavelmente relacionados à sua ancestralidade. Estudos como este podem ser importantes no planejamento e desenvolvimento de programas futuros para melhoramento desta espécie de planta.
Termos para indexação: Triticum aestivum, variação genética, polimorfismo, métodos de melhoramento.
1Accepted for publication on February 2, 2000.
2Biologist, Ph.D., Associate Professor, Dep. de Genética, Instituto de Biociências (IB), Universidade Federal do Rio Grande do Sul (UFRGS), Caixa Postal 15053, CEP 91501-970 Porto Alegre, RS. E-mail: [email protected] 3Biologist, Dep. de Genética, IB, UFRGS.
E-mail: [email protected]
4Biologist, Ph.D., Associate Professor, Faculdade de Biociências, Pontifícia Universidade Católica do Rio Gran-de do Sul, Av. Ipiranga 6690, CEP 90619-900 Porto Alegre, RS. E-mail: [email protected]
5Biologist, Ph.D., Dep. de Genética, IB, UFRGS. E-mail: [email protected]
INTRODUCTION
(Graham
&
McNicol, 1995),
Allium
(Maab
&
Klaas,
1995),
Zea
(Lanza et al., 1997), and
Manihot
(Colombo
et al., 1998). Its technical simplicity has facilitated its
use in the analysis of genetic variability, with results
being successfully correlated with established
relationships based on pedigree records (Kresovich
et al., 1992; Yang
&
Quiros, 1993; Stiles et al., 1993;
Liu et al., 1994).
Triticum aestivum
is an autogamous
and hexaploid species that is largely used in human
nutrition and had been intensely cultivated and
improved.
In this paper RAPD markers were used to evaluate
the variability and interrelationships of 14 Brazilian
wheat genotypes.
MATERIAL AND METHODS
Wheat genotypes
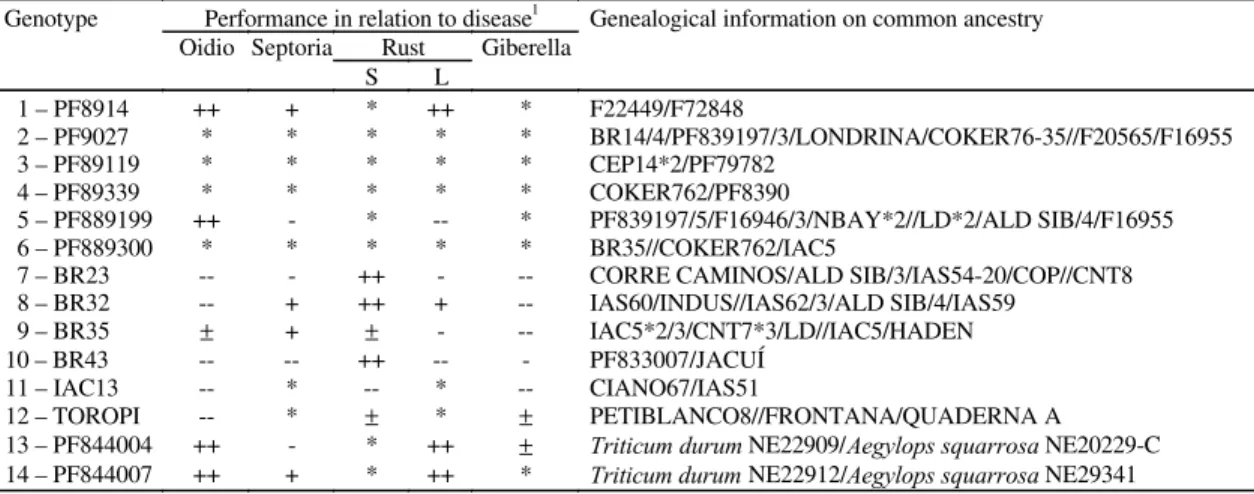
Fourteen Brazilian genotypes were supplied by the Embrapa-Centro Nacional de Pesquisa do Trigo, Passo Fundo, RS, Brazil: PF 8914, PF 9027, PF 89119, PF 89339, PF 889199, PF 889300, BR 23, BR 32, BR 35, BR 43, IAC 13, TOROPI, PF 844002, and PF 844007 (Table 1). These genotypes had been analyzed for other parameters, and were being used in experimental assay net or had been recommended for cultivation. Therefore, the results obtained could be compared with other types of data, providing a global assessment of the problems considered.
DNA template
High-molecular-weight genomic DNA was extracted from leaves of 21 day-old plants developed in a growth chamber. The DNA extraction procedure was described by Roy et al. (1992). About 0.5 g of tissue was ground in liquid nitrogen and incubated with a lyses buffer (100 mM TRIS, 1.4 mM NaCl, 20 mM EDTA, 2% CTAB, 0.2% beta-mercaptoethanol) at 65oC for 30 minutes. The
resulting slurry was then treated with chloroform:isoamyl alcohol (24:1) and centrifuged at 12,000 rpm for 15 minutes. The aqueous phase was separated, and DNA was then precipitated from it using an equal volume of isopropanol and 1/10 volume 3M C2H3O2Na, pelleted, and suspended
in sterile water.
RAPD materials
Fifty arbitrarily designed primers of ten deoxyribonucleotides were obtained from the Biotechnology Laboratory of British Columbia, Canada (primers nos. 201-250). The Taq DNA polymerase, plus the 10x concentrated PCR buffer, was supplied by the Biotechnology Center, Universidade Federal do Rio Gran-de do Sul, while the dNTPs sets were obtained from Amersham. Amplifications were carried out in a Perkin-Elmer Cetus DNA Thermal Cycler.
Amplification conditions
The amplification conditions were rigorously tested in optimization experiments. A standard procedure was
TABLE 1. Wheat performance in relation to diseases and genealogical information on the genotypes investigated (Embrapa-CNPT).
Performance in relation to disease1
Genealogical information on common ancestry Oidio Septoria Rust Giberella
Genotype
S L
1 – PF8914 ++ + * ++ * F22449/F72848
2 – PF9027 * * * * * BR14/4/PF839197/3/LONDRINA/COKER76-35//F20565/F16955 3 – PF89119 * * * * * CEP14*2/PF79782
4 – PF89339 * * * * * COKER762/PF8390
5 – PF889199 ++ - * -- * PF839197/5/F16946/3/NBAY*2//LD*2/ALD SIB/4/F16955 6 – PF889300 * * * * * BR35//COKER762/IAC5
7 – BR23 -- - ++ - -- CORRE CAMINOS/ALD SIB/3/IAS54-20/COP//CNT8 8 – BR32 -- + ++ + -- IAS60/INDUS//IAS62/3/ALD SIB/4/IAS59
9 – BR35 ± + ± - -- IAC5*2/3/CNT7*3/LD//IAC5/HADEN 10 – BR43 -- -- ++ -- - PF833007/JACUÍ
11 – IAC13 -- * -- * -- CIANO67/IAS51
12 – TOROPI -- * ± * ± PETIBLANCO8//FRONTANA/QUADERNA A 13 – PF844004 ++ - * ++ ± Triticum durum NE22909/Aegylops squarrosa NE20229-C
arrived at, based on Williams et al. (1990) protocol. The PCR volume was 25 µL and contained 0.2 µM primer, 0.2 mM dNTPs, 2.5 U of Taq DNA polymerase, 1x PCR buffer (10 mM TRIS-HCI pH 8.3, 1.5 mM MgCl2, 50 mM
KCl), and 10 ng template DNA. During the manipulation the tubes were kept on ice. The reaction mixtures were overlaid with mineral oil and subjected to PCR. Standard amplifications were performed at 45 cycles of 30 sec at 94oC, 30 sec at 35oC, and 30 sec at 72oC. After the last
cycle, the samples were kept at 72oC for additional 5 min
and then cooled to 4oC. Samples of 10 µL were analyzed
by electrophoresis on a 1.5% agarose gel, and the amplified products were detected with ethidium bromide staining.
Data analysis
Estimates of genetic distances were calculated by the King et al. (1993) method, and the dendrogram obtained by neighbor-joining (Saitou & Nei, 1987), using the Treecon for Windows package (Peer & Wachter, 1994).
RESULTS AND DISCUSSION
As previously mentioned, fifty arbitrary decamer
primers were screened for their suitability to detect
variation in PCR reactions with Brazilian wheat DNA
templates. Of these, 48 amplified DNA, and 83%
amplified polymorphic products. A total of 256 bands
from 320 to 570 bp in size were scored as being present
or absent per primer reaction. Each primer amplified
two to ten bands, the majority producing four
fragments. All of these markers showed the same
pattern in three separate RAPD runs, for which the
same amplification conditions have been used.
Representative examples of runs are shown in Fig. 1.
The average genetic distance among these
genotypes, based on RAPD data, was 27%, the lowest
value being 14% between genotypes 11 and 12
(Table 2), and the highest, 40% between genotypes
3 and 11. This homogeneity of 73% is probably due
to the fact that all the wheat genotypes used in Brazil
have a common origin. Similar (though not as extreme)
RAPD results were also obtained with British (Devos
&
Gale, 1992) or USA (He et al., 1992) varieties, but
Sun et al. (1998) also found extreme homogeneity
(79% to 88%, using 32 arbitrary primers) among
respectively Chinese winter and spring common
wheat. He et al. (1992) combined RAPD analysis with
the DGGE (denaturing gradient gel electrophoresis)
technique, and even with this potentially more
discriminating combination obtained an overall
similarity index of 62%. Quantitative estimates of
genetic homogeneity based on RAPD markers were
obtained by Lanza et al. (1997) in maize (37%), Graham
&
McNicol (1995) in
Rubus
(61%), Williams & St. Clair
(1993) in tomato (63%), and Colombo et al. (1998) in
Manihot
(65%). The homogeneity observed in
wheat, especially in Brazil, should be a question of
concern to breeders, since it can lead to generalized
liability to diseases and other noxious agents.
The dendrogram obtained from the genetic
distances shows two distinct groups (group 1,
genotypes 1, 2, 3, 5, 7 and 8; group 2, genotypes 4, 6,
9, 10, 11, 12, 13 and 14) that are internally rather
homogeneous (Fig. 2). The principal coordinates data
confirm this result (Fig. 3). Attempts to relate these
groups to characteristics of agronomic value,
specially reaction to diseases, were unsuccessful.
For instance, genotypes 11 and 12, which associated
closely in the dendrogram, show a completely
different behavior in relation to the stem rust disease,
genotype 11 being susceptible and genotype 12
partially resistant to this fungus infection. Other high
indices of similarity were found between genotypes
who had one or more common ancestors (for
instance, genotypes 6 and 4, or 7 and 8). The
relationships observed, therefore, may reflect more
the history of genotype formation than any other
factor.
Since the onset of civilization, plant diseases have
had catastrophic effects on crops and the well-being
of human populations. Infectious plant diseases
con-tinue to cause human suffering and enormous
economic losses. Increasing human population and
decreasing amounts of land available for agriculture
make all approaches to securing the world food
supply critical. Protection of crops from disease can
substantially improve agricultural production.
Although pesticides have successfully controlled
disease, their continued and increasing use will have
harmful effects on our health and the environment.
Use of high-yield crop varieties can also improve
productivity, but carries a risk – such genetically
uniform varieties cultivated over enormous areas are
susceptible to devastating epidemics. Thoughtful
application to the plants own defense mechanisms,
combined with additional genetic variability, can lead
to more effective protection against plant pathogens
(Baker et al., 1997).
TABLE 2. Genetic distances matrix obtained from the randon amplified polymorphic DNA (RAPD) results using 48 primers in 14 Brazilian wheat genotypes.
Genotype 1 2 3 4 5 6 7 8 9 10 11 12 13
2 0.254 3 0.279 0.233 4 0.258 0.282 0.290 5 0.253 0.226 0.277 0.212 6 0.286 0.260 0.300 0.167 0.250 7 0.266 0.240 0.289 0.261 0.239 0.255 8 0.286 0.259 0.310 0.279 0.231 0.290 0.210 9 0.296 0.294 0.302 0.170 0.261 0.209 0.257 0.267 10 0.287 0.286 0.302 0.204 0.251 0.171 0.256 0.291 0.174 11 0.327 0.324 0.395 0.214 0.316 0.216 0.280 0.346 0.227 0.191 12 0.338 0.319 0.361 0.257 0.343 0.243 0.306 0.317 0.220 0.227 0.137 13 0.300 0.273 0.364 0.333 0.330 0.287 0.284 0.304 0.313 0.313 0.296 0.256 14 0.298 0.327 0.360 0.250 0.319 0.252 0.274 0.293 0.263 0.254 0.237 0.288 0.266
FIG . 2. Dendrogram obtained from the genetic distances calculated between the 14 Brazilian wheat genotypes. Numbers on the nodes are bootstrap values.
There is an increasing awareness that variability
profoundly affects host-parasite interactions.
Variability should therefore be considered in the
design of programs to control diseases and should
influence decisions about the establishment and
management of natural reserves for endangered
species. One of the problems in doing so is that
variability occurs at several levels of biological
organization: among populations, within populations
and within individuals. The question is to decide
which of these levels is the most relevant for the
dynamics and evolution of disease. Because each
level has a qualitatively different effect on the
host-parasite relationships, it seems unlikely that there
will be a simple and general answer to this question
(Schmid-Hempel
&
Koella, 1994). In the case of
organisms of economic interest, the situation is
6 4 10
9 12 11 14
13 8
7 5
1 3 72
2 61
50 71
53
0.1
worsened, since the type of genetic improvement
employed to obtain varieties and races may lead to a
disequilibrium in the relationship between defense
and attack developed in the course of the
evolutionary history of organisms. Human
intervention could lead to the extinction of defense
genes whose secondary effects may affect yield.
Additional genetic variability should be sought
for wheat genotypes, either through related species
or by genetic engineering, with the objective of
improving the potential of defense against diseases
of this important cultivated plant. Sun et al. (1998)
suggest crosses with the Tibetan wheat. This
subspecies has a high level of genetic heterogeneity
and is easily crossable with other wheat, yielding
highly fertile F
1.
CONCLUSION
Seventy eight percent of the RAPD bands are
shared by the analyzed genotypes.
ACKNOWLEDGMENTS
To Ariano Prestes, Maria Irene B. Moraes
Fernandes, and Sandra P. Brammer, from
Embrapa-FIG . 3. Principal coordinates analysis applied to the genetic distances matrix obtained from 14 Brazilian wheat genotypes.
12
11
13
14 10
9 6
4 7
1 2
5 3
8 RAPD
a = 19; b = 31; r = 99,0
Centro Nacional de Pesquisa de Trigo, for the
provision of material and information; to Suzana
Cavalli-Molina of our Department, for laboratory
space; to Programa de Apoio a Núcleos de
Excelên-cia (PRONEX), FinanExcelên-ciadora de Estudos e Projetos
(FINEP), Conselho Nacional de Desenvolvimento
Científico e Tecnológico (CNPq), Fundação de
Am-paro à Pesquisa do Estado do Rio Grande do Sul
(FAPERGS), and Pró-Reitoria de Pesquisa,
Universi-dade Federal do Rio Grande do Sul
(PROPESQ-UFRGS) for research grants.
REFERENCES
ABO-ELWAFA, A.; MURAI, K.; SHIMADA, T. Intra and inter-specific variations in Lens revealed by RAPD markers. Theoretical and Applied Genetics,
Berlin, v.90, p.335-340, 1995.
BAKER, B.; ZAMBRYSKI, P.; STASKAWICZ, S.P.; DINESH-KUMAR, S.P. Signaling in plant-microbe interactions. Science, Washington,v.276, p.726-733,
1997.
BRUMMER, E.C.; BOUTON, J.H.; KOCHERT, G. Analysis of annual Medicago species using RAPD markers. Genome, Ottawa, v.38, p.362-367, 1995.
COLOMBO, C.; SECOND, G.; VALLE, T.L.; CHARRIER, A. Genetic diversity characterization of cassava cultivars (Manihot esculenta Crantz). I. RAPD markers. Genetics and Molecular Biology, Ribeirão Preto, v.21, p.105-113, 1998.
DEVOS, K.M.; GALE, M.D. The use of random amplified polymorphic DNA markers in wheat. Theoretical and Applied Genetics, Berlin, v.84, p.567-572,
1992.
GRAHAM, J.; McNICOL, R.J.An examination of the ability of RAPD markers to determine the relationships within and between Rubus species. Theoretical and Applied Genetics, Berlin, v.90, p.1128-1132, 1995.
HE, S.; OHM, H.; MACKENZIE, S. Detection of DNA sequence polymorphisms among wheat varieties.
Theoretical and Applied Genetics, Berlin, v.84,
p.573-578, 1992.
KAZAN, K.; MANNERS, J.M.; CAMERON, D.F. Inheritance of random amplified polymorphic DNA markers in an interspecific cross in the genus Stylosanthes. Genome, Ottawa, v.36, p.145-156,
1993.
KING, G.; NIENHUIS, J.; HUSSEY, C.Genetic similarity among ecotypes of Arabidopsis thaliana estimated by analysis of restriction fragment length polymorphisms. Theoretical and Applied Genetics, Berlin, v.86, p.1028-1032, 1993.
KRESOVICH, S.; WILLIAMS, J.G.K.; McFERSON, J.R.; ROUTMAN, E.J.; SCAAL, B.A. Characterization of genetic identities and relationships of Brassica oleraceae L. via a random amplified polymorphic DNA assay. Theoretical and Applied Genetics,
Berlin, v.85, p.190-196, 1992.
LANZA, L.L.B.; SOUZA JUNIOR, C.L. de; OTTOBONI, L.M.M.; VIEIRA, M.L.C.; SOUZA, A.P. Genetic distance of inbred lines and prediction of maize single-cross performance using RAPD markers.
Theoretical and Applied Genetics, Berlin,v.94,
p.1023-1030, 1997.
LIU, Z.W.; JARRET, R.L.; DUNCAN, R.R.; KRESOVICH, S.Genetic relationships and variation of ecotypes of seashore paspalum (Paspalum vaginatum) determined by random amplified polymorphic DNA markers. Genome, Ottawa, v.37,
p.1011-1017, 1994.
MAAB, H.I.; KLAAS, M.Intraspecific differentiation of garlic (Allium sativum L.) by isozyme and RAPD markers. Theoretical and Applied Genetics, Berlin,
v.9, p.189-197, 1995.
N’GORAM, J.A.K.; LAURENT, V.; RISTERUCCI, A.M.; LANAUD, C.Comparative genetic diversity studies of Theobroma cacao L. using RFLP and RAPD markers. Heredity, Oxford,v.73, p.589-597,
1994.
PEER, Y. van de; WACHTER, R.de.Treecon for windows: a software package for the construction and drawing of evolutionary trees for the Microsoft Windows
environment. Computer Applications in the Biosciences, Oxford, v.10, p.569-570, 1994.
ROY, A.; FRASCARIA, N.; MacKAY, J.; BOUSQUET, J.Segregating random amplified polymorphic DNAs (RAPDs) in Betula alleghaniensis. Theoretical and Applied Genetics, Berlin, v.85, p.173-180, 1992.
SAITOU, N.; NEI, M.The neighbor-joining method: a new method for reconstructing phylogenetic trees.
Molecular Biology and Evolution, Lawrence, v.4,
p.406-425, 1987.
SCHMID-HEMPEL, P.; KOELLA, J.C. Variability and its implications for host-parasite interactions.
Parasitology Today,Oxford, v.10, p.98-102,1994.
STILES, J.I.; LEMME, C.; SONDUR, S.; MORSHIDI, M.B.; MANSHARDT, R.Using randomly amplified polymorphic DNA for evaluating genetic relationships among papaya cultivars. Theoretical and Applied Genetics, Berlin, v.85, p.976-984,
1993.
SUN, G.L.; DÍAZ, O.; SALOMON, B.; Bothmer, R. von. Microsatellite variation and its comparison with allozyme and RAPD variation in Elymus fibrosus (Schrenk) Tzvel. (Poaceae). Hereditas, Lund, v.129,
p.275-282, 1998.
WILLIAMS, C.E.; ST. CLAIR, D.A. Phenetic relationships and levels of variability detected by restriction fragment length polymorphism and random amplified polymorphic DNA analysis of cultivated and wild accessions of Lycopersicon esculentum. Genome, Ottawa, v.36, p.619-630, 1993.
WILLIAMS, J.G.K.; KUBELIK, A.R.; LIVAK, K.J.; RAFALSKI, J.A.; TINGEY, S.V. DNA polymorphisms amplified by arbitrary primers are useful as genetic markers. Nucleic Acids Research,
Oxford, v.18, p.6531-6535, 1990.