Vol.48, n. 5 : pp. 807-814, September 2005
ISSN 1516-8913 Printed in Brazil BRAZILIAN ARCHIVES OF BIOLOGY AND TECHNOLOGY
A N I N T E R N A T I O N A L J O U R N A L
Aerial Line Transect Survey to Estimate Abundance of
Marsh Deer (
Blastocerus dichotomus
) (Illiger, 1815)
Artur Andriolo
1*, Ubiratan Piovezan
2, Mateus José Rodrigues Paranhos da Costa
3, Jeff
Laake
4and José Maurício Barbanti Duarte
31
Departamento de Zoologia; Instituto de Ciências Biológicas; Universidade Federal de Juiz de Fora; 36036; Campus Universitário; Juiz de Fora - MG - Brasil. 2EMBRAPA; Programa de Pós-Graduação em Ecologia; Universidade de Brasília; Corumbá - DF - Brasil. 3Departamento de Zootecnia; Faculdade de Ciências Agrárias e Veterinárias de Jaboticabal; Universidade Estadual Paulista; Jaboticabal - SP - Brasil. 4 National Marine Mammal Laboratory/NOAA; Seattle - WA - USA
ABSTRACT
The objective was to estimate abundance of marsh deer in the Paraná River basin of this work. The results provided information to support further analysis of the impact of the Porto Primavera flooding lake over population. Sixty-nine animals were recorded by aerial survey using distance sampling methodology. Animals were widely distributed throughout the study area. The uncorrected data resulted in a estimate density of 0.0035 ind/ha and a population size of 636 individuals. Correcting the
g
ˆ
(
0
)
for the animals that could be missed the calculated abundance was 896 (CV=0.27) individuals. This methodology was applied with success to survey marsh deer. The result was important to evaluate the marsh deer status in the area, and for future analysis of the impact of the flooding dam.Key words: Abundance, Aerial Survey, Blastocerus dichotomus, marsh deer, Distance Sampling
*
Author for correspondence
INTRODUCTION
The environmental destruction, hunting and diseases have threatened the marsh deer, the largest cervid in South America. This species inhabits extensive riverside flat marsh areas however, its occurrence areas have depleted drastically, jeopardizing its survival (Wemmer, 1998). The occurrence of this species in Brazil is restricted to Northern, Western, and Southeastern regions. Pinder (1994) estimated the Brazilian population of marsh deer at 50,950 animals, with only 1,300 animals in protected areas. The marsh deer is listed as endangered in Brazil and need the protection of effective management programmes (Mourão et al., 2000). Currently, its range is
shrinking and becoming fragmented because savanna and marsh landscapes are being covered to cultivated lands in Central and South Brazil, and riverine habitats are being flooded specially in Southeast (Pinder, 1994). Furthermore, the construction of dams with large reservoirs for electrical energy production is causing habitat reduction.
(2001) in the Pantanal, MS, Brazil. Mourão and Campos (1995) and Pinder (1996) have estimated the abundance of marsh deer at the Paraná River basin using helicopter. Aerial surveys using fixed-wing aircraft associated with the line transect distance sampling methodology have been extensively used to study distribution and to estimate abundance of terrestrial ungulates (Guenzel, 1986, 1994; Firchow et al., 1990; Johnson et al., 1991). This technique provides accurate estimates, which are corrected for animals that should have been detected using data obtained during each survey. It provides confidence intervals and other measures to evaluate the reliability of estimates and is generally inexpensive and less time consuming than traditional trend counts (Guenzel, 1994). Despite the drastic environmental destruction, little is known about the marsh deer ecology and behavior in natural conditions, specially diet and habitat requirements (Tomas and Salis, 2000). In addition, there is no consistent evaluation of the impacts
caused by flooding dams. Our objective was to estimate the marsh deer abundance in the Paraná River basin and discuss the line transect distance sampling methodology.
MATERIAL AND METHODS
Aerial Survey Methods
Between 6 and 11 of September 1998, a fixed wing flat window aircraft (Cesna 172) was used to survey the transect lines along the Paraná River basin (250 km) between the Porto Primavera and Jupiá dams. The study area was not homogeneous. The northern area had a greater anthropic influence. The study area was dividedinto north and south blocks. The total marsh area was approximately 180,000ha in which 106,600ha corresponded to the north block and 73,700ha to the south (Fig. 1).
Figure 1 - Division of the studied area in blocks. The letters refer to areas used for analysis (Block A) southern and (Block B) northern. The thick lines indicate the boundaries of the marsh area, which was surveyed.
A total of 76 transects were designed to cover the marsh area systematically along the basin (Fig. 2). They were distributed throughout the irregular
to 1300 at 70 meters altitude at an airspeed of 160 km/h on clear days with cloud cover ranging from 0-20%. All marsh deer sightings were recorded
following line-transect methodology (Burnham et al. 1980, Buckland et al. 1993), assuming that the visibility decreased as a function of distance.
Figure 2 - Transects flown along the Paraná river basin in the aerial line-transect survey conducted in September of 1998.
Data Collection and Analysis
Perpendicular distances were calculated from the aircraft’s altitude and the declination angle to the sighting (obtained with a hand-held clinometer, where 0o was at the horizon and 90o were directly below the aircraft). Search effort was suspended at the end of each line to circle before starting the next one. Sex, age class, social relation and general comments were obtained whenever possible. Two primary observers sat in the back seats and searched downwards and laterally through the flat windows on each side of the aircraft. Due to the flat window, there was a blind area under the plane. Animals within the blind area were completely missed and partially missed about the angle of 60 degrees. As suggested by Guenzel (1997), we defined 55 degrees as the effective trackline to assure the data quality. It corresponded to 49 m offset on either side of the line. The object distance was calculated by trigonometry considering the altitude and the recorded angle. Effective distance measurement was used for each sighting event and the blind spot distance was
subtracted from the measurements. In the analysis 10-degree bands were used, which yielded intervals of 55, 45, 35, 25, 15 and 5 in degrees, corresponding to distances of 0, 21, 51, 101, 212 and 751 meters.
Abundance was estimated according to standard line-transect (Burnham et al. 1980, Buckland et al., 1993). Data analysis was undertaken with the software DISTANCE (Laake et al., 1993). Perpendicular sighting data were modeled using the half normal function with cosine and hermite polynomial adjustments and the hazard rate key with cosine and simple polynomial series expansions. The model that best fitted the data was selected according to the Akaike Information Criterion (AIC) (Akaike 1985) as implemeted by Laake et al. (1993).
Abundance was estimated as:
D
A
g
L
s
f
n
A
N
ˆ
)
0
(
ˆ
2
)
0
(
ˆ
⋅
=
⋅
⋅
Where:
A is the survey area;
n is the number of sightings recorded ‘on effort’;
)
0
(
ˆ
f
is the estimated probability density function evaluated at zero distance from the trackline;s
is the mean group size; L is the total trackline length;)
0
(
ˆ
g
is the probability of detection on the trackline;D
ˆ
is the density of marsh deer.If n/L (encounter rate),
f
ˆ
(
0
)
,s
andg
ˆ
(
0
)
are independent, the estimated variance is derived according to the delta method (Buckland et al., 1993) as: + + += 2 2 2 2 2
)] 0 ( ˆ [ )] 0 ( ˆ r[ aˆ v ) r( aˆ v )] 0 ( ˆ [ )] 0 ( ˆ r[ aˆ v ) / ( ) / r( aˆ v ˆ ˆ r aˆ v g g s s f f L n L n N ) N (
Variance of encounter rate (n/L) was empirically estimated from the sample and variance of the
probability density function [
f
ˆ
(
0
)
] was calculated using maximum likelihood estimation. Becauseg
ˆ
(
0
)
was assumed to be constant, its variance was assumed to be zero for uncorrected data. Abundance estimates were obtained by multiplying the estimated density of marsh deer(
D
ˆ
) by the survey area (A). Combined data wereused to estimate
f
ˆ
(
0
)
, p and ESW. Detection probability ofg
ˆ
(
0
)
Since we did not expect to count 100% of the animals on the trackline, we proposed a correction factor to
g
ˆ
(
0
)
, because it would be less than 1 for aerial survey of marsh deer. Hence,g
ˆ
(
0
)
was estimated considering data from the aerial monitoring of 20 radio-collared animals in the area (Duarte, J.M.B. - unpublished data). Twenty marsh deer were radio-collared in July 1998 in order to monitor their behavior during the flooding process. They were tracked by helicopter and captured in nets shot from a netgun. An aircraft was used to monitor them during 20 days. Information was gathered of this monitoring to estimate the probability to see a marsh deer from an aircraft. The detection rate was estimated considering the difficulty to see the radio-collared individual at the first approach of the aircraft. When the animal wasrapidly and easily seen it was considered visible. Otherwise, it was considered invisible (or missed). The detection rate calculated in this study was 0.71 (SE=0.09), which showed that 71% of the animals, could be easily seen and 29% not. For the corrected analysis we considered
g
ˆ
(
0
)
= 0.71 andthe variance was estimated (
v
aˆ
r
=0.0081) by the program.RESULTS
General trends
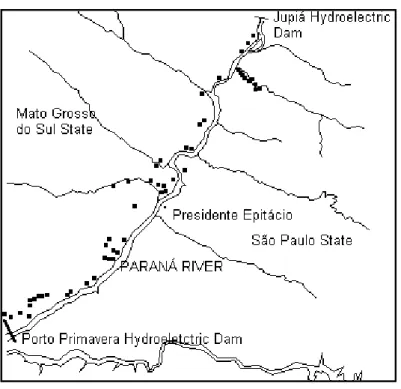
At the northern block, 39 animals were seen and at the southern 30 animals (Fig. 3).
In 74.3% of the sightings, it was not possible to identify the sex, or the age of the animals. Mature males presenting antlers were 66.66% in the identified group. There is no study about the percentage of mature males presenting antlers in the populations during September. Hence, we could not estimate the total number of males in the calculated population. Females corresponded to 22.22% of the total; a mother and a calf (5.5%) and a couple (5.5%) were also seen. Only 5.26% of the animals were lying down from 0900 to 1300; in all the remaining sightings the animals were standing in wet marsh area. Few of them were seen in dry marsh area.
Abundance estimation
Figure 3 - The dots represent the records of marsh deer through the Paraná River basin in September of 1998.
Table 1 - Parameters calculated independently for northern (B), southern (A) blocks and combining both blocks presenting the densities and population size of marsh deer before the correction of g(0).
Parameter Estimate %CV 95% Confidence Interval
Block B
f(0) 0.0084 13.14 0.0064 0.0109
p 0.1580 13.14 0.1217 0.2051
ESW 118.67 13.14 91.400 154.07
n/L 0.0695 31.68 0.0373 0.1297
D 0.0029 34.30 0.0015 0.0057
N 313.00 34.30 160.00 609.00
Block A
f(0) 0.0084 13.14 0.0064 0.0109
p 0.1580 13.14 0.1217 0.2051
ESW 118.67 13.14 91.400 154.07
n/L 0.1041 25.35 0.0624 0.1734
D 0.0043 28.55 0.0024 0.0077
N 323.00 28.55 184.00 568.00
Blocks A and B combined
D 0.0035 24.11 0.0022 0.0056
N 636.00 24.11 397.00 1018.0
Figure 4 - Frequency distribution of sightings of marsh deer. The continuous curve represents the best-fit function.
Table 2 - Parameters calculated independently for northern (B), southern (A) blocks and combining both blocks presenting the densities and population size of marsh deer after the correction of g(49).
Parameter Estimate %CV 95% Confidence Interval
Block B
f(0) 0.0084 13.14 0.0064 0.0109
p 0.1579 13.14 0.1216 0.2050
ESW 118.60 13.14 91.332 154.01
n/L 0.0695 31.68 0.0373 0.1297
D 0.0041 36.57 0.0020 0.0083
N 440.00 36.57 217.00 894.00
Block A
f(0) 0.0084 13.14 0.0064 0.0109
p 0.1579 13.14 0.1216 0.2050
ESW 118.60 13.14 91.332 154.01
n/L 0.1040 25.35 0.0624 0.1734
D 0.0061 31.24 0.0033 0.0114
N 456.00 31.24 246.00 842.00
Blocks A and B combined
D 0.0049 27.24 0.0029 0.0084
N 896.00 27.24 528.00 1522.0
f(0) – the probability density function of detected distances from the line, evaluated at zero distance; p - probability of observing an object in defined area; ESW - for line transects, effective strip width; D -estimate of density of animals (ind/ha); N - estimate of number of animals in specified area.
DISCUSSION
The corrected estimate density result for the
Paraná area (
D
ˆ
= 0.0049 ind/ha) was similar to previous studies carried out by Mourão and Campos (1995), and Pinder (1996). Considering the two blocks, different densities were calculated(Northern -
D
ˆ
=0.0041 ind/ha; and Southern-D
ˆ
=0.0061 ind/ha). The distribution and, consequently, the densities in specific areas could be different due to environmental variation and also due to human actions (Tomas et al., 1997). The northern block has been characteristically more affected by the human-related activities, mostly cattle, and clay exploitation. Hunting has also impact on marsh deer. The southern area seemed to be more preserved, probably due to the0 0,113443 0,226885 0,340328 0,45377 0,567213 0,680655 0,794098 0,90754 1,02098 1,13443
0 100 200 300 400 500 600 700 800
difficulties to access the region, because the marsh area was wider and harder to be invaded by humans and domestic animals. The flooding process would unequally affect the area. The water would more extensively cover the southern part, closer to the dam. The gradual increase in the water level would jeopardize the marsh deer available habitat, probably constraining the animals in fragmented small patches of habitat. The southern part would be completely covered by the water, affecting an estimated population of 456 individuals. Similar would happen at the northern area, but there some areas may remain in the tributaries, mainly in the Aguapeí River. There are already a considerable number of animals in Aguapeí and it is possible that the increase in density in the remaining areas may affect deer survival. Surviving animals, however, would face poor conservation condition.
Pinder (1996) reported that no marsh deer were observed in the extreme southern area to be flooded, but in our survey we observed a high concentration of animals at the southern limit, very close to the dam. Also, in contrast to this author, we registered the presence of marsh deer at Aguapeí, Peixe and Taquaruçu rivers, and confirmed the presence of animals at Pardo’s river, all tributaries of the Paraná River. These differences could be a result from the applied methodology (distribution of the transects and the total area covered) or due to migration of the animals to these areas after Pinder’s (1996) study. However, there was no evidence of large migration reported for marsh deer. Pinder (1996) also considered this species resident. We used transects randomly distributed with respect to deer because it assured a representative sample, and a valid density estimates (Buckland et al., 1993). The line transect distance sampling methodology was used for the first time to study abundance and distribution of marsh deer. This methodology was applied with success to survey marsh deer because of natural characteristic of this species. They tend to occupy open flat marsh areas, where visibility conditions are appropriate, and the individuals are widely distributed throughout the habitat. The animals were spread out through the flat marsh area not influencing the object distance calculation. The majority of the individuals close to the trackline were easily seen from the plane. The observers rotated positions during the study to minimize the observer effect. They were also trained to improve the team abilities to collect such type of data.
The assumption of no movement prior to detection is not met when marsh deer respond negatively (move away from the observer) or positively (approach the observer). Evasive movements and positive responses result in underestimation and overestimation of abundance, respectively. We did not notice evident response of the animals related to the aircraft before the detection of the sighting. We also noticed that the animals were not evidently reactive. Some sightings occurred when the animals were on the trackline, staying there till the plane passed. The fragility of aerial survey lay in the animal detectability on the line. Missed animals close to the trackline are expected. We decided to apply a correction for the detection probability to estimate the total number of animals in the area to be affected by the flooding dam. The correction would not be needed when monitoring the population along the time. In this case, it is not the total number, but some kind of variation along the time that matters. We planned to keep surveying the same area during and after the flooding to follow the changes in the habitat availability and animal’s response.
Conservation Implications
This study was important to estimate the marsh deer population that would be affected by the flooding dam. It is beyond the scope of the present study to address the political, legal and economics features that permit such enterprise. Surveys would be continuing after the flooding to estimate the population lost and the remaining sub-populations. This would address implementation of management strategies to preserve the probably fragmented remaining populations.
ACKNOWLEDGMENT
RESUMO
A população de cervo-do-pantanal (Blastocerus dichotomus) está drasticamente reduzida no Brasil. O nosso objetivo foi o de estimar a abundância do cervo-do-pantanal na bacia do Rio Paraná e discutir a metodologia aplicada. Os resultados darão suporte para uma análise do impacto do enchimento da represa de Porto Primavera sobre essa população. Sessenta e nove animais foram registrados através de sobrevôo utilizando-se a metodologia de transecção linear com amostragem das distâncias. Os dados não corrigidos resultaram em uma densidade estimada de 0,0035ind/ha e uma população de 636 indivíduos. A correção de
)
0
(
ˆ
g
para os animais que não foram vistos apresentou uma densidade de 0,0049 ind/ha e uma abundância de 896 (CV=0,27) indivíduos. A metodologia foi aplicada com sucesso na estimativa de cervo-do-pantanal. Esse resultado é importante para avaliarmos a população do cervo-do-pantanal na área e para futuramente analisarmos o impacto do enchimento da represa.REFERENCES
Akaike, H. (1985), Prediction and entropy. In:Atkinson, A. C. and Fienberg, S. E. (Eds.). A Celebration of Statistics. Berlin, GE: Springer-Verlag. pp. 1-24. Buckland, S. T.; Anderson, D. R.; Burnham, K. P. and
.Laake, J. L. (1993), Distance sampling, estimating abundance of biological populations. London, UK: Chapman and Hall.
Burnham, K. P., Anderson, D. R. and Laake, J. L. (1980), Estimation of density from line transect sampling of biological populations. Wildl. Monogr.,
72, 1-202.
Firchow, K. M.; Vaughan, M. R. and Mytton, W. R. (1990), Comparison of aerial survey techniques for pronghorns. Wildlife Society Bulletin, 18, 18-23. Guenzel, R. J. (1986), Pronghorn ecology in
southcentral Wyoming. M.S. Theses, University of Wyoming, Laramie, USA.
Guenzel, R. J. (1994), Adapting new techniques to population management, Wyoming’s pronghorn experience. Transactions of the North American Wildlife and Natural Resources Conference, 59, 189-200. Guenzel, R. J. (1997), Estimating pronghorn abundance
using aerial line transect surveys. Cheyenne, USA: Wyoming Game and Fish Department.
Johnson, B. K.; Lindsey, F. G. and Guenzel, R. J. (1991), Use of aerial line transect surveys to estimate pronghorn populations in Wyoming. Wildlife Society Bulletin, 19, 315-321.
Laake, J. L.; Buckland, S. T.; Anderson, D. R. and Burnham, K. P (1993), Distance user’s guide. Colorado Cooperative Fish and Wildlife Research Unit, Colorado State University, Fort Collins, CO 80523, USA.
Mauro, R. A. (1993), Abundância e padrão de distribuição de cervo-do-pantanal Blastocerus dichotomus (Illiger, 1815) no Pantanal Mato-grossense. Master Thesis, Universidade Federal de Minas Gerais.
Mauro, R. A.; Mourão, G. M.; Pereira da Silva, M.; Coutinho, M. E.; Tomas, W. M. and Magnusson, W. E. (1995), Influência do habitat na densidade e distribuição de cervo (Blastocerus dichotomus) durante a estação de seca no pantanal Mato-Grossense. Rev. Bras. Biologia, 55 : (4), 745-751. Mourão, G. M. and Campos, Z. (1995), Survey of
broad-snouted caimam Caimam latirostris, marsh deer Blastocerus dichotomus and capybara Hydrochoerus hydrochaeris in the area to be inundated by Porto Primavera Dam, Brasil. Biological Conservation, 73, 27-31.
Mourão, G. M.; Coutinho, M.; Mauro, R; Campos, Z.; Tomas, W. M. and Magnusson, W. (2000), Aerial surveys of caiman, marsh deer and pampas deer in the Pantanal Wetland of Brazil. Biological Conservation,
92 : (2), 175-183.
Pinder, L. (1994), Marsh deer wild population status in Brazil. In: Pinder, L. and Seal, U. (Eds.). Cervo-do-pantanal (Blastocerus dichotomus), Análise de viabilidade de população e habitat (PHVA). Botucatu: CESP. pp. 105 - 112.
Pinder, L. (1996), Marsh Deer Blastocerus dichotomus population estimate in the Paraná River, Brasil. Biological Conservation, 75, 87-91.
Schaller, G. B. and Vasconcelos, J. M. (1978), A marsh deer census in Brazil. Oryx, 14, 345-351.
Tomas, W. M.; Beccaceci, M. D. and Pinder, L. (1997), Cervo-do-Pantanal (Blastocerus dichotomus). In: Duarte, J. M. B. (Ed.). Biologia e conservação de cervídeos sul-americanos,Blastocerus, Ozotoceros e Mazama, Jaboticabal: FUNEP. pp. 24-40.
Tomas,W. M. and Salis, S. M. (2000), Diet of the marsh deer (Blastocerus dichotomus) in the Pantanal wetland, Brazil. Studies-on-Neotropical-Fauna-and-Environment, 35 : (3), 165-172.
Tomas, W. M.; Salis, S. M.; Pereira, S. M. and Mourão, G. (2001), Marsh deer (Blastocerus dichotomus) distribution as a function of floods in the Pantanal Wetland, Brazil. Studies-on-Neotropical-Fauna-and-Environment, 36 : (1), 9-13.
Wemmer, C. (1988), Deer status survey and conservation action plan. IUCN/SSC Deer Specialist Group. IUCN, Gland, Switzerland and Cambridge.