Concerns regarding wildlife conservation increased dra-matically during the twentieth century because of the extinc-tion, or near-extincextinc-tion, of several species, which was caused by human activities (e.g., hunting and fishing, and habitat degradation) or natural events (e.g., catastrophic events and disease outbreaks).
The production of hydroelectric power depends on arti-ficially built water reservoirs. The resulting inundation can cause a major loss of habitat near the source river and around the reservoir itself (BAXTER & GLAUDE 1980, REITAN & THINGSTAD 1999, ELLIS et al. 2009). Only a few studies have documented the direct effect of artificial flooding on wildlife, including in-vestigations of the effects on birds (REITAN & THINGSTAD 1999, ELLIS et al. 2009) and mammals (SZABÓ et al. 2003). The loss or degradation of habitat due to reservoir inundation can cause a decline in animal populations and species richness (GALETTI et
al. 2010). The extent to which inundations affect wildlife habi-tats is dependent upon the timing, severity, and length of the inundation (WARREN & TURNER 1975, REITAN & THINGSTAD 1999). The Sergio Motta (Porto Primavera) Dam (22°25’S, 52°58’W) is located in the Paraná River basin, between the states of São Paulo and Mato Grosso do Sul, Brazil. With the closing of the sluices, an estimated 200,000 ha of land were inundated, thus dramatically reducing the floodplain habitat for many species. One species that utilizes floodplain areas for habitat is the marsh deer, Blastocerus dichotomus Illiger, 1815; this spe-cies lives in lowland areas and has been threatened with ex-tinction (DUARTE et al. 2008, PIOVEZAN et al. 2010). The population considered in this study was constrained between the Sergio Motta and Jupiá dams; other than the habitat flooded by the lake, these animals do not have suitable alternative habitat in the region.
Severe population decline of marsh deer,
Blastocerus dichotomus
(Cetartiodactyla: Cervidae), a threatened species, caused by flooding
related to a hydroelectric power plant
Artur Andriolo
1,6, Ubiratan Piovezan
2, Mateus J.R. Paranhos da Costa
3, Hermógenes A. Torres
3,
Alexandre Vogliotti
4, Alexandre N. Zerbini
5& José M. B. Duarte
31 Departamento de Zoologia, Instituto de Ciências Biológicas, Universidade Federal de Juiz de Fora. Rua José Lourenço
Kelmer, Campus Universitário, São Pedro, 36036-900 Juiz de Fora, MG, Brazil.
2 Empresa Brasileira de Pesquisa Agropecuária, Embrapa Pantanal. Rua 21 de Setembro 1880, Nossa Senhora de Fátima,
Caixa Postal 109, 79320-900, Corumbá, MS, Brazil.
3 Universidade Estadual Paulista “Júlio de Mesquita Filho”. Via de Acesso Prof. Paulo Donato Castellane, 14884-900 Jaboticabal,
SP, Brazil.
4 Universidade Federal da Integração Latino-Americana. Av. Tancredo Neves 6731, Bloco 4, Caixa Postal 2044,
85867-970 Foz do Iguaçu, PR, Brazil.
5 Alaska Fisheries Science Center, NOAA Fisheries. 7600 Sand Point Way NE, Seattle, WA, 98115, USA. 6 Corresponding author. E-mail: [email protected]
ABSTRACT. Balancing power production and environmental conservation can be problematic. The objective of this study was to investigate the abundance of marsh deer in the Paraná River Basin, above the Sergio Motta (Porto Primavera) Dam, before and after the impact of the dam closure. A fixed-wing, flat window aircraft was used to survey study transects. Observations were recorded based on the distance sampling line transect method, assuming that the detec-tion probability decreases with increased distance. The abundance of marsh deer in the survey region prior to flooding was estimated to be 974 individuals (CV = 0.23). The overall abundance dropped from 974 to 444 (CV = 0.26) individu-als after flooding, an overall reduction of 54%. This reduction can be attributed to the direct impact of the flooding process, but it was likely exacerbated by indirect effects, such as increased disease, hunting, and reduction in food availability. Prior to flooding, the marsh deer was distributed widely throughout the dam’s catchment area; however, the marsh deer habitat was almost completely destroyed by the flooding process. This situation highlights the need to implement management strategies that ensure the survival of the remaining fragmented population.
The marsh deer is the largest South American deer. Origi-nally much more widely distributed throughout South America (NOWAK & PARADISO 1991), the marsh deer now occurs in east-central and northeastern Argentina, west-east-central and south-ern Brazil, Paraguay, southeastsouth-ern Peru, and eastsouth-ern Bolivia. The species has been extirpated from Uruguay (PIOVEZAN et al.
2010). Populations’ sizes are declining throughout the species’ range due to excessive hunting and conversion of wetlands for agriculture, tree plantations, and dams. In Brazil, hydroelec-tric plant projects have eliminated floodplain habitats along many large rivers, including the Tiete, Paraná, and Rio Grande, and cattle ranching has severely reduced and fragmented flood-plain habitats (MÁRQUEZ et al. 2006, DUARTE et al. 2008). The marsh deer is a marsh-obligated animal that is integrated with marsh vegetation ecology. The marsh environment is dynamic and recycles naturally when hydrologic and geomorphic fea-tures are balanced.
Aerial surveys of marsh deer have been conducted since 1976 (SCHALLER & VASCONCELOS 1978, PINDER 1994, 1996, MAURO
et al. 1995, MOURÃO & CAMPOS 1995, ANDRIOLO et al. 2001, 2005). PINDER (1994) estimated the Brazilian population of marsh deer to be 50,950 individuals, with only 1,300 animals in protected areas.
Aerial surveys using fixed-wing aircraft and following a line transect distance sampling methodology were conducted specifically to estimate marsh deer abundance because marsh deer tend to occupy flat low lands and are widely distributed on floodplain areas (ANDRIOLO et al. 2001, 2005, 2010a).
The formation of lakes associated with hydroelectric dams causes significant environmental change at various eco-logical levels. However, there is widespread ignorance concern-ing the negative effects of hydroelectric plants on wildlife, especially deer species. The potential impact of increasing hy-droelectric energy development has prompted concern amongst conservationists, scientists and managers about the future of the Brazilian marsh deer population. Our objective was to investigate the marsh deer abundance and distribution in the Paraná River Basin above the Sergio Motta (Porto Primavera) Dam, before and after dam closure, to provide in-formation that can support future strategies for species con-servation and management.
MATERIAL AND METHODS
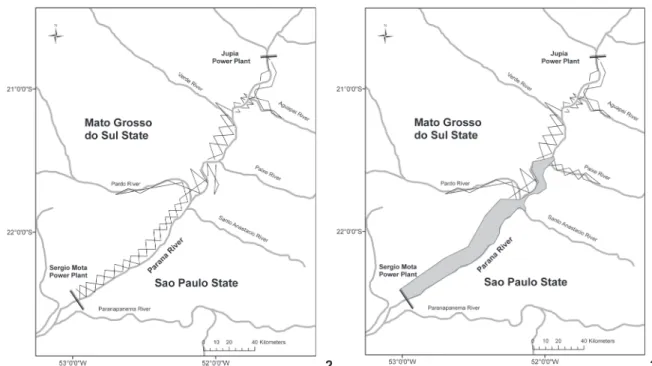
The Paraná River flows southward from central Brazil to Paraguay and Argentina and is the site of two major hydro-electric power plants (Itaipu and Jupiá). The surveyed area cor-responds to the stretch of the Paraná River between the Sergio Motta (Porto Primavera) Dam in the south and the Jupiá Dam in the north. The surveyed area was divided into seven blocks: Aguapeí, Peixe, Lagoa SP, Paraná N, Pardo, Paraná M and Paraná S (Fig. 1). The study area is not entirely homogeneous and the northern area is more affected by human activities.
The Paraná riverine plains are up to 10 km wide in Mato Grosso do Sul (Paraná N, Pardo, Paraná M and Paraná S), while the discontinuous floodplains of São Paulo (Aguapeí, Peixe, Lagoa SP) do not exceed 2 km in width. The plains immediately adjacent to the river are 50 m above sea level and are designated as ‘lowland floodplains’. Farther from the river, a more ancient sedimentation plain is found a few meters higher. Lowland flood-plains consist primarily of marshes and grasslands that are sea-sonally flooded in January and February. Several forest islands are interspersed in these marshlands above the flood line and parallel to the river. Bordering the marshlands are slopes that have been transformed into pasture lands (PINDER 1996).
The total floodplain area is approximately 200,000 ha. Ini-tially, a total of 76 transects were designed to systematically cover the area along the basin. The transects were randomly and evenly distributed in the irregular area of the floodplain (Fig. 2).
The strategy of dam closure divided the lake filling pro-cess into two phases: the first began on November 28, 1998, filling approximately 75% (253 m cote) of the lake and the sec-ond began on February 2, 2001, completing the filling process (257 m cote).
the aerial survey methodology. The crew flew over a total of 62 transects, encompassing 742 km in length, in which 55 ani-mals were sighted. The data obtained during the training phase (May 1998) were not included in the analysis.
The first survey (September 1998) preceded the closing of the gates of the dam and was conducted between September 6 and 11, 1998 (Fig. 2). The second survey (February 1999) was performed between February 25 and 26, 1999, after the first lake-filling phase (November 1998). After the flooding, transects in the southern area (Paraná S and Paraná M) were no longer accessible. The remaining transects in the northern area were surveyed (Aguapeí, Lagoa SP, Paraná N and Pardo), as was a newly added area (Peixe block, Fig. 3).
The third survey (November 1999) occurred between 16 and 17 November 1999 and the fourth survey (December 2000) was carried out between 5 and 7 December, 2000. Table I pre-sents the details of the survey regions and their sizes, as well as the area covered, the number of transects and the sampling effort (km) for each of the surveys used in the analysis.
A fixed-wing, flat window Cessna aircraft (model 182 in the training survey and model 172 in the subsequent surveys), equipped to carry four people, was used to survey the desig-nated transects. The pilot and the data recorder occupied the front seats and the two observers occupied the back seats. The crew flew only on clear days, with cloud cover ranging from 0-40%, from 0900 to 1400 at 70 m in altitude and at an airspeed of 160 km/h.
Figures 2-3. Transects flown along the Paraná River basin in the aerial line-transect survey conducted before flooding (2) in September 1998, and after flooding (3) in February 1999, November 1999, and December 2000. The grey polygon represents the area affected by lake formation.
2 3
Table I. Summary of the sample regions surveyed in different years, including area, number of transects (N), area covered and effort.
Sample date Region (kmArea2) N Area covered(km2) Effort(km)
Sep-98 Aguapeí 89.0 7 23.91 56.40
Lagoa SP 144.7 4 26.08 61.50 Paraná M 566.0 16 68.77 162.20 Paraná N 699.3 28 132.08 311.50 Paraná S 330.5 14 53.42 126.00 Pardo 179.6 7 48.12 113.50
Total 2,009.1 76 352.38 831.10
Feb-99 Aguapeí 89.0 7 21.43 50.54
Paraná N 699.3 27 101.32 238.96 Pardo 179.6 9 40.85 96.35 Peixe 88.2 15 25.18 59.39
Total 1,056.1 58 188.78 445.24
Nov-99 Aguapeí 89.0 8 25.59 60.36
Paraná N 699.3 28 104.71 246.95 Pardo 179.6 8 37.15 87.61 Peixe 88.2 10 23.05 54.36
Total 1,056.1 54 190.50 449.28
Dec-00 Aguapeí 89.0 8 26.44 62.35
Paraná N 699.3 25 93.82 221.28 Pardo 179.6 7 36.18 85.32 Peixe 88.2 10 21.43 50.55
Total 1,056.1 50 177.87 419.5
The search effort was suspended at the end of each transect to allow the plane to circle before the start of the next transect. Visual confirmations of animal occurrences were re-corded with the corresponding GPS coordinates and the verti-cal declination was registered using a handheld clinometer (where the horizon is set to 0 degrees and 90 degrees is directly below the aircraft) for subsequent distance calculations. There was a blind area below the plane due to the flat window. The sex of the animals and other information were recorded when-ever possible. The recordings were made according to the dis-tance sampling line transect method (BURNHAM et al. 1980, BUCKLAND et al. 1993), with the assumption that visibility de-creases with distance.
Perpendicular distances were calculated from the aircraft’s altitude and the declination angle to the sighting. The dis-tances of animals from the transect line could not be accu-rately calculated for declinations greater than or equal to 60 degrees; thus, only observations of animals at declinations of 55 degrees or less were considered to ensure data quality (GUENZEL 1994, 1997). This value corresponded to 49 m on each side of the transect line and was subtracted from the calcu-lated distance for each observation [g (49) = g(0) = 1]. The dec-lination was also subdivided into bands (e.g., ANDRIOLO et al.
2006, 2010b) of 10-degree cluster distances, which yielded in-tervals of 55, 45, 35, 25, 15 and 5 degrees, corresponding to distances of 0, 21, 51, 101, 212 and 751 m, respectively. The truncation was performed at 212 m.
The following strategies were considered in the study: 1) Modeled ungrouped perpendicular distance data truncated at 212 m; 2) Modeled grouped perpendicular distance data trun-cated at 212 m (ANDRIOLO et al. 2005).
The detection probability was assumed to be the same as the calculated probability of ANDRIOLOet al. (2005). The analy-sis incorporated g(0) = 0.71 as a correction for missing animals and observer losses.
Abundance was estimated according to standard line-transect methods (BURNHAM et al. 1980, BUCKLAND et al. 1993). Data were analyzed using the R software (R CORE TEAM 2012) with the MCDS package (LAAKE et al. 2011).
The effects of covariates were incorporated into the detec-tion funcdetec-tion model by setting the scale parameter in the model to be an exponential function of the covariates. One advantage of this method is that it prevents sample size reduction due to stratification and therefore minimizes bias and a loss of preci-sion. This method also allowed several covariates to be incorpo-rated into the estimation procedure (MARQUES & BUCKLAND 2004). The proposed models were the half normal and hazard rate models with the following covariate possibilities: 1) no covariate; 2) group size covariate – to investigate the effect of group size on the detection probability; 3) region covariate – to investigate the effect of differences in the region on the detection probability; and 4) period covariate – to investigate the effect of period (dry/wet) on the detection probability.
The only plausible models were options 1 and 4 above. Models incorporating the group size covariate were counter-intuitive (e.g., the detection probability decreased as distance from the line increased) and models with the region covariate needed to be evaluated in relation to the possible differences across areas.
The abundance variation was tested for significance us-ing the Delta Method (SEBER 1982). The four surveys provided the following abundance estimates: Aa, Ab, Ac and Ad. The goal was to obtain A (the difference between the Aa estimate and the average of the Ab, Ac and Ad estimates) and var(A) (POWELL 2007).
RESULTS
A total 134 sightings were performed and 153 individu-als were observed on effort and considered in the analysis. Table II presents the model selections based on the Akaike Informa-tion Criterion (AIC) values. There was essentially no differ-ence in the estimates using the half normal or hazard rate methods. The model parameter and abundance estimates were also similar for the two models. The number of sightings, the encounter rates and the number of individuals are summarized in Table III.
Table II. Summary of model selection statistics for the pooled marsh deer data.
Model npar AIC DeltaAIC Weight p CV
Hazard rate 2 371.2992 0 0.367963 0.50 0.15 Half normal 1 371.6936 0.394425 0.302104 0.53 0.08 Hazard rate + period
covariate 3 372.5857 1.286507 0.193394 0.49 0.15 Half normal + period
covariate 2 373.2819 1.982748 0.136539 0.53 0.08 Number of parameters (npar); Akaike Information Criterion (AIC); probability of detection (p); coefficient of variation (CV).
Figure 4 presents the distribution of perpendicular dis-tances and the fit of the detection function. Based on the AIC values, the hazard-rate model best fit the perpendicular dis-tance data. Table IV presents the abundance estimates for grouped (4 bins) data truncated at 212 m.
The overall abundance dropped from 974 individuals before the flooding to 395 (February 1999), 502 (November 1999) and 444 (December 2000) individuals after the flooding, with a reduction of 54% from the first, pre-flooding estimate to the last estimate. This reduction was statistically significant [A = 527, CV = 0.45, SE = 236; Var(A) = 55,693.19, LCL = 64 and UCL = 989]. Although there was a severe and statistically nificant reduction in abundance, the density did not vary sig-nificantly.
DISCUSSION
Distribution and abundance
The distribution of marsh deer was not uniform through-out the basin area. The northern block was more affected by human-related activities, which for the most part consisted of cattle ranching and clay exploitation. Hunting and diseases can also have an impact on marsh deer (SZABÓ et al. 2003, MACHADO et al. 2006, ARAÚJO JR et al. 2010, PIOVEZAN et al. 2010). The southern area was less impacted by human activities, most likely because the region is difficult for both humans and do-mestic animals to access due to the width of the marsh area (SZABÓ et al. 2003, 2007).
The estimated mean density prior to flooding was 0.48 deer/km2 for the area around the Sergio Motta (Porto Primavera)
Dam. According to a helicopter survey conducted in 1992, the marsh deer density was estimated to be 0.51 deer/km2 (MOURÃO
& CAMPOS 1995); in 1993, density was estimated to be 0.50-0.54 deer/km2 for the same area (PINDER 1996). The gradual
in-crease in water level jeopardized the availability of marsh deer habitat, constraining the animals to some small, fragmented patches of habitat. After flooding, there was a higher density of animals in some of the remaining areas of Paraná N, a fact that was expected given the population size and the reduction
Table III. Parameters estimated based on the surveys of marsh deer along the Paraná Basin in different years.
Sample date Region s ERs SE (ERs) n ERn SE (ERn) Sep-98 Aguapeí 13 0.23 0.09 16 0.28 0.13
Lagoa SP 1 0.02 0.02 1 0.02 0.02 Paraná M 10 0.06 0.03 10 0.06 0.03 Paraná N 11 0.04 0.01 11 0.04 0.01 Paraná S 17 0.13 0.04 18 0.14 0.04 Pardo 6 0.05 0.02 7 0.06 0.03
Total 58 63 0.03
Feb-99 Aguapeí 2 0.04 0.03 2 0.04 0.02 Paraná N 13 0.05 0.02 14 0.06 0.01 Pardo 3 0.03 0.01 3 0.03 0.09 Peixe 5 0.08 0.08 6 0.10 0.09
Total 23 25 0.02
Nov-99 Aguapeí 10 0.17 0.07 11 0.18 0.04 Paraná N 14 0.06 0.02 15 0.06 0.03 Pardo 4 0.05 0.04 4 0.05 0.04 Peixe 4 0.07 0.03 5 0.09 0.02
Total 32 35 0.03
Dec-00 Aguapeí 3 0.05 0.02 6 0.10 0.08 Paraná N 9 0.04 0.01 10 0.05 0.01 Pardo 4 0.05 0.02 5 0.06 1.25 Peixe 5 0.10 0.05 9 0.18 1.80
Total 21 30
Number of sighting (s); encounter rate (ER); standard error (SE), and number of individuals (n).
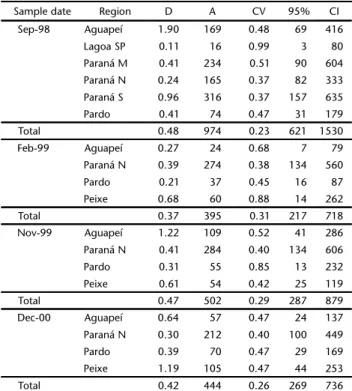
Table IV. Marsh deer abundance estimates by year for the different survey areas.
Sample date Region D A CV 95% CI
Sep-98 Aguapeí 1.90 169 0.48 69 416
Lagoa SP 0.11 16 0.99 3 80
Paraná M 0.41 234 0.51 90 604 Paraná N 0.24 165 0.37 82 333 Paraná S 0.96 316 0.37 157 635
Pardo 0.41 74 0.47 31 179
Total 0.48 974 0.23 621 1530
Feb-99 Aguapeí 0.27 24 0.68 7 79
Paraná N 0.39 274 0.38 134 560
Pardo 0.21 37 0.45 16 87
Peixe 0.68 60 0.88 14 262
Total 0.37 395 0.31 217 718
Nov-99 Aguapeí 1.22 109 0.52 41 286
Paraná N 0.41 284 0.40 134 606
Pardo 0.31 55 0.85 13 232
Peixe 0.61 54 0.42 25 119
Total 0.47 502 0.29 287 879
Dec-00 Aguapeí 0.64 57 0.47 24 137
Paraná N 0.30 212 0.40 100 449
Pardo 0.39 70 0.47 29 169
Peixe 1.19 105 0.47 44 253
Total 0.42 444 0.26 269 736
Density (D); abundance (A); coefficient of variation (CV); confidence interval (CI).
of habitat availability associated with the filling of the dam. However, the overall density per year was found to be stable, possibly because the habitat was at its maximum carrying ca-pacity. A similar effect was documented for several species of birds that were confined to smaller territories with less food, which caused reduced nesting attempts and nesting success (FLESHMAN & KAUFMAN 1984).
Evasive movements and positive responses to the aircraft could have resulted in either the under- or overestimation of abundance, respectively. However, we did not notice a distinct response from the animals related to the aircraft and some sightings occurred when the animals were on the transect line. The line-transect aerial survey methodology, performed in 1998 (ANDRIOLO et al. 2005), estimated the population to be 896 individuals (CV = 0.27). The abundance of marsh deer in the region surveyed for the present study prior to flooding was estimated to be 974 individuals (CV = 0.23). The difference in abundance can be accounted for by the standard error of both results. PINDER (1996), in 1992 and MOURÃO & CAMPOS (1995), in 1993, estimated population sizes of 950 and 650 individuals, respectively, for the same area; thus, this is the second largest population of this vulnerable species reported in Brazil.
Population decline
The abundance results for the survey in February 1999 (0.37 deer/km2), after the flooding, was smaller than previous
estimates, but not significantly so. A period parameter was in-corporated into the analysis, but it did not have a significant
effect. The water level in the marsh area likely affected the visibility of the animals. Similarly, PINDER (1996) and ANDRIOLO
et al. (2005) verified that the animals were more visible during the dry season than they were during the rainy season. MAURO
et al. (1995) indicated that the deer have a marsh habitat pref-erence related to the depth of the floodplain area. The depth of the water in lowland areas varies throughout the year and may affect the distribution of marsh deer. During the rainy season, the animals move closer to the higher, drier forest ar-eas. Therefore, it becomes more difficult to see them from an observational aircraft.
During the phases occurring one (November 1999) and two (December 2000) years after flooding, the overall popula-tion density remained at the same level (0.47 and 0.42 deer/ km2, respectively). The consistency of these density results from
the years after flooding might indicate the carrying capacity of the environment. The density was expected to be higher in the remaining areas; however, our results indicate otherwise. An analysis of the direct impact on marsh deer by radio-track-ing individuals in the flooded region has documented 20% of the direct deaths and 40% of the long-term deaths and animal emigration. Animals found outside the marsh area (DUARTE et al. 2003) were more vulnerable to hunters and in poor physi-cal condition, likely because of a dearth of food and intraspe-cific agonistic interactions. Under these conditions, animals died primarily from diseases and starvation (DUARTE et al. 2003, SZABÓ et al. 2003, MACHADO et al. 2006, ARAÚJO JR. et al. 2010). Figures 5-6. Marsh deer distribution in the Paraná River basin before flooding (5) and after flooding (6); deer are represented by black dots. The grey polygon indicates the area affected by lake formation.
Conservation
The overall abundance of marsh deer dropped from 974 to 444 individuals during the study period, a reduction of 54%, which can likely be attributed to the direct impact of the flood-ing process, exacerbated by indirect effects, such as increased disease, hunting and a reduction in food availability. Similar changes in abundance following habitat degradation have been observed in other species. Drastic reductions were documented for populations of the endangered southwestern Willow Fly-catcher, Empidonax traillii extimus A.R. Phillips, 1948 (Passeriformes: Tyrannidae). The population of this bird spe-cies decreased 47%, from 209 territories in 2004 to 111 territo-ries in 2006, in response to habitat changes (ELLIS et al. 2009). The marsh deer case presented here reveals a sharp de-cline over the original area of occurrence, with habitat reduc-tion being one of the greatest threats to the species in Brazil (WEMMER 1998). In this context, the construction of dams with large reservoirs for the production of electric power is undoubt-edly a major contributor to the reduction of habitat because of the advancement of water onto the floodplains adjacent to the dammed watershed. Although habitat reduction is known to be the main threat to marsh deer, little is known about the ecology and behavior of this species in its natural environ-ment. In addition, the ecological and behavioral changes fol-lowing environmental changes from flooding caused by hydroelectric plants have not yet been assessed. The last large populations of marsh deer are found along the Araguaia, Tocantins and Guaporé Rivers, which are included in the Bra-zilian power matrix plan. The species has also been approach-ing extinction in the State of São Paulo (DUARTE & VOGLIOTTI 2009). Past conservation efforts have included the reintroduc-tion of eight adult marsh deer in the Jataí Ecological Stareintroduc-tion, which were released back into the wild in December of 1998 (FIGUEIRA et al. 2005). All of the reintroduced animals came from the flooded areas of the Paraná River Basin.
The conservation outlook for the animals that survived the flooding does not look promising. The habitat remaining in the northern areas were considered to be too small to support a large population of marsh deer. Prior to flooding, the marsh deer population was distributed widely throughout the dam’s catchment area; this habitat has now been almost completely destroyed from the lake filling process. The findings of this study highlight the need to implement management strategies that preserve the remaining fragmented populations. The distribu-tion of marsh deer is more fragmented now than prior to the flooding and a non-equilibrium meta-population is expected for the marsh deer (VAN OORT et al. 2010). Further, the genetic information obtained from the current population reveals low genetic diversity (OLIVEIRA et al. 2005, 2009, MÁRQUEZ et al. 2006, LEITE et al. 2007), which may contribute to susceptibility to new selective pressures in the changing environment. Mountain cari-bou and other wide-ranging species that have been fragmented into subpopulations by human actions may appear to be part of
a meta-population, but unless they have the innate ability to disperse among subpopulations, the distribution is more likely akin to the geographic pattern of the extinction process. A meta-population strategy for the conservation of marsh deer must incorporate the remaining population of the Paraná River Basin and consider the genetic isolation of the remaining sub-popula-tions. New research must be carried out to provide information on permit plan elaboration and decision strategies for marsh deer conservation and social/economic development.
ACKNOWLEDGMENTS
We would like to thank our observers, Ellen Wang, Marcos de Lucca Jr, Mauro S. Teodoro, and Hernani G. de Cunha Ramos, and the pilots Calixto and David. We would also like to thank the anonymous reviewers, whose suggestions have greatly improved this manuscript. This study was financially supported by CESP (Companhia Energética de São Paulo). We would also like to thank the logistic support of FUNEP (Fundação de Estudos e Pesquisas em Agronomia, Medicina Veterinária e Zootecnia) and UNESP (Universidade Estadual Paulista – Jaboticabal). A. Andriolo, U. Piovezan, M.J.R. Paranhos da Costa, H. A. Torres, A. Voglioti and J.M.B. Duarte participate in the Núcleo de Pesquisa e Conservação de Cervídeos (NUPECCE), U. Piovezan, M.J.R. Paranhos da Costa and H.A. Torres participate in the Grupo de Estudos e Pesquisas em Etologia e Ecologia (ETCO).
LITERATURE CITED
ANDRIOLO, A.; U. PIOVEZAN; M.J.R.P. COSTA & J.M.B. DUARTE. 2001. Line-transect sampling method used to evaluate the impact of a flooding dam on marsh deer (Blastocerus dichotomus) population in the Paraná river, Brazil. Deer Specialist Group Newsletter16: 1-2.
ANDRIOLO, A.; U. PIOVEZAN; M.J.R.P. COSTA; J.L. LAAKE & J.M.B. DUARTE. 2005. Aerial transect survey to estimate abundance of marsh deer (Blastocerus dichotomus) (Illiger, 1815). Brazilian Archives of Biology and Technology48 (5): 807-814. ANDRIOLO, A.; C.C.A. MARTINS; M.H. ENGEL; J.L. PIZZORNO; S.
MAS-ROSA; A.C. FREITAS; M.E. MORETE & P.G. KINAS. 2006. The first aerial survey to estimate abundance of humpback whales (Megaptera novaeangliae) in the breeding ground off Brazil (breeding stock a). Journal of Cetacean Research and Management8 (3): 307-11.
ARAÚJO JR, J.P.; M.F. NOGUEIRA & J.M.B. DUARTE. 2010. Survey for foot-and-mouth disease in the endangered marsh deer (Blastocerus dichotomus) from marshlands of the paraná river basin, brazil. Journal of Wildlife Diseases46: 939-943. BAXTER, R.M. & P. GLAUDE. 1980. Environmental effects of dams and
impoundments in canada: Experience and prospects. Canadian Bulletin of Fisheries and Aquatic Sciences205: 1-34. BUCKLAND, S.T.; D.R. ANDERSON; K.P. BURNHAM & J.L. LAAKE. 1993.
Distance sampling: Estimating abundance of biological populations. London, Chapman & Hall.
BURNHAM, K.P.; D.R. ANDERSON & J.L. LAAKE. 1980. Estimation of density from line transect sampling of biological populations. Wildlife Monographs72: 1-202.
DUARTE, J.M.B. & A. VOGLIOTTI. 2009. Blastocerus dichotomus
(Illiger, 1815), p. 65. In: P.M. BRESSAN; M.C.M. KIERULFF & A.M. SUGIEDA (Eds). Fauna ameaçada de extinção do estado de São Paulo: Vertebrados. São Paulo, Secretaria do Meio ambiente.
DUARTE, J.M.B.; H.A. TORRES; H.G.C. RAMOS & M.R.S. LEMES. 2003. Efeito de uma usina hidrelétrica sobre a mortalidade de cer-vos-do-pantanal (Blastocerus dichotomus). Relatório final do projeto cervo-do-pantanal de porto primavera.Jaboticabal, UNESP.
DUARTE, J.M.B.; D. VARELA; U. PIOVEZAN; M.D. BECCACECI & J.E. GARCIA. 2008. Blastocerus dichotomus. In: IUCN (Ed.). IUCN Red List of Threatened Species. Version 2011.2.Available online at: http://www.iucnredlist.org [Accessed: 21/XI/2011]. ELLIS, L.A.; S.D. STUMP & D.M. WEDDLE. 2009. Southwestern willow flycatcher population and habitat response to reservoir inun-dation. Journal of Wildlife Management73 (6): 946-954. FIGUEIRA, C.J.M.; J.S.R. PIRES; A. ANDRIOLO; M.J.R.P. COSTA & J.M.B.
DUARTE. 2005. Marsh deer (Blastocerus dichotomus) reintro-duction in the jatai ecological station (luis antonio, sp): Spatial preferences. Brazilian Journal of Biology65 (2): 263-270. FLESHMAN, C. & D.S. KAUFMAN. 1984. California riparian systems:
Ecology, conservation, and productive management, p. 482-494. In: R.E. WARNER & K.M. HENDRIX (Eds). Ecology, Conser-vation, and Productive Management. Berkley, University of California Press.
GALETTI, M.; R. PARDINI; J.M.B. DUARTE; V.M.F. SILVA; A. ROSSI & C.A. PERES. 2010. Mudanças no código florestal e seu impac-to na ecologia e diversidade dos mamíferos no brasil. Biota Neotropica10 (4): 47-52.
GUENZEL, R.J. 1994. Adapting new techniques to population management: Wyoming’s pronghorn experience, p. 189-200. In: Transactions of the North American Wildlife and Natural Resources Conference. Anchorage, Wildlife Management Institute Publications Department.
GUENZEL, R.J. 1997. Estimating pronghorn abundance using aerial line transect surveys. Cheyenne, Wyoming Game and Fish Department.
LAAKE, J.L.; D. BORCHERS; T. LEN; D. MILLER & J. BISHOP. 2011. Mark-recapture distance sampling (MRDS). R package version
2.1.4. Available online at: http://cran.r-project.org/web/ packages/mrds [Accessed: 19/XI/2013].
LEITE, K.C.E.; R.G. COLLEVATTI; T.R. MENEGASSO; W.M. TOMAS & J.M.B. DUARTE. 2007. Transferability of microsatellite loci from cervidae species to the endangered Brazilian marsh deer, Blastocerus dichotomus. Genetics and Molecular Research6 (2): 325-330.
MACHADO, R.Z.; J.M.B. DUARTE; A.S. DAGNONE & M.P.J. SZABO. 2006. Detection of Ehrlichia chaffeensis in Brazilian marsh deer (Blastocerus dichotomus). Veterinary Parasitology139: 262-266.
MARQUES, F.F.C. & S.T. BUCKLAND. 2004. Covariate models for the detection function, 31-47. In: S.T. BUCKLAND; D.R. ANDERSON; K.P. BURNHAM; J.L. LAAKE; D.L. BORCHERS & L. THOMAS (Eds). Advanced distance sampling.Oxford, Oxford University Press.
MÁRQUEZ, A.; J.E. MALDONADO; S. GONZÁLEZ; D. BECCACECI; J.E. GARCIA & J.M.B. DUARTE. 2006. Phylogeography and pleistocene demographic history of the endangered marsh deer (Blastocerus dichotomus) from the rio de la plata basin. Conservation Genetics7: 563-575.
MAURO, R.A.; G.M. MOURÃO; M. PEREIRA DA SILVA; M.E. COUTINHO; W.M. TOMAS & W.E. MAGNUSSON. 1995. Influência do habitat na densidade e distribuição de cervo (Blastocerus dichotomus) durante a estação de seca no pantanal mato-grossense. Re-vista Brasileira de Biologia55 (4): 745-751.
MOURÃO, G. & Z. CAMPOS. 1995. Survey of broad-snouted caimam caimam latirostris, marsh deer blastocerus dichotomus and capybara hydrochoerus hydrochaeris in the area to be inundated by porto primavera dam, brasil. Biological Conservation73: 27-31.
NOWAK, R.M. & J.L. PARADISO. 1991. Walker’s mammals of the world. Baltimore, Johns Hopkins University Press, 5th ed.
OLIVEIRA, E.J.F.; E.P.B. CONTEL; J.E. GARCIA & J.M.B. DUARTE. 2005. Genetic structure of Blastocerus dichotomus populations in the paraná river basin (Brazil) based on protein variability. Biochemical Genetics43 (5): 211-222.
OLIVEIRA, E.J.F.; J.E. GARCIA; J.M.B. DUARTE & E.P.B. CONTEL. 2009. Development and characterization of microsatellite loci in the marsh deer (Blastocerus dichotomus). Conservation Genetics10 (5): 1505-1506.
PINDER, L. 1994. Marsh deer wild population status in Brazil, p. 105-112. In: L. PINDER & U.S. SEAL (Eds). Cervo-do-pantanal (Blastocerus dichotomus): Análise de viabilidade de po-pulação e habitat (PHVA).Botucatu, CESP.
PINDER, L. 1996. Marsh deer Blastocerus dichotomus population estimate in the Paraná river, Brasil. Biological Conservation 75: 87-91.
PIOVEZAN, U.; L.M. TIEPOLO; W.M. TOMAS; J.M.B. DUARTE; D. VARELA & J.S. MARINHO-FILHO. 2010. Marsh deer Blastocerus dichotomus
POWELL, L.A. 2007. Approximating variance of demographic parameters using the delta method: A reference for avian biologists. Condor109: 949-954.
R CORE TEAM. 2012. R: A language and environment for statistical computing. R Foundation for Statistical Computing, Vienna, Austria. ISBN 3-900051-07-0. Available online at: http://www.R-project.org [Accessed: 19/XI/2013]. REITAN, O. & P.G. THINGSTAD. 1999. Responses of birds to damming – a review of the influence of lakes, dams, and reservoirs on bird ecology. Ornis Norvegica22: 3-37.
SCHALLER, G.B. & J.M. VASCONCELOS. 1978. A marsh deer census in brazil. Oryx14: 345-351.
SEBER, G.A.F. 1982. The estimation of animal abundance and related parameters. London, Chapman.
SZABÓ, M.P.J.; M. B. LABRUNA; M.C. PEREIRA & J.M.B. DUARTE. 2003. Ticks (acari: Ixodidae) on wild marsh deer (Blastocerus dichotomus) from southeast brazil: Infestations before and after
Submitted: 05.VII.2013; Accepted: 14.IX.2013. Editorial responsibility: Diego Astúa de Moraes
habitat loss. Journal of Medical Entomology40: 268-274. SZABÓ, M.P.J.; M.C. BOTELHO; H.G.C. RAMOS; M. GARCIA; K.
CASTAGNOLLI; A. PINTER; V. VERONEZ; G. MAGALHAES; J.M.B. DUARTE & LABRUNA, M.B. 2007. Species diversity and seasonality of free-living ticks (Acari: Ixodidae) in the natural habitat of wild marsh deer (Blastocerus dichotomus) in southeastern Brazil. Veterinary Parasitology143: 147-154.
VAN OORT, H.; B.N. MCLELLAN & R. SERROUYA. 2010. Fragmentation, dispersal and meta-population function in remnant populations of endangered mountain caribou. Animal Conservation14: 215-224.
WARREN, D.K. & R.M. TURNER. 1975. Saltcedar (Tamarisk chinensis) seed production, seedling establishment, and response to inundation. Journal of the Arizona-Nevada Academy of Science10: 135-144.